Downloaded 196 times


![26
7.0 References
1) Bank Negara Malaysia. (2010, Dec 16) [Online] Available at
https://fast.bnm.gov.my/fastweb/public/MainPage.do
2) Bloomberg Market Data. (2010, Dec 16) DiGi share price [Online] Available at
http://www.bloomberg.com/apps/quote?ticker=DIGI:MK
3) DiGi Publication. (2005). DiGi 2005 Annual Report
4) DiGi Publication. (2006). DiGi 2006 Annual Report
5) DiGi Publication. (2007). DiGi 2007 Annual Report
6) DiGi Publication. (2008). DiGi 2008 Annual Report
7) DiGi Publication. (2009). DiGi 2009 Annual Report
8) Midf Research. (2010, Oct 27). DiGi.com Strong growth in data with more to come.
Retrieved Dec 08th
, 2010, from http://www.midf.com.my/cms/investment-
banking/equity-beat
9) Ross, Westerfield, Jaffe & Jordan (2009). Modern Financial Management (Ed.)
Dividends and Other Payouts, pp. 537-539. McGRAW HILL
10) Tony Davies, Tony Boczko & Jean Chen (2008). Strategic Corporate Finance (Ed)
Financial Strategies from growth to maturity to decline, pp. 618-642. McGraw-Hill.
11) Brigham & Daves (2005). Intermediate Financial Management (Ed) Accounting for
financial management, pp.202-210. Thomson](https://image.slidesharecdn.com/corporatefinancestrategyprojectondigianalysisv1-150119005057-conversion-gate02/85/Corporate-finance-strategy-project-on-digi-analysis-26-320.jpg)
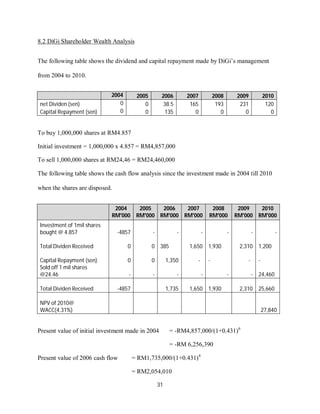

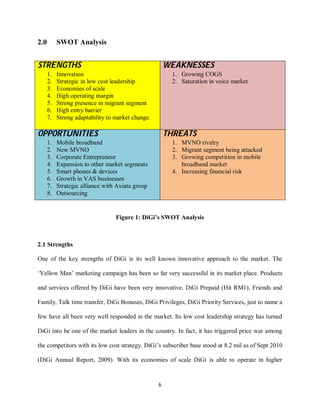
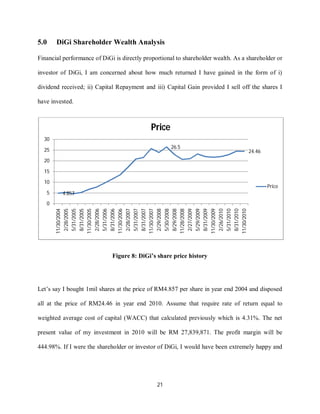
This document provides a strategic financial project analysis of DiGi, a major Malaysian telecommunications company. It includes a SWOT analysis that identifies DiGi's strengths as innovation and low cost leadership, while weaknesses include growing costs and market saturation. Opportunities exist in mobile broadband and new business models. Threats include increased competition. The document also analyzes DiGi's financial position, shareholder wealth, and recommends financial strategies like reducing debt and increasing equity to improve its position in a mature industry facing new challenges.


