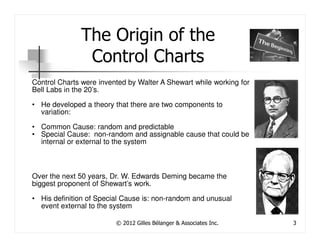
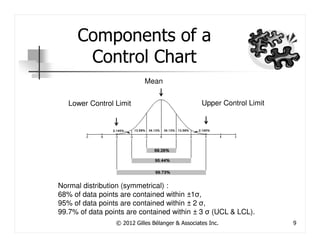
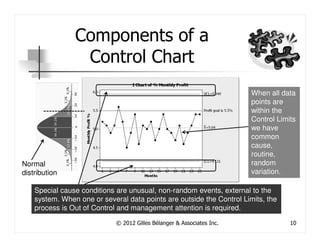
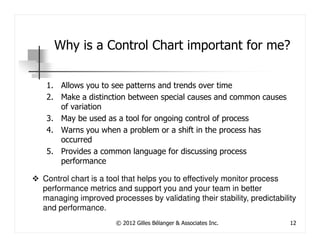
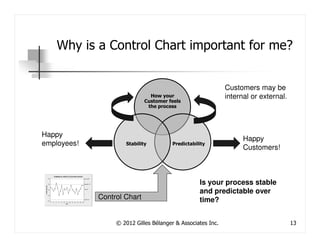
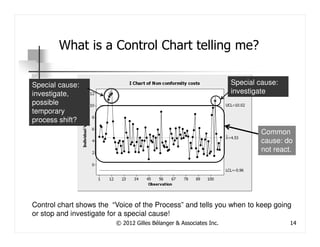
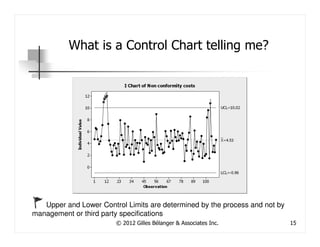
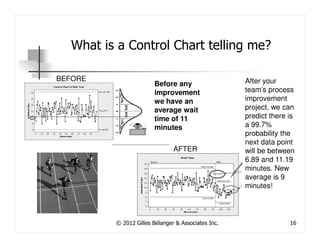
SlideShare a Scribd company logo
1 of 18
Control Chart Workshop
   for Management


                  http://www.gbna.ca
Learning Objectives

At the end of this workshop, you will be able
to:
  Interpret your control chart
  Explain the benefits of a control chart

Would you like to gain something else from
this session?


           © 2012 Gilles Bélanger & Associates Inc.   2
The Origin of the
               Control Charts
Control Charts were invented by Walter A Shewart while working for
Bell Labs in the 20’s.

• He developed a theory that there are two components to
  variation:

• Common Cause: random and predictable
• Special Cause: non-random and assignable cause that could be
  internal or external to the system


Over the next 50 years, Dr. W. Edwards Deming became the
biggest proponent of Shewart’s work.

• His definition of Special Cause is: non-random and unusual
  event external to the system

                         © 2012 Gilles Bélanger & Associates Inc.    3
Key Discussion Points

  What is a control chart and what are its
  components?
  Why is the control chart important for me and
  what is it telling me?

It provides a clear signal when management
intervention is required.


           © 2012 Gilles Bélanger & Associates Inc.   4
Shewhart’s contribution

Control chart illustrates process behavior over
                      time


      It’s a special cause detection tool
  Can also be used as a predictive tool when
              the process is stable
               © 2012 Gilles Bélanger & Associates Inc.   5
Components of a
             Control Chart


                                                           Upper and
                                                           Lower
Data Mean                                                  control Limit
is always                                                  are shown.
shown
                                                           They reflect
                                                           the Voice of
                                                           the
                                                           Process.


                © 2012 Gilles Bélanger & Associates Inc.              6
Components of a
                   Control Chart
    Upper and
    Lower
    control
    limits                                                             Upper Spec
    represents                                                         limit defined
    ±3                                                                 by
    standard                                                           management
    deviations.                                                        or a third
Standard                                                               party.
deviation is
a measure
of variation.
         The data in above control chart are within the control limits. The
         process is stable and predictable. We can predict there is a 99.7%
         probability the next data point will be between 4.13 and 5.95).
                            © 2012 Gilles Bélanger & Associates Inc.                   7
Components of a
      Control Chart
                                                             Upper Control
                                                             Limit (ULC): 3σ


                                                             Lower Control
σ= SIGMA-Letter from the Greek alphabet used in              Limit (LCL): -3σ
statistics as a symbol for standard deviation

                  © 2012 Gilles Bélanger & Associates Inc.                  8
Components of a
      Control Chart
                            Mean


   Lower Control Limit                            Upper Control Limit


Normal distribution (symmetrical) :
68% of data points are contained within ±1σ,
95% of data points are contained within ± 2 σ,
99.7% of data points are contained within ± 3 σ (UCL & LCL).
                 © 2012 Gilles Bélanger & Associates Inc.               9
Components of a
                 Control Chart
                                                                        When all data
                                                                        points are
                                                                        within the
                                                                        Control Limits
                                                                        we have
                                                                        common
                                                                        cause,
                                                                        routine,
Normal                                                                  random
distribution                                                            variation.

    Special cause conditions are unusual, non-random events, external to the
    system. When one or several data points are outside the Control Limits, the
    process is Out of Control and management attention is required.

                             © 2012 Gilles Bélanger & Associates Inc.               10
Components of a
 Control Chart


What can you conclude about the profit goal?

          © 2012 Gilles Bélanger & Associates Inc.   11
Why is a Control Chart important for me?

 1. Allows you to see patterns and trends over time
 2. Make a distinction between special causes and common causes
    of variation
 3. May be used as a tool for ongoing control of process
 4. Warns you when a problem or a shift in the process has
    occurred
 5. Provides a common language for discussing process
    performance

Control chart is a tool that helps you to effectively monitor process
performance metrics and support you and your team in better
managing improved processes by validating their stability, predictability
and performance.
                     © 2012 Gilles Bélanger & Associates Inc.          12
Why is a Control Chart important for me?


                                                             Customers may be
                               How your                      internal or external.
                             Customer feels
                              the process


Happy
                                                                   Happy
employees!           Stability          Predictability
                                                                   Customers!


                                                   Is your process stable
                                                   and predictable over
             Control Chart                         time?


                  © 2012 Gilles Bélanger & Associates Inc.                           13
What is a Control Chart telling me?

Special cause:                                                      Special cause:
investigate,                                                        investigate
possible
temporary
process shift?
                                                                            Common
                                                                            cause: do
                                                                            not react.


Control chart shows the “Voice of the Process” and tells you when to keep going
or stop and investigate for a special cause!
                         © 2012 Gilles Bélanger & Associates Inc.                    14
What is a Control Chart telling me?


   Upper and Lower Control Limits are determined by the process and not by
management or third party specifications
                        © 2012 Gilles Bélanger & Associates Inc.             15
What is a Control Chart telling me?

BEFORE                                              After your
                       Before any
                       improvement                  team’s process
                       we have an                   improvement
                       average wait                 project, we can
                       time of 11                   predict there is
                       minutes                      a 99.7%
                                                    probability the
                                                    next data point
                               AFTER                will be between
                                                    6.89 and 11.19
                                                    minutes. New
                                                    average is 9
                                                    minutes!


         © 2012 Gilles Bélanger & Associates Inc.                 16
Control Chart benefits
                          Summary

                                                              No more firefighting.
                           Better resource
                                                              React only to special
                           management!
                                                              causes that are outside
   Happier employees!                                         the Voice of the Process
                                                              Control Limits!


Higher quality of
work, no
surprises.


                          © 2012 Gilles Bélanger & Associates Inc.                       17
Questions?


Please email any question to: gbelanger@gbna.ca
                    © 2012 Gilles Bélanger & Associates Inc.   18

More Related Content

Viewers also liked

Lean Service Creation program
Lean Service Creation programLean Service Creation program
Lean Service Creation programHanno Nevanlinna
 
Control chart qm
Control chart qmControl chart qm
Control chart qmAshu0711
 
Service Dominant Logic. Changing Perspective, Revising the Toolbox - Nicola M...
Service Dominant Logic. Changing Perspective, Revising the Toolbox - Nicola M...Service Dominant Logic. Changing Perspective, Revising the Toolbox - Nicola M...
Service Dominant Logic. Changing Perspective, Revising the Toolbox - Nicola M...ServDes
 
Service Logic – a new Dominant Logic for Social Customer Relationship Marketing
Service Logic – a new Dominant Logic for Social Customer Relationship MarketingService Logic – a new Dominant Logic for Social Customer Relationship Marketing
Service Logic – a new Dominant Logic for Social Customer Relationship MarketingWim Rampen
 
Mustafa Degerli - 2016 - Developing Systems Thinking
Mustafa Degerli - 2016 - Developing Systems ThinkingMustafa Degerli - 2016 - Developing Systems Thinking
Mustafa Degerli - 2016 - Developing Systems ThinkingDr. Mustafa Değerli
 
Hoshin Kanri Strategy Deployment by Operational Excellence Consulting
Hoshin Kanri Strategy Deployment by Operational Excellence ConsultingHoshin Kanri Strategy Deployment by Operational Excellence Consulting
Hoshin Kanri Strategy Deployment by Operational Excellence ConsultingOperational Excellence Consulting
 
Total Quality Management in Healthcare
Total Quality Management in HealthcareTotal Quality Management in Healthcare
Total Quality Management in HealthcareGunjan Patel
 
Quality Assurance in Hospitals
Quality Assurance in HospitalsQuality Assurance in Hospitals
Quality Assurance in HospitalsNc Das
 
Help we are doing Lean but we are not improving by ING
Help we are doing Lean but we are not improving by INGHelp we are doing Lean but we are not improving by ING
Help we are doing Lean but we are not improving by INGInstitut Lean France
 
Hoshin Kanri for IT and IT for Hoshin Kanri by Pierre Masai, Toyota
Hoshin Kanri for IT and IT for Hoshin Kanri by Pierre Masai, ToyotaHoshin Kanri for IT and IT for Hoshin Kanri by Pierre Masai, Toyota
Hoshin Kanri for IT and IT for Hoshin Kanri by Pierre Masai, ToyotaInstitut Lean France
 
Hoshin Kanri: Creating a Strategy Deployment Plan That Gets Results
Hoshin Kanri: Creating a Strategy Deployment Plan That Gets Results Hoshin Kanri: Creating a Strategy Deployment Plan That Gets Results
Hoshin Kanri: Creating a Strategy Deployment Plan That Gets Results TKMG, Inc.
 

Viewers also liked (12)

Lean Service Creation program
Lean Service Creation programLean Service Creation program
Lean Service Creation program
 
Control chart qm
Control chart qmControl chart qm
Control chart qm
 
Service Dominant Logic. Changing Perspective, Revising the Toolbox - Nicola M...
Service Dominant Logic. Changing Perspective, Revising the Toolbox - Nicola M...Service Dominant Logic. Changing Perspective, Revising the Toolbox - Nicola M...
Service Dominant Logic. Changing Perspective, Revising the Toolbox - Nicola M...
 
Service Logic – a new Dominant Logic for Social Customer Relationship Marketing
Service Logic – a new Dominant Logic for Social Customer Relationship MarketingService Logic – a new Dominant Logic for Social Customer Relationship Marketing
Service Logic – a new Dominant Logic for Social Customer Relationship Marketing
 
Mustafa Degerli - 2016 - Developing Systems Thinking
Mustafa Degerli - 2016 - Developing Systems ThinkingMustafa Degerli - 2016 - Developing Systems Thinking
Mustafa Degerli - 2016 - Developing Systems Thinking
 
Hoshin Kanri Strategy Deployment by Operational Excellence Consulting
Hoshin Kanri Strategy Deployment by Operational Excellence ConsultingHoshin Kanri Strategy Deployment by Operational Excellence Consulting
Hoshin Kanri Strategy Deployment by Operational Excellence Consulting
 
Sqc-charts
Sqc-chartsSqc-charts
Sqc-charts
 
Total Quality Management in Healthcare
Total Quality Management in HealthcareTotal Quality Management in Healthcare
Total Quality Management in Healthcare
 
Quality Assurance in Hospitals
Quality Assurance in HospitalsQuality Assurance in Hospitals
Quality Assurance in Hospitals
 
Help we are doing Lean but we are not improving by ING
Help we are doing Lean but we are not improving by INGHelp we are doing Lean but we are not improving by ING
Help we are doing Lean but we are not improving by ING
 
Hoshin Kanri for IT and IT for Hoshin Kanri by Pierre Masai, Toyota
Hoshin Kanri for IT and IT for Hoshin Kanri by Pierre Masai, ToyotaHoshin Kanri for IT and IT for Hoshin Kanri by Pierre Masai, Toyota
Hoshin Kanri for IT and IT for Hoshin Kanri by Pierre Masai, Toyota
 
Hoshin Kanri: Creating a Strategy Deployment Plan That Gets Results
Hoshin Kanri: Creating a Strategy Deployment Plan That Gets Results Hoshin Kanri: Creating a Strategy Deployment Plan That Gets Results
Hoshin Kanri: Creating a Strategy Deployment Plan That Gets Results
 

Similar to Control chart for Managers

Continuous Auditing D.French
Continuous Auditing D.FrenchContinuous Auditing D.French
Continuous Auditing D.FrenchDan French
 
Mitramatra principles behind spc
Mitramatra principles behind spcMitramatra principles behind spc
Mitramatra principles behind spcDANANG WID
 
Advance controls 2013
Advance controls 2013Advance controls 2013
Advance controls 2013Zeeshan Khan
 
ESW2017-15 - 2016-11-04
ESW2017-15 - 2016-11-04ESW2017-15 - 2016-11-04
ESW2017-15 - 2016-11-04jagrovom
 
Novell Q2 FY2010 investor presentation
Novell Q2 FY2010 investor presentationNovell Q2 FY2010 investor presentation
Novell Q2 FY2010 investor presentationNovell
 
RAMS 2013 Calculating roi when implementing a dfr program by mike silverman
RAMS 2013 Calculating roi when implementing a dfr program by mike silvermanRAMS 2013 Calculating roi when implementing a dfr program by mike silverman
RAMS 2013 Calculating roi when implementing a dfr program by mike silvermanAccendo Reliability
 
Identity & Access Governance versus Process Agility
Identity & Access Governance versus Process AgilityIdentity & Access Governance versus Process Agility
Identity & Access Governance versus Process AgilityHorst Walther
 
Pmp exam prep Pdf- 2
Pmp exam prep Pdf- 2Pmp exam prep Pdf- 2
Pmp exam prep Pdf- 2Amr Miqdadi
 
Process Variation - Definition - Understanding the Process Variation.pptx
Process Variation - Definition - Understanding the Process Variation.pptxProcess Variation - Definition - Understanding the Process Variation.pptx
Process Variation - Definition - Understanding the Process Variation.pptxNeyGerceyLBarbosa
 
Control of Quality
Control of QualityControl of Quality
Control of QualityAditya Singh
 
Chapter 11Organizational ControlOrganizati.docx
Chapter 11Organizational ControlOrganizati.docxChapter 11Organizational ControlOrganizati.docx
Chapter 11Organizational ControlOrganizati.docxcravennichole326
 
Management Theory & Practice(Robbins, S. Coulter M.)
Management Theory & Practice(Robbins, S. Coulter M.)Management Theory & Practice(Robbins, S. Coulter M.)
Management Theory & Practice(Robbins, S. Coulter M.)cp2000
 

Similar to Control chart for Managers (20)

Control charts
Control charts Control charts
Control charts
 
Continuous Auditing D.French
Continuous Auditing D.FrenchContinuous Auditing D.French
Continuous Auditing D.French
 
Introduction To SPC
Introduction To SPCIntroduction To SPC
Introduction To SPC
 
6 Sigma - Chapter3
6 Sigma - Chapter36 Sigma - Chapter3
6 Sigma - Chapter3
 
The Road to Transformation
The Road to TransformationThe Road to Transformation
The Road to Transformation
 
Mitramatra principles behind spc
Mitramatra principles behind spcMitramatra principles behind spc
Mitramatra principles behind spc
 
Advance controls 2013
Advance controls 2013Advance controls 2013
Advance controls 2013
 
ESW2017-15 - 2016-11-04
ESW2017-15 - 2016-11-04ESW2017-15 - 2016-11-04
ESW2017-15 - 2016-11-04
 
Novell Q2 FY2010 investor presentation
Novell Q2 FY2010 investor presentationNovell Q2 FY2010 investor presentation
Novell Q2 FY2010 investor presentation
 
RAMS 2013 Calculating roi when implementing a dfr program by mike silverman
RAMS 2013 Calculating roi when implementing a dfr program by mike silvermanRAMS 2013 Calculating roi when implementing a dfr program by mike silverman
RAMS 2013 Calculating roi when implementing a dfr program by mike silverman
 
Identity & Access Governance versus Process Agility
Identity & Access Governance versus Process AgilityIdentity & Access Governance versus Process Agility
Identity & Access Governance versus Process Agility
 
Pmp exam prep Pdf- 2
Pmp exam prep Pdf- 2Pmp exam prep Pdf- 2
Pmp exam prep Pdf- 2
 
NEMEA Compliance center
NEMEA Compliance centerNEMEA Compliance center
NEMEA Compliance center
 
Process Variation - Definition - Understanding the Process Variation.pptx
Process Variation - Definition - Understanding the Process Variation.pptxProcess Variation - Definition - Understanding the Process Variation.pptx
Process Variation - Definition - Understanding the Process Variation.pptx
 
Control of Quality
Control of QualityControl of Quality
Control of Quality
 
Pm chapter 6
Pm chapter 6Pm chapter 6
Pm chapter 6
 
Pm chapter 6
Pm chapter 6Pm chapter 6
Pm chapter 6
 
Chapter 11Organizational ControlOrganizati.docx
Chapter 11Organizational ControlOrganizati.docxChapter 11Organizational ControlOrganizati.docx
Chapter 11Organizational ControlOrganizati.docx
 
Test performance indicators
Test performance indicatorsTest performance indicators
Test performance indicators
 
Management Theory & Practice(Robbins, S. Coulter M.)
Management Theory & Practice(Robbins, S. Coulter M.)Management Theory & Practice(Robbins, S. Coulter M.)
Management Theory & Practice(Robbins, S. Coulter M.)
 

Control chart for Managers

  • 1. Control Chart Workshop for Management http://www.gbna.ca
  • 2. Learning Objectives At the end of this workshop, you will be able to: Interpret your control chart Explain the benefits of a control chart Would you like to gain something else from this session? © 2012 Gilles Bélanger & Associates Inc. 2
  • 3. The Origin of the Control Charts Control Charts were invented by Walter A Shewart while working for Bell Labs in the 20’s. • He developed a theory that there are two components to variation: • Common Cause: random and predictable • Special Cause: non-random and assignable cause that could be internal or external to the system Over the next 50 years, Dr. W. Edwards Deming became the biggest proponent of Shewart’s work. • His definition of Special Cause is: non-random and unusual event external to the system © 2012 Gilles Bélanger & Associates Inc. 3
  • 4. Key Discussion Points What is a control chart and what are its components? Why is the control chart important for me and what is it telling me? It provides a clear signal when management intervention is required. © 2012 Gilles Bélanger & Associates Inc. 4
  • 5. Shewhart’s contribution Control chart illustrates process behavior over time It’s a special cause detection tool Can also be used as a predictive tool when the process is stable © 2012 Gilles Bélanger & Associates Inc. 5
  • 6. Components of a Control Chart Upper and Lower Data Mean control Limit is always are shown. shown They reflect the Voice of the Process. © 2012 Gilles Bélanger & Associates Inc. 6
  • 7. Components of a Control Chart Upper and Lower control limits Upper Spec represents limit defined ±3 by standard management deviations. or a third Standard party. deviation is a measure of variation. The data in above control chart are within the control limits. The process is stable and predictable. We can predict there is a 99.7% probability the next data point will be between 4.13 and 5.95). © 2012 Gilles Bélanger & Associates Inc. 7
  • 8. Components of a Control Chart Upper Control Limit (ULC): 3σ Lower Control σ= SIGMA-Letter from the Greek alphabet used in Limit (LCL): -3σ statistics as a symbol for standard deviation © 2012 Gilles Bélanger & Associates Inc. 8
  • 9. Components of a Control Chart Mean Lower Control Limit Upper Control Limit Normal distribution (symmetrical) : 68% of data points are contained within ±1σ, 95% of data points are contained within ± 2 σ, 99.7% of data points are contained within ± 3 σ (UCL & LCL). © 2012 Gilles Bélanger & Associates Inc. 9
  • 10. Components of a Control Chart When all data points are within the Control Limits we have common cause, routine, Normal random distribution variation. Special cause conditions are unusual, non-random events, external to the system. When one or several data points are outside the Control Limits, the process is Out of Control and management attention is required. © 2012 Gilles Bélanger & Associates Inc. 10
  • 11. Components of a Control Chart What can you conclude about the profit goal? © 2012 Gilles Bélanger & Associates Inc. 11
  • 12. Why is a Control Chart important for me? 1. Allows you to see patterns and trends over time 2. Make a distinction between special causes and common causes of variation 3. May be used as a tool for ongoing control of process 4. Warns you when a problem or a shift in the process has occurred 5. Provides a common language for discussing process performance Control chart is a tool that helps you to effectively monitor process performance metrics and support you and your team in better managing improved processes by validating their stability, predictability and performance. © 2012 Gilles Bélanger & Associates Inc. 12
  • 13. Why is a Control Chart important for me? Customers may be How your internal or external. Customer feels the process Happy Happy employees! Stability Predictability Customers! Is your process stable and predictable over Control Chart time? © 2012 Gilles Bélanger & Associates Inc. 13
  • 14. What is a Control Chart telling me? Special cause: Special cause: investigate, investigate possible temporary process shift? Common cause: do not react. Control chart shows the “Voice of the Process” and tells you when to keep going or stop and investigate for a special cause! © 2012 Gilles Bélanger & Associates Inc. 14
  • 15. What is a Control Chart telling me? Upper and Lower Control Limits are determined by the process and not by management or third party specifications © 2012 Gilles Bélanger & Associates Inc. 15
  • 16. What is a Control Chart telling me? BEFORE After your Before any improvement team’s process we have an improvement average wait project, we can time of 11 predict there is minutes a 99.7% probability the next data point AFTER will be between 6.89 and 11.19 minutes. New average is 9 minutes! © 2012 Gilles Bélanger & Associates Inc. 16
  • 17. Control Chart benefits Summary No more firefighting. Better resource React only to special management! causes that are outside Happier employees! the Voice of the Process Control Limits! Higher quality of work, no surprises. © 2012 Gilles Bélanger & Associates Inc. 17
  • 18. Questions? Please email any question to: gbelanger@gbna.ca © 2012 Gilles Bélanger & Associates Inc. 18