Constructing an Economic and Social Rights Fullfillment Index for Egypt- Eman Refaat (7) - PDF
1. I
CAIRO UNIVERSITY
FACULTY OF ECONOMICS AND POLITICAL SCIENCE
DEPARTMENT OF STATISTICS
Constructing a Rigorous Economic and Social
Rights Fulfillment Index for Egypt
Prepared by
Eman Refaat Mahmoud Ahmed
Supervised by
Dr. Ali S. Hadi
Distinguished University Professor
Chair Department of Mathematics and
Actuarial Science
The American University in Cairo
Dr. Dina M. Armanious
Associate Professor of Statistics
Department of Statistics
Faculty of Economics and Political Science
Cairo University
A thesis submitted to the Department of Statistics, Faculty of Economics and Political Science in
Partial Fulfillment of the Requirements for the M.Sc. Degree in Statistics
2013
3. III
Acknowledgement
Foremost, I would like to express my sincere gratitude to my supervisor
Prof. Ali S. Hadi for the continuous support, patience, motivation,
enthusiasm, and immense knowledge. His guidance helped me in all the
time of research and writing of this thesis. I learnt a lot from him either
statistical or research wise and really can't thank him enough.
I am also deeply grateful for my supervisor Dr. Dina M. Armanious who
gave me always her continuous advice, valuable comments and
encouragement. She continually and convincingly conveyed a spirit of
motivation to this thesis. Without her guidance and persistent help this
dissertation would not have been possible.
I would like to thank my committee members; Dr. Mohammed Ismail and
Dr. Ibrahim Hassan for their valuable comments and feedback.
I am thankful for Dr. Sahar El-Tawila for her support and motivation during
the whole process of the thesis.
I take this opportunity to express the profound gratitude from my deep heart
to my parents and for their love and continuous support – both spiritually
and materially.
My heartfelt gratitude to my husband Mahmoud who supported me and
motivated me a lot during my research, his support was an essential part for
the completion of this thesis. He really deserves great acknowledgement and
thanks, as well as my eternal love.
Eman Refaat
4. I
Abstract
This study aims at constructing a new index for Egypt that measures the fulfillment of
Economic and Social Rights (ESRFI), a composite index to measure the fulfillment of
human rights based on socio-economic surveys. The Proposed ESRF index could strengthen
policy formulation that takes into account economic and social rights fulfillment specially
by highlighting the situation in different regions and disaggregation levels. During the
construction of such an index and for the index to be rigorous, the study highlighted some of
the statistical debatable issues about composite indices and focused mainly on 6 of them.
Those issues are indicators selection, handling missing data, identification of and dealing
with outliers, scale of measurement, computing the margin of error, weights assigned for
indicators and domains and aggregation method.
The measurement process relied on the "Egyptian Household Conditions Observatory
Survey" that was conducted by the Information and Decision Support Centre in 2010 as this
is the national household survey that covers different indicators of the index. Another
advantage for the used survey that it is periodically implemented and have panel part. This
will allow in the future for following up the index trend.
The sample size is 10550 households and is representative at the national, governorates and
urban – rural levels.
The main results of the thesis include: In a scale from 0 to 100, the average score of the
ESRFI is 62.7 with minimum score of 31.2 and maximum 94.6. Inequalities between urban
and rural areas in fulfilling the economic and social rights as well as governorates were
exist. The box plots of dimensions over urban and rural areas show that rural is always
worse than urban areas in all levels of dimensions especially for the right to education and
adequate housing. The fulfillment of the right to decent work scored the lowest 42.6, while
the right to food got the highest score of 90.7. While Giza, Alexandria and Cairo got the
highest scores in fulfilling the economic and social rights, Kafr Al-Sheikh, Sohag and Assiut
got the lowest scores in fulfilling those rights.
5. II
Across different age groups, the economic and social rights fulfillment is significantly the
highest among youth and young adults. The fulfillment is the lowest among children age
group as well as adults.
Key Words: Composite index – Multivariate outliers – Indicators selection – Missing
values – Margin of error – Economic and Social Rights – Weighting – Aggregation – Scale
of measurement – Meta data.
Supervised by
Dr. Ali S. Hadi
Distinguished University Professor
Chair Department of Mathematics and
Actuarial Science
The American University in Cairo
Dr. Dina M. Armanious
Associate Professor of Statistics
Department of Statistics
Faculty of Economics and Political Science
Cairo University
6. III
Name: Eman Refaat Mahmoud Ahmed
Nationality: Egyptian
Date and place of birth: 27/02/1986, Kaliubia, Egypt
Degree: Master Grade: Very Good
Specialization: Statistics
Supervisors:
Dr. Ali S. Hadi
Distinguished University Professor
Chair Department of Mathematics and
Actuarial Science
The American University in Cairo
Dr. Dina M. Armanious
Associate Professor of Statistics
Department of Statistics
Faculty of Economics and Political Science
Cairo University
Thesis Title: "Constructing a Rigorous Economic and Social Rights Fulfillment Index for
Egypt".
Summery:
A composite index combines equities and/or other factors in a standardized way to provide a
useful statistical measure of overall performance of a targeted phenomenon over time. Such
a composite index must be understandable and easy to describe, conform to “common
sense” notions of the phenomena, able to guide policy, technically solid, operationally
viable, and easily replicable. The construction of an index, however, involves several issues
and debates. The main objective of this thesis is to construct and calculate a new “Rigorous
Economic and Social Rights Fulfillment Index for Egypt” using national survey data. In
order to achieve this main objective, the following objectives should be attained:
1. Selecting the domains and indicators that measures the economics and social rights
fulfilment based on a solid theoretical framework.
2. Highlighting debatable issues in constructing and measuring the Economic and
Social Rights Fulfillment Index (how to detect the issues and how to deal with it).
3. Aggregating all dimensions to get the final rigorous index taking into consideration
the margin of error.
7. IV
The dataset used to measure and handle the issues was "Egyptian Household Conditions
Observatory Survey" that was conducted by the Information and Decision Support Centre in
2010 as this is the household national survey that covers different indicators of the index.
Six debatable issues were highlighted; indicators selection, handling missing data,
identification of and dealing with outliers, scale of measurement, computing the margin of
error and aggregation and weights assigned for indicators and domains.
The study is divided to six chapters as follows:
Chapter One "Introduction": includes a background about the composite index, statement
of the problem, objectives of the study, literature review and organization of the Study.
Chapter Two "Composite Indices and Challenges": this handles the steps for
constructing a composite index as well as different challenges in the construction of the
composite indices and the focus of the study.
Chapter Three "The Economic and Social Rights Fulfillment Index": this chapter
specifies the theoretical framework behind the Economic and Social Rights Fulfillment
index with the list of domains and indicators and the source of data.
Chapter Four "Methodologies to handle the problems of Composite Indices": focuses
on highlighting the measurement issues of the index especially the ones concerned with;
Missing Data, Outliers, Scale of Measurement, Weighting and Aggregation and Computing
the Margin of Error.
Chapter Five "Results of Calculating the ESRF index for Egypt": presents the main
findings of measuring the Economic and Social Rights Fulfillment index.
Chapter Six "Conclusions and Recommendations": summarizes the main findings of the
study in addition to the recommendations.
8. V
Table of Contents
Chapter One: Introduction...................................................................................................1
1.1. Background...........................................................................................................1
1.2. Statement of the problem....................................................................................... 2
1.3. Objectives of the Study ......................................................................................... 2
1.4. Literature Review..................................................................................................3
1.5. Organization of the Study...................................................................................... 8
Chapter Two: Composite Indices and Challenges ................................................................ 9
2.1. Steps for Constructing a Composite Index................................................................. 9
2.2. Challenges in the Construction of the Composite Index........................................... 12
Chapter Three: The Economic and Social Rights Fulfillment Index................................... 15
3.1. Introduction......................................................................................................... 15
3.2. Definition of Domains......................................................................................... 19
3.3. Indicators Selection............................................................................................. 24
3.4. List of Domains and Indicators in the ESRF Index .............................................. 26
3.5. Source of Data..................................................................................................... 31
3.6. Results of using Cronbach's α on the dimensions of the index ............................. 33
Chapter Four: Methodologies to handle the problems of Composite Indices ...................... 35
4.1. Missing Data..................................................................................................... 35
4.2. Outliers ............................................................................................................... 47
4.2.1 Definition of Outliers ................................................................................... 47
4.2.2 Detection of Outliers .................................................................................... 48
4.2.3 How to deal with outliers ............................................................................. 53
4.3. Scale of Measurement ......................................................................................... 57
4.4. Weighting and Aggregation................................................................................. 59
4.4.1 Weighting .................................................................................................... 59
4.4.2 Aggregation ................................................................................................. 62
4.5. Computing the Margin of Error............................................................................... 63
Chapter Five: Results of Calculating the ESRF index for Egypt......................................... 65
5.1. Results of the overall Economic and Social Rights Fulfillment Index .................. 65
5.2. Results of the ESRFI five dimensions.................................................................. 74
9. VI
5.2.1 Right to Adequate Housing .......................................................................... 74
5.2.2 Right to Food............................................................................................... 80
5.2.3 Right to Decent Work .................................................................................. 85
5.2.4 Right to Education ....................................................................................... 92
5.2.5 Right to Health............................................................................................. 97
Chapter Six: Conclusions and Recommendations ............................................................ 105
References....................................................................................................................... 109
Annexes .......................................................................................................................... 115
Annex 1: Indicators Meta Data..................................................................................... 115
Annex2: Results of Neural Networks analysis.............................................................. 135
Annex3: Results of final multiple imputations over decent work variables ................... 143
List of Tables
Table 2.1: Steps for constructing a composite index .......................................................... 10
Table 3.1: List of Domains, Indicators and Variables of the ESRF index ........................... 26
Table 3.2: Sample distribution according to governorates in Egypt.................................... 32
Table 3.3: Sample distribution according to Urban and Rural Areas in Egypt .................... 32
Table 3.4: Reliability Statistics for the right to food........................................................... 33
Table 3.5: Reliability Statistics for the right to health ........................................................ 33
Table 3.6: Reliability Statistics for the right to adequate housing ....................................... 34
Table 3.7: Reliability Statistics for the right to decent work............................................... 34
Table 4.1: The 20 variables with not applicable cases ........................................................ 37
Table 4.2: Multiple Imputation Specifications for main characteristics .............................. 43
Table 4.3: Multiple Imputation Constraints on variables.................................................... 43
Table 4.4: Multiple Imputation Results.............................................................................. 44
Table 4.5: Imputation Models............................................................................................ 44
Table 4.6: Comparison between different imputation options applied ............................... 44
Table 4.7: Testing and training partitions of the Neural Networks analysis of the ESRFI ... 46
Table 4.8: Descriptive Statistics for the results of Neural Networks using Multilayer
Perceptron compared to Radial Basis function................................................................... 46
Table 4.9: Trimmed mean and median results for outliers detection................................... 55
10. VII
Table 4.10: Weight sample characteristics ......................................................................... 61
Table 4.11: Weights for the dimensions of the ESRFI........................................................ 61
Table 5.1: Descriptive Statistics for the overall ESRFI ...................................................... 65
Table 5.2: Tests of Normality ............................................................................................ 66
Table 5.3: Economic and Social Rights Fulfillment Index for Egypt by Urban - Rural....... 67
Table 5.4: Economic and Social Rights Fulfillment Index for Egypt by Regions ............... 69
Table 5.5: ANOVA Economic and Social Rights Fullfillment Index for Egypt and
governorates...................................................................................................................... 70
Table 5.6: Economic and Social Rights Fulfillment Index for Egypt by Governorates ....... 70
Table 5.7: Economic and Social Rights Fulfillment Index for Egypt by Current Marital
Status ................................................................................................................................ 71
Table 5.8: Economic and Social Rights Fulfillment Index for Egypt by Gender................. 71
Table 5.9: Economic and Social Rights Fulfillment Index for Egypt by Age...................... 72
Table 5.10: Economic and Social Rights Fulfillment Index for Egypt by Household size... 72
Table 5.11: Economic and Social Rights Fulfillment Index for Egypt by Gender of
household head.................................................................................................................. 73
Table 5.12: Economic and Social Rights Fulfillment Index for Egypt by Education of
household head.................................................................................................................. 73
Table 5.13: Descriptive Statistics of the Right to Adequate Housing.................................. 74
Table 5.14: Right to adequate housing by Urban – Rural................................................... 75
Table 5.15: Right to adequate housing by Regions............................................................. 76
Table 5.16: Right to adequate housing by Governorates .................................................... 77
Table 5.17: Right to adequate housing by Current Marital Status....................................... 77
Table 5.18: Right to adequate housing by Gender.............................................................. 78
Table 5.19: Right to adequate housing by Age................................................................... 78
Table 5.20: Right to adequate housing by Household size.................................................. 79
Table 5.21: Right to adequate housing by Gender of household head................................ 79
Table 5.22: Right to adequate housing by Education of household head ............................ 79
Table 5.23: Descriptive Statistics for the Right to Food ..................................................... 80
Table 5.24: Right to food by Urban – Rural...................................................................... 80
Table 5.25: Right to food by Regions ................................................................................ 81
Table 5.26: Right to food by Governorates ........................................................................ 82
11. VIII
Table 5.27: Right to food by Current Marital Status.......................................................... 83
Table 5.28: Right to food by Gender.................................................................................. 83
Table 5.29: Right to food by Age...................................................................................... 83
Table 5.30: Right to food by Household size ..................................................................... 84
Table 5.31: Right to food by Gender of household head .................................................... 84
Table 5.32: Right to food by Education of household head ................................................ 85
Table 5.33: Descriptive Statistics of Right to Decent Work ............................................... 85
Table 5.34: Right to decent work components .................................................................. 86
Table 5.35: Right to decent work by Urban - Rural............................................................ 87
Table 5.36: Right to decent work by Regions .................................................................... 87
Table 5.37: Right to decent work by Governorates ............................................................ 88
Table 5.38: Right to decent work by Current Marital Status............................................... 89
Table 5.39: Right to decent work by Gender...................................................................... 89
Table 5.40: Right to decent work by Age........................................................................... 90
Table 5.41: Right to decent work by Household size.......................................................... 90
Table 5.42: Right to decent work by Gender of household head......................................... 91
Table 5.43: Right to decent work by Education of household head .................................... 91
Table 5.44: Descriptive Statistics of Right to Education .................................................... 92
Table 5.45: Right to education by Urban - Rural................................................................ 92
Table 5.46: Right to education by Regions ........................................................................ 93
Table 5.47: Right to education by Governorates ................................................................ 94
Table 5.48: Right to education by Current Marital Status................................................... 95
Table 5.49: Right to education by Gender.......................................................................... 95
Table 5.50: Right to education by Age............................................................................... 96
Table 5.51: Right to education by Household size ............................................................. 96
Table 5.52: Right to education by Gender of household head............................................. 96
Table 5.53: Right to education by Education of household head ........................................ 97
Table 5.54: Descriptive Statistics of the Right to Health .................................................... 98
Table 5.55: Right to health components............................................................................ 98
Table 5.56: Right to health by Urban - Rural ..................................................................... 99
Table 5.57: Right to health by Regions .............................................................................. 99
Table 5.58: Right to health by Governorate ..................................................................... 100
12. IX
Table 5.59: Right to health by Current Marital Status ...................................................... 101
Table 5.60: Right to health by Gender ............................................................................. 101
Table 5.61: Right to health by Age .................................................................................. 102
Table 5.62: Right to health by Household size ................................................................. 102
Table 5.63: Right to health by Gender of household head ................................................ 102
Table 5.64: Right to health by Education of household head............................................ 103
Table B.1: Case Processing Summary for multilayer perceptron...................................... 135
Table B.2: Network Information for multilayer perceptron .............................................. 135
Table B.3: Multilayer Perceptron Independent Variable Importance ................................ 138
Table B.4: Case Processing Summary for radial basis function........................................ 139
Table B.5: Network Information for radial basis function ................................................ 139
Table B.6: Model Summary for radial basis function....................................................... 141
Table B.7: Independent Variable Importance for radial basis function ............................. 142
Table C.1: Imputation Specifications............................................................................... 143
Table C.2: Imputation Constraints ................................................................................... 143
Table C.3: Imputation Results ......................................................................................... 144
Table C.4: Imputation Models ......................................................................................... 144
List of Figures
Figure 3.1: General structure of the ESRF index................................................................ 17
Figure 4.1: Structure of the Neural Networks..................................................................... 45
Figure 4.2: Graphical detection of outliers in monthly salary of individuals ....................... 54
Figure 4.3: Graphical detection of outliers in crowdedness variable................................... 54
Figure 5.1: Histogram of ESRFI scores ............................................................................. 66
Figure 5.2: Normal Q-Q Plot of Economic and Social Rights Fullfillment Index for Egypt 67
Figure 5.3: Box plots for the ESRFI dimensions across urban and rural areas .................... 68
Figure 5.4: Economic and Social Rights Fulfillment Index for Egypt by Governorates ...... 69
Figure 5.5: Right to adequate housing disaggregated by its components ............................ 75
Figure 5.6: Right to adequate housing by Governorates ..................................................... 76
Figure 5.7: Right to food by Governorates......................................................................... 81
13. X
Figure 5.8: Right to decent work by Governorates............................................................. 88
Figure 5.9: Right to education by Governorates................................................................. 93
Figure 5.10: Right to health by Governorate.................................................................... 100
Figure B.1: Multilayer perceptron Network structure....................................................... 136
Figure B.2: Multilayer perceptron predicted values versus actual values.......................... 137
Figure B.3: Multilayer perceptron residuals versus predicted values ................................ 137
Figure B.4: Multilayer perceptron Independent Variable Importance............................... 138
Figure B.5: Radial basis function network structure......................................................... 140
Figure B.6: Radial basis function predicted values versus actual values ........................... 141
Figure B.7: Radial basis function residuals versus predicted values ................................. 141
Figure B.8: Radial basis function Independent Variable Importance ................................ 142
14. XI
List of Abbreviations
AAD Average of Absolute Deviations about the Median
ANN Artificial Neural Network
APF Achievement Possibility Frontier
BACON Blocked Adaptive Computationally-efficient Outlier Nominators
BAP Budget Allocation Processes
CCI Current Conditions Index
DQI Development Quality Index
ESCR Economic, Social and Cultural Rights
ESRFI Economic and Social Rights Fulfilment Index
EW Equal Weights
FA Factor Analysis
FAO Food and Agriculture Organization of the United Nations
GDP Gross Domestic Product
HDRs Human Development Reports
IIAG Ibrahim Index of African Governance
ILO International Labour Organization
IQI Institutional Quality Index
MAR Missing at Random
MCAR Missing Completely at Random
MDGs Millennium Development Goals
ME Margin of Error
MI – MCMC Multiple Imputation using Marcov Chain Monte Carlo Simulation
MLP Multilayer Perceptron
NMAR Not Missing at Random
NNs Neural Networks
OECD Organization for Economic Cooperation and Development
OHCHR Office of the High Commissioner for Human Rights
OHCHR Office of the High Commissioner for Human Rights
PCA Principal Component Analysis
RBF Radial basis function
TM Trimmed Mean
TSD Trimmed Standard Deviation
UN United Nations
UNDP United Nations Development Programme
UNESCO United Nations Educational, Scientific and Cultural Organization
UN-HABITAT United Nations agency for human settlements
US United States
WHO World Health Organization of the United Nations
15. 1
Chapter One
Introduction
1.1. Background
A composite index combines equities and/or other factors in a standardized way to provide a
useful statistical measure of overall performance of a targeted phenomenon over time. It is
also well-known that a composite index fulfills the need for a synthetic measure of the
achievements of development in a certain sector or issue.
In the past, usage of composite indices were included in many statistical and social work,
but without mentioning it as a composite index or following its current structure. Nowadays,
the composite indices are widely used in many fields and the advocacy for it and how it is
important in measuring certain phenomena – especially the multidimensional phenomena. In
addition to that, there are some changes happening every day and encourage to work more
in that area, for example; political space is opening, statistical offices around the world are
providing many guides that have a lot of the information that allow for the construction of
different indices, and many researchers around the world are believing that a summary
measure can provide a bird’s eye view and generates political and public interest.
Such a composite index must be understandable and easy to describe, conform to “common
sense” notions of the phenomena, able to guide policy, technically solid, operationally
viable, and easily replicable.
Depending on the process and statistical issues in measuring multidimensional phenomena
and the rights based approach in measuring different dimensions, the study constructed an
index that measures the fulfillment of economic and social rights in Egypt. Economic and
social issues were measured by using single dimensional (e.g. GDP), and different studies
(e.g. studies by the Organization for Economic Cooperation and Development OECD) have
shown that the GDP is not enough in measuring economic and social status that is
complicated and have many dimensions beyond GDP as an example. The study not only
covered this, but also is following in the same time rights based approach in measuring
economic and social rights to ensure the importance of the rights included in the index.
16. 2
1.2. Statement of the problem
The composite index presupposes a deliberate conceptual aggregation of separable facts.
The construction of an index, however, involves several issues and debates, which include
(Indicators selection, Handling missing data, Identification of and dealing with outliers,
Scale of measurement (Normalization), Computing the margin of error, Weights and
aggregation). This study focuses on those 6 issues through the process of the index
construction. Identifying and dealing with these issues determine to what extent the index is
rigorous (stability and variance) and efficient in describing the phenomena of interest.
Hence, this study introduces a construction of a new index for Egypt that measures the
fulfillment of Economic and Social Rights (ESRF), a composite index to measure the
fulfillment of human rights based on socio-economic surveys. During the construction of
such an index, the study highlighted some of the statistical debatable issues about composite
indices and focus mainly on 6 of them as mentioned above. The Proposed ESRF index could
strengthen policy formulation that takes into account economic and social rights fulfillment
specially by highlighting the situation in different regions and different disaggregation
levels.
The question addressed in this thesis is how to construct and calculate a rigorous Economic
and Social Rights Fulfillment Index for Egypt using a national survey data?
1.3. Objectives of the Study
The main objective of this thesis is to construct and calculate a new proposed “Rigorous
Economic and Social Rights Fulfillment Index for Egypt” using national survey data.
In order to achieve this main objective, the following objectives should be attained:
1. Selecting the domains and indicators that measures the economics and social rights
fulfilment based on a solid theoretical framework.
2. Highlighting debatable issues in constructing and measuring the Economic and
Social Rights Fulfillment Index (how to detect the issues and how to deal with it).
3. Aggregating all dimensions to get the final rigorous index taking into consideration
the margin of error.
17. 3
1.4. Literature Review
This study has two main issues, one is related to composite indices in general and another is
related to rigorous tools for diagnostics, the literature review may be classified into two
main parts, part one is the studies related to composite indices in general, part two is the
studies related to rigorous diagnostics tools, and the search came with studies that contain
some of part one and some of part two.
A study was done by UNESCO (1974) about Social indicators, which addresses the
problems of definition and selection. The paper presents three main issues: Problems of
Methodology and Selection; a method for the selection of a compact set of variables and a
method of establishing a list of development indicators. The paper made some conclusions
about social and economic indicators selection. First, increasing the number of indicators
also increases the total amount of information about the country’s level of development
importance. Second, sets of indicators of the same size do not, in general, contain the same
quantity of information about the country’s development level. Third, the total amount of
information given by a set of indicators is generally less than the sum of the quantities of
information contained individually in each indicator of that set. Fourth, despite the fact that
two given indicators may be very important from the point of view of the information they
provide, separately, about a country’s development levels, the contribution of one of them is
insignificant if there is a high degree of correlation between the two.
The Organization for Economic Co-Operation and Development (2008), presents the
processes and achievements of the national experiences, undertaken by the Metagora
community, highlighting their policy relevance and methodological implications. These
experiences illustrate how quantitative methods, properly combined with qualitative
approaches, can be applied for assessing key national issues and enhancing evidence based
reporting and monitoring mechanisms. The study also provides decision and policy makers,
analysts and civil society actors with significant examples of how sensitive data on human
rights and governance issues can be collected and analyzed. It highlights how qualitative
and quantitative data can be interrelated to provide reliable information. It shows how, on
the basis of this information, it is possible to produce national indicators which are relevant
18. 4
and useful for political decisions and actions. It also illustrates that statistical analysis and
quantitative indicators bring significant value-added to the work of national human rights
institutions, as well as to the research and advocacy of civil society organizations.
The Organization for Economic Co-Operation and Development (2008) classifies and lists a
set of indicators related to the right to education identified into three types of indicators:
structural indicators, process indicators, and outcome indicators. Structural indicators
address whether or not the requisite infrastructure is in place that is considered necessary
for, or conducive to, the realization of a specific right. Specifically, structural indicators
evaluate whether a country has established the institutions, constitutional provisions, laws,
and policies that are required. Most structural indicators are qualitative in nature and are not
based on statistical data and many can be answered by a simple yes or no. Process
indicators, along with outcome indicators, monitor the variable dimension of the right to
health that arises from the concept of progressive realization. Their key feature is that they
can be used to assess change over time. Specifically, process indicators assess the degree to
which activities that are necessary to attain specific rights-related objectives are being
implemented and the progress of these activities over time. They monitor effort and not
outcome. The types and amounts of governmental inputs are an important kind of process
indicator. Unlike structural indicators, process indicators require statistical data. Outcome
indicators assess the status of the population’s enjoyment of a right.
The Mo Ibrahim Foundation (2010) publishes a report about the Ibrahim Index of African
Governance (IIAG), which measures the extent of delivery to the citizen of a large number
of economic, social and political goods and services by governments and non-state actors.
The Index groups indicators into four main categories: Safety and the Rule of Law,
Participation and Human Rights, Sustainable Economic Opportunity, and Human
Development. The report contains all details related to the index from the first step of
construction till the values of the index for African countries in a very presentable way,
regarding the method and the methodology. Statistically, there are several challenges in
compiling and constructing the IIAG. These include choosing the most appropriate
statistical method to aggregate the data into one composite index, and at a more basic level,
finding the most suitable set of indicators that appropriately reflect governance as defined
19. 5
by the Board of the Foundation, its Founder, and its Advisory Council and Technical
Committee members. The index uses the same method as in the past, namely, the min-max
method for the normalization of variables, and a statistical technique was used to address
(filter) the outliers, given the high degree of sensitivity of the min-max method to outliers.
The sub-category scores were calculated by averaging the scores of all the component
indicators. Category scores were calculated by averaging the scores of the sub-categories,
and finally, the overall index scores were obtained by simply averaging the scores of the
four categories.
Savitri Abeyasekera (2004) discusses situations where the data determine the form of the
index by use of a multivariate procedure. This still retains the common interpretation of an
index as being a single value that captures the information from several variables into one
composite measure, typically taking the form:
,2211 pp XaXaXaIndex
where the ai's are weights to be determined from the data and the Xi‘s are an appropriate
subset of p variables measured in the survey. It illustrates two ways in which the weights ai
can be determined from the data. One of them is based on a regression modeling approach
and the other on an application of principal component analysis (PCA). The paper
concluded that the application of these methods however requires careful thought, with due
attention to their meaning and their limitations. The success of principal component analysis
for variable reduction for example, depends on being able to summarize a substantial
proportion of the variation in the data by just a few component indices, and being able to
give a meaningful interpretation to each of these. It is also important to think carefully about
the effectiveness of the PCA procedure if only a small part of the variation in the complete
set of variables is accounted for by the first principal component. Sufficient attention should
also be given to the appropriateness of the variables included in the calculation of the index
in relation to the objectives of the analysis.
Sudip, R. B. (2008), introduced a study on a new way to link development to institutions,
policies and geography. To that end, the study attempts to construct a Development Quality
Index (DQI) and an Institutional Quality Index (IQI) using multivariate statistical method of
20. 6
principal components. It shows that (i) higher level of IQI along with economic policy and
geography factors lead to a positive improvement in the level of DQI; and that (ii) results
remain rigorous for IQI and relatively rigorous for economic policy and geography even
when it is compared across cross-section and panel data estimation for a set of 102 countries
over 1980 to 2004. The results strongly indicate that institutions matter in the context of
specific economic policy mixes and geography-related factors illustrated by disease burden,
etc. For normalization, the maximum and minimum values of these indicators are taken
from the world sample. In the case of regional level analysis, the maximum and minimum
values are taken from countries own sample during the period under study. At the end they
succeeded to set the two indices with list of dimension and indicators included using the
methods mentioned, where the higher values of both indices indicate a higher level of
development and institutional quality, respectively, and the indices are comparable over
time and respective weights are obtained from the analysis of principal components.
The UNDP (2007) primer report on measuring human development is intended as a
reference tool that provides guidance on statistical principles for producing evidence-based
policy recommendations and quality human development reports (HDRs). It is aimed at
HDR teams, as well as other practitioners working together to achieve the Millennium
Development Goals (MDGs), human rights and broader human development objectives.
Chapters include: Statistical principles in human development analysis, Select dimensions
of measuring human development, Advocating for change with human development data.
Regarding the composite indices, Chapter one gives a check list for ensuring the quality of
constructing a composite index as follows: For constructing new composite indices, has a
theoretical model been set up? Is the objective of the composite index clear? Are the
constituent indicators well defined, relevant and accessible? Have the inter-relationships
between constituent indicators been analyzed? Has the weighting and aggregation scheme
been adequately explained? Have sensitivity and uncertainty analyses been conducted?
Have the components of the composite indicator been discussed and analyzed?.
Susan R., Sakiko, F. P., and Terra, L. R. (2008) propose a methodology for an index of
economic and social rights fulfillment that captures progressive realization of human rights
subject to maximum available resources. Two calculation methods are proposed: the ratio
21. 7
approach and the achievement possibilities frontier approach. Index Version 1 measures
ESR fulfillment as a ratio between the extent of rights enjoyment (x), and State resource
capacity (y). A country’s raw index score is determined by z = x/y. xi = enjoyment indicator
(e.g., primary school completion rate; 100 - malnutrition rate), y = ln (GDP per capita), zi =
index score. Achievement Possibility Frontier (APF) approach to measure ESR fulfillment.
The study first estimate an achievement possibility frontier for each ESR. This frontier
determines the maximum level of achievement possible in each ESR dimension (xmax) at a
given per capita income level, based on the highest level of the indicator historically
achieved by any country at that per capita GDP level. A country’s rights fulfillment score
(x*) in each ESR dimension is then determined as xji* = xji/xjimax (where j = L or H for Low
& Middle Income countries and High Income countries, respectively, and i refers to the
specific indicator of concern as defined in Version 1 of the index). This can be interpreted as
the proportion of the feasible level achieved. The paper identifies key conceptual and data
constraints. Recognizing the complex methodological challenges, the aim of this paper is
not to resolve all the difficulties, but rather to contribute to the process of building rigorous
approaches to human rights measurement. The proposed index thus has recognized
limitations, yet it is an important first step based on available data. The index updated on
2009 with values and rankings for a large number of countries.
Robert H. McGuckin, Ataman Ozyildirim, and Victor Zarnowitz (2002), A More Timely
and Useful Index of Leading Indicators. The U.S. leading index has long been used to
analyze and predict economic fluctuations; this study describes and tests a new procedure
for making the index more timely. The index significantly outperforms its less timely
counterpart and offers substantial gains in real-time out-of-sample forecasts of changes in
aggregate economic activity and industrial production. The procedure for calculating the
U.S. Leading Index combines seven current financial and non-financial indicators with
simple forecasts of three other indicators that are only available with lags. The two basic
findings of the study are: (1) the leading indicators, properly selected and collected in an
index, convey significant predictive information about the economy’s change in the next
several months, beyond what can be learned from the economy’s recent past. (2) The index
is dramatically more accurate than the old index in forecasting growth of current conditions
22. 8
index (CCI) in the same impending target months. In addition, our results inspire confidence
because they make sense in the light of what is known from many past studies about some
tendencies common in short-term economic forecasts.
According to the literature review, different studies were mainly focusing on the theoretical
items than measuring issues. Also it is noticeable that the majority of national indices are
aggregated from a macro value not at micro level (Individuals or household level). When it
with regard to weights of different indicators or dimensions they are usually set to be equal
either for simplicity or for having no reason to set it unequal. Also when considering
measuring challenges, they are not considered adequately as a group to handle. The ESRFI
is avoiding all these limitations from literature and is introducing a comprehensive
composite indices process.
1.5. Organization of the Study
After the introduction, this study is divided into 5 Chapters where:
Chapter Two "Composite Indices and Challenges": this handles the steps for
constructing a composite index as well as different challenges in the construction of the
composite indices and the focus of the study.
Chapter Three "The Economic and Social Rights Fulfillment Index": specifies the
theoretical framework behind the Economic and Social Rights Fulfillment index with the list
of domains and indicators and the source of data.
Chapter Four "Methodologies to handle the problems of Composite Indices": focuses
on highlighting the measurement issues of the index especially the ones concerned with;
Missing Data, Outliers, Scale of Measurement, Weighting and Aggregation and Computing
the Margin of Error.
Chapter Five "Results of Calculating the ESRF index for Egypt": presents the main
findings of measuring the Economic and Social Rights Fulfillment index.
Chapter Six "Conclusions and Recommendations": summarizes the main findings of the
study in addition to the recommendations.
23. 9
Chapter Two
Composite Indices and Challenges
In the recent days, many studies depend on constructing composite indices to measure
different phenomena and give a direct message about the situation with one aggregated
value. This value can be tracked in different times to check for the trend.
Additionally, the comparisons across different disaggregation levels can be made using the
value of the index to indicate inequalities or gaps. Researchers working on different studies
are not necessarily statisticians and sometimes they do not realize the statistical techniques
they are using and the characteristics of it that may affect the aggregated value at the end
and lead to misleading decisions.
This study is trying to give a model for the way of constructing a composite index and the
main problems that may face researchers especially the ones using households’ survey data.
Although the importance of constructing composite indices, there are many problems and
challenges that need to decide on for each step of the process of constructing the composite
index. In each step of the construction process there are uncertainty item(s) and accordingly
all the steps together makes the process includes large items of uncertainty that should be
taken carefully and the decisions made for a certain problem should be tested and justified.
2.1. Steps for Constructing a Composite Index
The literature shows that there are some steps for constructing a composite index. Table 2.1
shows these steps and the importance of each step (See, for more details, Organization for
Economic Co-Operation and Development (2008), “Handbook on Constructing Composite
Indicators: Methodology and User Guide”).
But as the issue of composite indices is wide and has many tools and applications, the space
is open to add to these steps or even do not use one of them if not applicable to the
phenomenon that is measured. In general those steps shown in Table 2.1 are important to be
followed and applied for a composite index to be more rigorous and scientific.
24. 10
Table 2.1: Steps for constructing a composite index
Step Why it is needed?
1. Theoretical framework: Provides the
basis for the selection and combination of
variables into a meaningful composite
indicator under a fitness-for-purpose
principle (involvement of experts and
stakeholders is envisaged at this step).
To get a clear understanding and definition of
the multidimensional phenomenon to be
measured.
To structure the various sub-groups of the
phenomenon (if needed).
To compile a list of selection criteria for the
underlying variables, e.g., input, output,
process.
2. Data selection: Should be based on the
analytical soundness, measurability,
country coverage, and relevance of the
indicators to the phenomenon being
measured and relationship to each other.
The use of proxy variables should be
considered when data are scarce.
To check the quality of the available
indicators.
To discuss the strengths and weaknesses of
each selected indicator.
To create a summary table on data
characteristics, e.g., availability (across
country, time), source, type.
3. Imputation of missing data: Is needed
in order to provide a complete dataset.
To give a measure for each case in the
analysis at the final aggregated index.
To provide a measure of the reliability of each
imputed value, so as to assess the impact of
the imputation on the composite indicator
results.
4. Multivariate analysis: Should be used
in studying the overall structure of the
dataset, assess its suitability, and guide
subsequent methodological choices (e.g.,
checking for reliability of the tool (index)
that is constructed theoretically).
To check the underlying structure of the data
and its reliability to the constructed index.
To compare the statistically determined
structure of the data set to the theoretical
framework and discuss possible differences.
26. 12
Those steps are important to be followed in order to get a rigorous index where the effects of
uncertainty are mitigated. The steps mentioned in Table 2.1 are not rigid and the door is open
for adding more steps if required, but those steps are in general relevant to the majority of
composite indices. Statistical tools in each step vary and open also for adding new tools or
methodologies as the usage of the statistical tools will appear in the analysis step when facing
a certain problem and start searching for the relevant statistical technique.
2.2. Challenges in the Construction of the Composite Index
The construction and calculations of composite indices have many different statistical
challenges. Some of these challenges are related to the measured phenomenon (which is the
fulfillment of economic and social rights in this study), for example:
The majority of phenomena measured by composite indices are complicated in their
nature.
Indices have many different dimensions.
Data limitations as sometimes researchers will need to have all the indicators and
dimensions available in the same dataset while the national surveys may have no data
on some of the dimensions or indicators.
These challenges are crosscutting and reflected mainly in the measurement steps and
challenges. This study focuses on making a diagnostic for a set of limitations – linked mainly
to the measurement steps - that faces the construction and computations of such a composite
index in addition to dealing with them by suitable tools, these limitations or challenges are:
1) Indicators selection, indicators should be selected based on basis like:
a) Soundness,
b) Measurability,
c) Coverage,
d) Relevance to the phenomenon being measured
e) The relationship to each other.
27. 13
This will highly depend on the theoretical framework and the definition of dimensions
followed by data availability and country relevance.
2) Imputation of missing data and dealing with not applicable cases in survey data,
imputation of missing data for certain indicator in general or within certain area and
how to deal with this is a debatable issue. Another issue is that social household
surveys include skips that take us into non applicable questions for a group of cases,
those non applicable needs a relevant codes to be used for them in order to be able to
have a value for them in the dimension and accordingly on the index at the end. A
direct example on missing data from households surveys is when the household
refuses to answer questions about income or expenditures. If the researchers need to
have a complete variable about this, they will have to impute these missing values.
Example for non-applicable cases: consider a set of three questions about a certain good's
consumption by the household as follows:
i. If the household consume this good or not?
ii. If the household sees that the price of this good is increased or not?
iii. If the price increase affected the amount of consumption of this good?
And the researcher is concerned with the third question. All households who do not
consume that good or do not see that the prices increased will be skipped in the third
question and considered not applicable cases. To deal with this, the researcher may for
example give the skipped households a code of zero considering them not deprived from the
good (they are not interested in that good or they are not affected by the prices increase).
Subjective assumptions sometimes lie behind the selected codes.
3) The existence of univariate and multivariate outliers in the data can seriously
affect the values of such an index. Univariate outliers are when outliers are most
frequently sought for each single variable in a given data set. Multivariate outliers
are sought for and based on location and spread of the data. In the multivariate case
not only the distance of an observation from the centroid of the data but also the
shape of the data has to be considered (cases with an unusual combination of scores
28. 14
on different variables). The higher (lower) the analytical result of a sample, the
greater is the distance of the observation from the central location of all
observations; outliers thus, typically, have large distance.
Univariate and multivariate outliers should be detected and if they exist, then there are
methods to deal with for having more rigorous results.
4) Scale of measurement, components (sub-indices) and indicators of a composite index
are often measured in different units and so straightforward summation would not be
valid in all cases. The problem of scale of measurement is a challenge for composite
indices and needs to be justified and relevant when using a specific tool.
5) Weighting and aggregation, very often, the components (sub-indices) and indicators
are assigned equal weights to compute an average. Sometimes unequal weights are
assigned on the basis of prior knowledge or expert views. The weights and
aggregation should be based on a certain relevant methodology or concept depending
on what we are measuring (Linear, Geometric, and other types of aggregation).
6) Computing the margin of error of a composite index is also an issue of concern that
needs to be addressed because of uncertainty and to give accuracy to the estimated
values. This too is a challenging problem especially when it comes to ranking regions
according their sub-indices.
These six limitations/challenges are the most debatable ones in constructing composite
indices (how to detect and deal with them). Some of these challenges exist by nature of
constructing a composite index and some others depend on the data used in the analysis or
construction process. For example the weighting problem exists in all composite indices
because weights must be assigned for domains and indicators in the composite index and
even if equal weights are used a reason for selecting such equal weights should be
mentioned. During the process of constructing the Economic and Social Rights Fulfillment
index, the study will handle and focus on the above six limitations in the sense of how to
detect the problem and how to deal with.
29. 15
Chapter Three
The Economic and Social Rights Fulfillment Index
3.1 Introduction
As proposed by the Economic and Social rights empowerment initiative1
; countries are
bound under international law to respect, protect, and fulfill economic and social rights for
citizens. The dimensions of the ESRFI are the rights that are very well known and stated in
many human rights declarations and United Nations resources not only the constitution.
These are five main rights; right to education, right to health, right to adequate housing,
right to food and right to decent work. Chapter Three of the new Egyptian constitution
approved by referendum in 2012 is about Economic and social rights and state in Part two
that “Rights and Freedoms a list of articles that set obligations of the state to fulfil the
economic and social rights to all citizens” as in the following articles of the constitution:
Article 58 High-quality education is a right guaranteed by the State for every citizen. It is
free throughout its stages in all government institutions, obligatory in the primary stage, and
the State shall work to extend obligation to other stages,
Article 62 Healthcare is a right of every citizen, and the State shall allocate a sufficient
percentage of the national revenue. The State shall provide healthcare services and health
insurance in accordance with just and high standards, to be free of charge for those who are
unable to pay.
Article 63 Work is a right, duty and honor for every citizen, guaranteed by the State on the
basis of the principles of equality, justice and equal opportunities. There shall be no forced
labour except in accordance with law. Public sector employees shall work in the service of
the people. The State shall employ citizens on the basis of merit, without nepotism or
mediation. Any violation is a crime punishable by law.
1 The Economic and Social Rights Empowerment Initiative was initiated by Sakiko Fukuda-Parr and Terra
Lawson-Remer at the New School and Susan Randolph at the University of Connecticut at New York is being
undertaken collaboratively with the Social Science Research Council, and is supported in part by National
Science Foundation to all countries with special focus on developing countries.
30. 16
The State guarantees for every worker the right to fair pay, vacation, retirement and social
security, healthcare, protection against occupational hazards, and the application of
occupational safety conditions in the workplace, as prescribed by law.
Article 67 Adequate housing, clean water and healthy food are given rights. The state
adopts a national housing plan, its basis in social justice, the promotion of independent
initiatives and housing cooperatives, and the regulation of the use of national territory for
the purposes of construction, in accordance with public interest and with the rights of future
generations.
The ESRF Index and the human rights indicators are considered tools for assessing progress
in protecting human rights and for formulating human rights-based public policies and
programmes.
In this connection, a report was prepared by the United Nations Office of the High
Commissioner for Human Rights (OHCHR) (2008) on Indicators for Promoting and
Monitoring the Implementation of Human Rights. The Annex to the report provides a list of
illustrative indicators on different rights such as the right to education, the right to adequate
food, the right to participate in public affairs, the right to work, ……. etc.
In addition, there are several tools and guides that are done by UN agencies to introduce
several human rights indicators that can be used as a guide for different human rights tools.
Accordingly, the Economic and Social Rights Fulfillment Index is structured and
constructed.
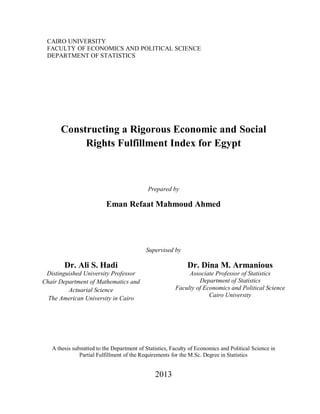
Figure 3.1 shows the structure of the index where it reflects that the index in general is
divided into five dimensions (Food, Health, Education, Adequate housing and Decent
work), each dimension measured by a set of indicators which contain variable(s) to measure
from the raw survey data.
31. 17
Figure 3.1: General structure of the ESRF index
Index Dimensions IndicatorsEconomicandSocialRightsFulfillmentIndex
Right to
Food
Individuals live in households decreased or stopped using main
goods because of the increase in food prices
Availability of bread by type that were needed by households
during the all days of the week
People living in poverty
Expenditure on food
Individuals live in households that are not using X good of the
main food goods
Right to
Education
Enrollment rate in primary education
Education completion
Drop out from basic education
Education Achievements
Right to
Health
Access to water with good quality
Individuals who have problems in health service in the place of
residence
Individuals who can found the essential Pharmaceuticals when
needed at a place near to their residency
Individuals who can found the essential Pharmaceuticals when
needed in adequate price
Individuals who have governmental health insurance
Individuals with disability
Right to
Adequate
Housing
Access to improved water source
Access to improved sanitation facility
Individuals live in a housing unit with adequate floor material
Individuals who have separate place for cooking (kitchen)
Individuals with sufficient living space
Ownership of main assets for adequate place
Access to safe fuel for cooking
Right to
Decent
Work
Individuals who are exposed to dangerous work
Work Stability
Time spent to travel from home to work
Weekly hours worked
Monthly earnings
Individuals who are employed and have legal contract with their
organization
Individuals employed in organizations that avail legal vacations
by type
Individuals who have trade union membership
Individuals who are satisfied by their work
Individuals who have social insurance through work
Individuals who have health insurance through work
Individuals working more than 50 hours per week and this affect
their health
Individuals working in organizational that avail insurance against
work related danger
32. 18
The five rights/dimensions of the index are defined in separate reports by international
institutions. These reports define these rights and how to measure where for a one right there
are number of reports published by the specific institution in that field to define it. The list
of reports is:
1. The Right to Adequate Housing published by UN HABITAT in 2009.
2. Decent Work Indicators for Asia and the Pacific: A Guidebook for Policy-makers
and Researchers published by International Labour Organization and Asian Decent
Work Decade in 2008.
3. Decent work: Concepts, models and indicators published by International Institute
for Labour Studies in 2002.
4. ILO Declaration on Social Justice for a Fair Globalization adopted by the
International Labour Conference at its Ninety-seventh Session, 2008.
5. ILO Manual First version, Decent Work Indicators Concepts and definitions,
published by ILO in 2012.
6. Facts on Decent Work published by ILO in 2006.
7. World Education report, the right to education: towards education for all throughout
life published by United Nations Educational, Scientific and Cultural Organization
UNESCO in 2000.
8. The Right to Adequate Food published by the Food and Agriculture Organization of
the United Nations FAO in 2010.
9. The Right to Health published by the World Health Organization (WHO) of the
United Nations WHO in 2008.
These reports guided the theoretical framework to identify the exact definition of each right
and what indicators that measures it.
33. 19
3.2 Definition of Domains
1. The right to food: the right to food is a human right recognized by international human
rights law. The Universal Declaration of Human Rights recognizes, in the context of an
adequate standard of living, that: “Everyone has the right to a standard of living adequate
for the health and well-being of himself and of his Household, including food” (article 25).
The food and agriculture organization (FAO) in its fact sheet number 34 about the right to
food stated that the right to food is recognized in the 1948 Universal Declaration of Human
Rights as part of the right to an adequate standard of living, and is enshrined in the 1966
International Covenant on Economic, Social and Cultural Rights. It is also protected by
regional treaties and national constitutions.
As authoritatively defined by the Committee on Economic, Social and Cultural Rights
ESCR (Committee on ESCR) in its General Comment 12: “the right to adequate food is
realized when every man, woman and child, alone and in community with others, has
physical and economic access at all times to adequate food or means for its procurement”
(General Comment 12, 1999, para 6).
Inspired by the above definition, the right to food entails: “the right to have regular,
permanent and unrestricted access, either directly or by means of financial purchases, to
quantitatively and qualitatively adequate and sufficient food corresponding to the cultural
traditions of the people to which the consumer belongs, and which ensures a physical and
mental, individual and collective, fulfilling and dignified life free of fear" as stated by the
Committee on Economic, Social and Cultural Rights
It is important to emphasize certain elements of the right to food that is food must be
available, accessible and adequate.
2. The right to education: the world education report of 2000 that is published by
UNESCO entitled "The right to education -Towards education for all throughout life"
defined the right to education and different tools to measure the fulfilment of it
especially as the number of years of school attendance as an important measure of
34. 20
education fulfilment and quality. The Right to Education in Article 26 of the Universal
Declaration of Human Rights stated that2
:
Everyone has the right to education. Education shall be free, at least in the
elementary and fundamental stages. Elementary education shall be compulsory.
Technical and professional education shall be made generally available and higher
education shall be equally accessible to all on the basis of merit.
Education shall be directed to the full development of the human personality and to
the strengthening of respect for human rights and fundamental freedoms. It shall
promote understanding, tolerance and friendship among all nations, racial or
religious groups, and shall further the activities of the United Nations for the
maintenance of peace.
Parents have a prior right to choose the kind of education that shall be given to their
children.
Education creates the “voice” through which rights can be claimed and protected’, and
without education people lack the capacity to ‘achieve valuable functioning as part of the
living. If people have access to education they can develop the skills, capacity and
confidence to secure other rights. Education gives people the ability to access information
detailing the range of rights that they hold, and government’s obligations. It supports people
to develop the communication skills to demand these rights, the confidence to speak in a
variety of forums, and the ability to negotiate with a wide range of government officials and
power holders.
Accordingly the right to education includes; basic education, secondary levels, and higher
levels of education as basic education does not accord an individual with the minimum level
of capacity and knowledge necessary to participate meaningfully in contemporary society.
Moreover, the quality of education is as important as the number of years of school
attendance. The right to education international project gives over 200 indicators to measure
the fulfilment of the right to education in details.
2 Source: Universal Declaration of Human Rights Adopted and Proclaimed by the General Assembly of the United Nations
on the Tenth Day of December 1948, Final Authorized Text. New York, United Nations, 1950.
35. 21
3. The right to health is a broad concept that can be broken down into more specific
entitlements such as the rights to: maternal, child and reproductive health; healthy
workplace and natural environments; the prevention, treatment and control of diseases,
including access to essential medicines; access to safe and potable water (quality). It is
known also as the economic, social and cultural right to the highest attainable standard
of health. It is recognized in the Universal Declaration of Human Rights and
International Covenant on Economic, Social and Cultural Rights. The 1948 Universal
Declaration of Human Rights also mentioned health as part of the right to an adequate
standard of living (Article 25). The right to health was again recognized as a human
right in the 1966 International Covenant on Economic, Social and Cultural Rights.
The right to health is an inclusive right. It includes a wide range of factors that can help us
lead a healthy life. The Committee on Economic, Social and Cultural Rights, the body
responsible for monitoring the International Covenant on Economic, Social and Cultural
Rights, calls these the “underlying determinants of health”. They include:
Safe drinking water and adequate sanitation;
Safe food;
Adequate nutrition and housing;
Healthy working and environmental conditions;
Health-related education and information;
Gender equality.
The right to health contains entitlements. These entitlements include:
The right to a system of health protection providing equality of opportunity for
everyone to enjoy the highest attainable level of health;
The right to prevention, treatment and control of diseases;
Access to essential medicines;
Maternal, child and reproductive health;
Equal and timely access to basic health services;
36. 22
The provision of health-related education and information;
Participation of the population in health-related decision making at the national and
community levels.
4. The right to Adequate Housing refers to adequate access, quality in the form of
provision of water and sanitation, and security of housing units (UN-Habitat and
OHCHR 2003). According to the Human Rights Resource Center and the United
Nations Agency for Human Settlements UNHABITAT the adequacy of housing
includes:
Availability of services, materials, facilities and infrastructure. An adequate
house must contain certain facilities essential for health, security, comfort and
nutrition. All beneficiaries of the right to adequate housing should have
sustainable access to natural and common resources, safe drinking water, energy
for cooking, heating and lighting, sanitation and washing facilities, means of
food storage, refuse disposal, site drainage and emergency services;
Affordability. Personal or household financial costs associated with housing
should be at such a level that the attainment and satisfaction of other basic needs
are not threatened or compromised. Steps should be taken by States parties to
ensure that the percentage of housing-related costs is, in general, commensurate
with income levels.
Habitability. Adequate housing must be habitable, in terms of providing the
inhabitants with adequate space and protecting them from cold, damp, heat, rain,
wind or other threats to health, structural hazards, and diseases. The physical
safety of occupants must be guaranteed as well.
Accessibility. Adequate housing must be accessible to those entitled to it.
Disadvantaged groups must be accorded full and sustainable access to adequate
housing resources. Both housing law and policy should take fully into account
the special housing needs of these groups. Within many States parties increasing
37. 23
access to land by landless or impoverished segments of the society should
constitute a central policy goal. Discernible governmental obligations need to be
developed aiming to substantiate the right of all to a secure place to live in peace
and dignity, including access to land as an entitlement.
A number of indicators were defined by different organizations to enable measuring the
extent of fulfilment of the right to adequate housing.
5. The right to decent work: refers to both access and conditions of work. The Decent
Work concept was formulated by the International Labour Organization ILO’s
constituents – governments and employers and workers – as a means to identify the
Organization’s major priorities.
It is based on the understanding that work is a source of personal dignity, Household
stability, peace in the community, democracies that deliver for people, and economic
growth that expands opportunities for productive jobs and enterprise development.
Decent Work reflects priorities on the social, economic and political agenda of countries
and the international system. In a relatively short time this concept gave an international
consensus among governments, employers, workers and civil society that productive
employment and Decent Work are key elements to achieving a fair globalization, reducing
poverty and achieving equitable, inclusive, and sustainable development.
Juan Somavia, ILO Director-General stated in the ILO Declaration on Social Justice for a
Fair Globalization that "The primary goal of the ILO today is to promote opportunities for
women and men to obtain decent and productive work, in conditions of freedom, equity,
security and human dignity." Monitoring progress towards decent work is a long-standing
concern for the ILO’s constituents.
The ILO Framework Work Indicators covers ten substantive elements corresponding to the
four strategic pillars of the Decent Work Agenda (full and productive employment, rights at
work, social protection and the promotion of social dialogue). These include the following:
1. Employment opportunities
2. Adequate earnings and productive work
38. 24
3. Decent working time
4. Combining work, Household and personal life
5. Work that should be abolished
6. Stability and security of work
7. Equal opportunity and treatment in employment
8. Safe work environment
9. Social security
10. Social dialogue, employers’ and workers’ representation
The decent work indicators are formulated in light of these areas.
3.3 Indicators Selection
Indicators selection is a very critical step, and includes uncertainty about why selecting this
specific list rather than another one in addition to that the domains specification prior to the
indicators selection is also critical if not justified. In the case of ESRF the domains were
selected according to the definition of United Nations Human Rights institutions that
defined the economic and social rights in the five main rights as well as the International
Covenant on Economic, Social and Cultural Rights. Within each dimension the indicators
list defined and selected according to:
1. Dimension definitions.
2. Data availability and reliability.
3. Being available at the individual level because the unit of analysis in the ESRF is
individual.
4. Policy responsiveness, in the sense that the indicators are related to the policy tools,
legislations and obligations.
5. Relevance to Egyptian environment.
39. 25
Few number of the selected indicators are removed during the analysis because of various
reasons, these reasons include:
1. Zero variance that will affect the multivariate analysis and will not differentiate
among individuals. For example, in the right to adequate housing the indicator of
having electricity was removed as in Egypt there are around 99% or more having
electricity.
2. Very few applicable cases in a specific indicator that will make the sample size for a
specific question in the data very small. For example, in the right to food there were
question about the individuals attitudes towards increasing in the subsidized bread
prices, the valid cases to answer the question were very few (0.8%) of the total
sample who are experienced prices increasing in the subsidized bread .
The final list of indicators has 35 indicators (71 variables) measuring the ESRFI in the 5
main dimensions.
During the analysis, it was very important to do reliability analysis to these indicators per
dimension to check for the internal consistency, reliability and importance of each set of
indicators to constitute a certain dimension and the overall ESRF index,
Cronbach's (alpha) coefficient has been used where Cronbach's is defined as:
(
∑
)
Where K is the number of components (K-items), is the variance of the observed total
test scores, and the variance of component i for the current sample of persons.
The standardized α is also used which is based on the assumption that all of the items have
equal variances.
40. 26
3.4 List of Domains and Indicators in the ESRF Index
The list of domains and indicators in the ESRF index are shown in Table 3.1. A list of
indicators is developed to cover the illustrated domains (Rights) with the resource reference of each
indicator as well as the variables measures these indicators in the household survey.
Table 3.1: List of Domains, Indicators and Variables of the ESRF index
Domain/ Right
(Number of
indicators between
parentheses)
Indicators3
(Number of variables
between parentheses)
Variables Reference(s)
Right to Food (5
Indicators)
Individuals live in
households decreased or
stopped using main
goods because of the
increase in food prices (
14 Variables)
What did you do when the price
of rice has increased?
Proxy for UN
concept on
usage of
main goods
What did you do when the price
of wheat / flour increased?
What did you do when the price
of pasta increased?
What did you do when the price
of meat (beef - mutton)
increased?
What did you do when the price
of poultry (chicken - duck - ..)
increased?
What did you do when the price
of fish increased?
What did you do when the price
of milk and cheese increased?
What did you do when the price
of eggs has increased?
What did you do when the price
of oil increased food?
What did you do when the price
of margarine and butter
increased?
What did you do when the price
of fruit (orange - Banana -
Guava ..) increased?
What did you do when the price
of vegetables (spinach - tomato -
..) increased?
What did you do when the price
of legumes (beans - Lentils -
Beans - ..) increased?
3
See for more details about indicators, Annex 1 about indicators Meta Data.
41. 27
Domain/ Right
(Number of
indicators between
parentheses)
Indicators3
(Number of variables
between parentheses)
Variables Reference(s)
What did you do when the price
of sugar has increased?
Availability of bread by
type that were needed by
households during the all
days of the week (1
variable)
Did you find the bread when
needed?
Proxy for UN
concept on
usage of
main goods
People living in poverty
(1 variable)
Expenditure quintiles variable is
used as proxy variable to
differentiate between different
economic levels.
UN/ FAO/
MDGs
Expenditure on food (1
variable)
Percentage share of the
expenditure on food from the
total expenditure.
UN concept
Individuals live in
households that are not
using X good of the main
food goods (14 variables)
Household consumption on rice
in the last 3 months : decreased,
as it is, increased, not used
UN concept
Household consumption on
wheat / flour in the last 3
months : decreased, as it is,
increased, not used
Household consumption on
pasta in the last 3 months :
decreased, as it is, increased, not
used
Household consumption on
meat (beef - mutton) in the last
3 months : decreased, as it is,
increased, not used
Household consumption on
birds (chicken - duck - ..) in the
last 3 months : decreased, as it
is, increased, not used
Household consumption on fish
in the last 3 months : decreased,
as it is, increased, not used
Household consumption on milk
and cheese in the last 3 months :
decreased, as it is, increased, not
used
Household consumption on eggs
in the last 3 months : decreased,
as it is, increased, not used
Household consumption on food
oil in the last 3 months :
decreased, as it is, increased, not
42. 28
Domain/ Right
(Number of
indicators between
parentheses)
Indicators3
(Number of variables
between parentheses)
Variables Reference(s)
used
Household consumption on
margarine and butter in the last
3 months : decreased, as it is,
increased, not used
Household consumption on fruit
(orange - Banana - Guava ..) in
the last 3 months : decreased, as
it is, increased, not used
Household consumption on
vegetables (spinach - tomato -
choice.) in the last 3 months :
decreased, as it is, increased, not
used
Household consumption on
legumes (beans - Lentils - Beans
- .) in the last 3 months :
decreased, as it is, increased, not
used
Household consumption on
sugar in the last 3 months :
decreased, as it is, increased, not
used
Right to Education
(4 Indicators)
Enrollment rate in
primary education
There was a challenge in
evaluating the education
variables because of non-
applicability and limitations on
some questions. Away to
overcome this is by creating a
variable in the data reflects the
individual actual years of
schooling compared to the
optimal years of schooling
according to his/ her age.
UN/ MDGs/
UNESCO
Education completion UN/ MDGs/
UNESCO
Drop out from basic
education
UN/ MDGs/
UNESCO
Education Achievements UN/
UNESCO/
Right to Health (6
Indicators)
Access to water with
good quality (2 variables)
What are the problems related to
drinking water? (Low quality)
UN/ WHO
What are the problems related to
drinking water? (Water
pollution)
Individuals who have
problems in health
service in the place of
residence (1 variable)
The problems in your area?
Problems of health services
UN
43. 29
Domain/ Right
(Number of
indicators between
parentheses)
Indicators3
(Number of variables
between parentheses)
Variables Reference(s)
Individuals who can
found the essential
Pharmaceuticals when
needed at a place near to
their residency
(Pharmacy, health
unit,….etc). (1 variable)
Are the medicines you usually
need always available in a
nearby pharmacies?
UN/ WHO
Individuals who can
found the essential
Pharmaceuticals when
needed in adequate price
(1 variable)
Did you get Medicines that is
necessary needed by your
Household members?
UN/ WHO
Individuals who have
governmental health
insurance (1 variable)
Do you have a government
health insurance?
UN/ WHO
Individuals with
disability (1 variable)
Is the individual having any
disability?
UN
Right to Adequate
Housing (7
Indicators)
Access to improved
water source (1 variable)
the main source of drinking
water
OHCHR/ UN
HABITAT
Access to improved
sanitation facility (1
variable)
Sanitation type OHCHR/ UN
HABITAT
Individuals live in a
housing unit with
adequate floor material
(1 variable)
Basic material for the floor OHCHR/ UN
HABITAT
Individuals who have
separate place for
cooking (kitchen) (1
variable)
Do you have a kitchen or
cooking in a separate room
place?
OHCHR/ UN
HABITAT
Individuals with
sufficient living space
(Average number of
persons per room/
adequate space) (2
variables)
Number of rooms OHCHR/ UN
HABITAT
Number of household members
Ownership of main assets
for adequate place (living
conditions) (8 variables)
Color TV OHCHR/ UN
HABITATAn air conditioner
Electric Heater
Stove
Refrigerator
Water Heater Bath
Washing Machine
Vacuum cleaner
44. 30
Domain/ Right
(Number of
indicators between
parentheses)
Indicators3
(Number of variables
between parentheses)
Variables Reference(s)
Access to safe fuel for
cooking (1 variable)
Type of fuel your Household
use in cooking? If it is it
separate or joint?
OHCHR/ UN
HABITAT
Right to Decent
Work (13
Indicators)
Individuals who are
exposed to dangerous
work (1 variable)
Do you work related with using
sharp instruments or materials,
flammable or has dangerous on
you?
ILO
Work Stability (1
variable)
What is the type of your work? ILO/ MDGs
Time spent to travel from
home to work (1
variable)
The average time you take from
your home to reach your job (the
trip in one direction)?
ILO
Weekly hours worked (1
variable)
How many hours of your work
per week on average?
ILO
Monthly earnings (1
variable)
What is your monthly salary? ILO
Individuals who are
employed and have legal
contract with their
organization (1 variable)
Do you have a written legal
contract or formal appointment
with your employer?
ILO
Individuals employed in
organizations that avail
legal vacations by type (5
variables)
Is the organization you are
working in avail sick leaves?
ILO
Is the organization you are
working in avail unusual
holidays?
Is the organization you are
working in avail casual leaves?
Is the organization you are
working in avail maternity leave
(for females)?
Is the organization you are
working in avail care of a child
leaves (female)?
Individuals who have
trade union membership
(1 variable)
Are you a member of syndicate? ILO
Individuals who are
satisfied by their work (1
variable)
Are you satisfied with the nature
of work in organization you are
working in?
ILO
Individuals who have
social insurance through
work (1 variable)
Is your job made a social
insurance (pension) for you?
ILO
45. 31
Domain/ Right
(Number of
indicators between
parentheses)
Indicators3
(Number of variables
between parentheses)
Variables Reference(s)
Individuals who have
health insurance through
work (1 variable)
Is your job made a health
insurance for you?
ILO
Individuals working
more than 50 hours4
per
week and this affect their
health (1 variable)
Does this have negative impact
on your health?
ILO
Individuals working in
organizational that avail
insurance against work
related danger (1
variable)
Do your organization an
insurance against work related
danger?
ILO
3.5 Source of Data
The data used for constructing the ESRF index is the "Egyptian Household Conditions
Observatory Survey" that was conducted by the Information and Decision Support Centre in
2010 as this is the household national survey that has different data on the desired indicators
and will enable for calculating the index for all individuals. Egyptian Families Conditions
Observatory aims at availing continuous measurement of the status of the Egyptian
Household by discussing issues of interest either for the decision maker or citizens such as
identifying citizens reactions towards increasing prices of goods and services and the effects
of that on the consumption patterns of the Egyptian Household, identifying the
characteristics of employed and unemployed people,…etc.
This survey is implemented regularly every three months, and the latest cycle has been
published the by Information and Decision Support Center in September 2010. The sample
was a random sample of households in Egypt and consists of 10550 households, distributed
at all governorates except for frontier governorates (Al-Wadi Al-Gadid , Marsa Matrouh,
Red Sea, North Sinai and South Sinai Governorate) according to number of households in
each governorate and sample weights is assigned to the datasets to handle the distribution
and the non-response rate. Households in the sample within each governorate are
4
Despite the legal hours per week is 40, but in the Egyptian context they asked only if increased
than 50 not 40.
46. 32
represented at the rural and urban "proportional representation to size", where the sample
frame used is from the census of 2006 as validated in 2008, the sample was distributed to
451 cadastral area distributed over 236 primary sampling unit and the average number of
households in each primary sampling unit were about 25 families to minimize the sampling
error. After selecting the sample a one third of households are randomly selected in each
cadastral area to be a sub-sample for the Working module of the survey. This round of the
survey has 4 main questionnaires, the general questionnaire, a module on work conditions, a
module on maternal health and a module on watching TV programmes in Ramadan.
Table 3.2: Sample distribution according to governorates in Egypt
Governorates Frequency Percent
Cairo 1103 10.5
Alexandria 660 6.3
Port Said 87 .8
Suez 76 .7
Helwan 254 2.4
6 October 383 3.6
Dametta 177 1.7
Al Dakahlia 782 7.4
Al Sharkia 783 7.4
Al Kaliubia 647 6.1
Kafr Al Sheikh 381 3.6
Al Gharbia 615 5.8
Al Menofia 477 4.5
Al Behera 679 6.4
Al Ismailia 142 1.3
Giza 496 4.7
Bani Suef 308 2.9
Al Fayoum 351 3.3
Menia 566 5.4
Assiut 453 4.3
Sohag 508 4.8
Qena 325 3.1
Aswan 167 1.6
Luxor 129 1.2
Total 10550 100.0
Table 3.3: Sample distribution according to Urban and Rural Areas in Egypt
Frequency Percent
Urban 4752 45.0
Rural 5798 55.0
Total 10550 100.0
47. 33
3.6 Results of using Cronbach's α5
on the dimensions of the index
Right to food
Table 3.4: Reliability Statistics for the right to food
Cronbach's Alpha Cronbach's Alpha Based on
Standardized Items
N of Items
.703 .641 31
The α index is considered high (high internal consistency) and it is a good indication for the
right to food dimension. The Cronbach's Alpha is 0.703 and the Cronbach's Alpha Based on
Standardized Items is 0.641 which is also high level of reliability and internal consistency
that support the measurement tool for this right.
Right to health
The α in right to health is not as higher as other dimensions; this may be because the
right to health is a difficult dimension to capture all what measure it from one data set
(like variables related to diseases and specific questions on pharmaceutical access).
Table 3.5: Reliability Statistics for the right to health
Cronbach's Alpha Cronbach's Alpha Based
on Standardized Items
N of Items
.233 .269 7
Even for the α if item deleted to check if there are number of variables that lower the
scale, there were not ones. The list used as the data availability (these 7 items are all
items in that survey as well as majority of other national surveys that measures health
conditions).
Right to adequate housing
The α index for the right to adequate housing dimension is considered high (high
internal consistency) and it is a good indication.
5
The software used for calculating Cronbach's Alpha coefficient is SPSS package.
48. 34
Table 3.6: Reliability Statistics for the right to adequate housing
Cronbach's Alpha Cronbach's Alpha Based on
Standardized Items
N of Items
.616 .716 14
Right to Decent Work
The alpha for the right to decent work is the highest among other dimensions and it is
very good (showing excellent internal consistency).
Table 3.7: Reliability Statistics for the right to decent work
Cronbach's Alpha Cronbach's Alpha Based on
Standardized Items
N of Items
.908 .882 17
The right to education is a special case as the variables of it were summarized to constitute
one variable that captures the meaning in all education variables and gives valid score for all
individuals and that is why there is no reliability coefficient measured for it. The list of
variables about education in the survey is 6 variables. Those variables are not applicable or
valid for all individuals; they are valid for different groups of individuals depending on their
age. To solve this and to have one education variable that is valid for all individuals in the
index, the study applied the following steps:
A. Created new variable that tells what is the years of education that the individual
should achieve depending on his/ her age.
B. Created another variable about the actual years of schooling that individuals on the
data already achieved.
C. By subtracting variable in point 1 from the variable in point 2 a new variable is
created. This new variable reflects the education achievements taking into
consideration age, dropout and all other conditions that might affect the education
fulfillment.
In general the indicators show a good internal consistency and give indication that the
identification and selection of the list working very well in measuring the ESRFI.
49. 35
Chapter Four
Methodologies to handle the problems of Composite Indices
As mentioned in previous Chapters, there are many steps in constructing composite indices
and each step includes many statistical procedures and an uncertainty about the selection
between certain methodologies within each step. This chapter addresses the methodology in
five main debatable issues in the construction and measuring of composite indices in general
with application on the ESRF index (missing and not applicable data, outliers, scale of
measurement, weighting and aggregation and computing the margin of error).
4.1. Missing Data
Missing data are data desired to be collect but for different reasons are not available and
missed from the survey or data. Missing data often hinder the development of rigorous
composite indicators. Data can be missing in a random or non-random fashion. Missing
completely at random (MCAR) means that the missing values do not depend on the variable
of interest or on any other observed variable in the data set. Missing at random (MAR)
means that the missing values do not depend on the variable of interest, but are conditional
on other variables in the data set. Not missing at random (NMAR) indicates that missing
values depend on the values themselves.
It is important to know why the data are missing; this can help with finding a solution to the
problem. If the values are missing at random there is still information about each variable in
each unit but if the values are missing systematically the problem is more severe because the
sample cannot be a good representation of the population. NMAR are very rare, most of the
methods that impute missing values require a missing at random mechanism, i.e. MCAR or
MAR. Depending upon the situation, missing data may be dealt with in a variety of ways. There are
three general methods for dealing with missing data:
1. Case deletion
2. Single imputation
3. Multiple imputations.
50. 36
Case deletion simply omits the missing records from the analysis. However, this approach
ignores possible systematic differences between complete and incomplete samples and
produces unbiased estimates only if deleted records are a random sub-sample of the original
sample (MCAR assumption). Furthermore, standard errors will generally be larger in a
reduced sample, given that less information is used. As a rule of thumb, if a variable has
more than 5% missing values, cases should not be deleted.
The other two approaches consider the missing data as part of the analysis and try to impute
values through either single imputation, e.g. mean/median/mode substitution, regression
imputation, hot-and cold-deck imputation, expectation-maximization imputation, or multiple
imputations, e.g. Markov Chain Monte Carlo algorithm which is the most familiar method.
The overall approach for imputation is to decide on what is the preferable approach for
different data scenarios prior to analyzing any data. Then, reviewing collected data and,
based on that, choosing the preferable approach. The decision is made depending on the size
of missing values, the type of variable, the existence of outliers and purpose of imputation.
Another type for non-completeness of data which exists widely in household surveys is the
not applicable cases which are a result of questions skips in different questions.
The data used in the ESRF index includes two types of problems:
A. Not applicable
B. Missing values
The method of dealing with each type differs as the not applicable needs to be coded with a
relevant code per question. The study dealt with these two types separately as follows:
A. Not applicable cases
The analysis shows that among the 71 variables used in constructing the ESRF index, there
are 36 variables have cases that are either not applicable or missing. The variables that
include not applicable are 20 variables. For each variable the most important item used to
decide how to recode the not applicable into valid values was the reason for that specific
non response.