Triple zigzag correction is a combination of three "abc" zigzag patterns connected by a linking wave "x". It forms a wedge pattern that can be either expanding or contracting. The individual zigzag patterns and linking waves can take different forms. A breakout from a triple zigzag pattern typically leads to an aggressive move in that direction, with the price rarely re-entering the wedge shape. Identifying a triple zigzag early allows one to anticipate large profitable moves with small risk from stops outside the pattern.
The document provides an introduction and overview of Elliott Wave Theory and various Elliott Wave patterns. It discusses the key concepts of impulse and corrective waves, and how waves can be subdivided into smaller degree waves that maintain the same pattern. It then examines several specific Elliott Wave patterns including impulse, extension, diagonal triangle, zigzag, flat, triangle, combination patterns, and others. It provides visual examples and definitions of the patterns, where they occur, and their internal structure. The document is intended to accurately cover Elliott Wave Theory patterns and concepts.
Elliott Wave Theory was developed by R.N. Elliott and popularized by
Robert Prechter. This theory asserts that crowd behavior ebbs and flows
in clear trends. Based on this ebb and flow, Elliott identified a certain
structure to price movements in the financial markets. The article serves
as a basic introduction to Elliott Wave Theory. A basic 5-wave impulse
sequence and 3-wave corrective sequence are explained. While Elliott
Wave Theory gets much more complicated than this 5-3 combination,
this article will only focus on the very basics.
Click here for more information on range trading
http://www.netpicks.com/simple-range-trading-strategy/
Here is some information on range trading:
It’s been said that a market only trends 30% of the time.
I can’t quantify that figure but having a range trading strategy to take advantage of the other 70% is good business.
Range trading is not difficult however it does require discipline and a method of determining when a trading range is in play.
For more information on range trading click here:
http://www.netpicks.com/simple-range-trading-strategy/
Visual guide to elliott wave trading ( pdf drive )wijitha gayan
The chapter discusses the anatomy of Elliott wave trading. It explains that analysis and trading require different skills, with analysis being a mastery of observation and trading a mastery of self. The chapter outlines how the Wave Principle improves upon traditional technical indicators by providing insight into the maturity of trends and identifiable price targets. It also describes how the Wave Principle identifies the trend, countertrend moves, trend maturity, price targets, and invalidation points. Overall, the chapter establishes that the Wave Principle provides a framework for traders to develop their own successful approach.
http://www.thechartist.com.au/membership-packages/chart-research.html
Elliot wave rules and guidelines to help us determine high-probability patter position of a market
This document discusses the importance of risk management in trading and investing. It outlines the basic principles of risk management, including having a defined trading strategy with entry, stop loss, and profit taking levels. It emphasizes limiting risks on individual trades to 2-5% of capital and maintaining a reward to risk ratio of at least 1:2. The document also provides examples of how risk management differs between beginner, intermediate, and professional traders.
This is my TRT-POV on Module 9 - Elliott Waves and Cycles of Time. I tried to simplify the Elliott Wave Theory as best as I could so that newbies will be able to understand the theory and the principles behind it. I also covered the 3 Cardinal Rules in using the Elliott Wave Theory for trading decision making.
This document provides copyright information and terms of use for the Andrews trading course materials. It states that no part of the materials may be reproduced without permission from the publisher and author. The author's contact information and a table of contents are also included. An introduction to the first book in the Andrews Babson trading series is given, outlining some of the concepts and rules that will be covered, including the Andrews lines, setup patterns, and trading rules.
The Elliott Wave theory is based on how groups of people behave. Mass psychology with swings from pessimism to optimism and back is described as the basis for the patterns the Elliott wave is suppose to identify.
El documento describe seis patrones típicos de estructuras diarias en el mercado de valores. Estos patrones incluyen días normales, días de variación normal, días de tendencia y días de doble distribución de tendencia. Cada patrón se caracteriza por el tamaño del balance inicial, la convicción direccional y el nivel de participación de los operadores a largo plazo. Reconocer estos patrones puede ayudar a los traders a predecir la dirección del mercado.
http://www.marketgeeks.com/breakout-trading-strategies/ Download Your Free Short Term Trading Report. Breakout trading strategies are important tools for traders. Learn how to avoid false breakouts and increase your odds of winning.
This document provides an overview of price action trading. It defines price action trading as basing trading decisions solely on price movements and patterns, without using indicators. Price action traders believe the only true information comes from price itself. Common price action strategies include breakouts, where the price breaks out of a range or pattern. Benefits are that strategies are simple and entries/exits are often favorable compared to lagging indicators. Drawbacks include difficulty automating and not knowing if an upward moving price will continue rising.
This document provides an overview of high probability trading setups for the currency market. It discusses the top 10 trading rules developed by the authors from years of observing currency price action. These rules are meant to keep traders grounded and out of harm's way. The document then outlines several high probability trading setups and strategies for both trending and counter-trend environments in the currency market.
Curso rápido de velas japonesas patrones gráficosPullback.es
En el presente documento que nos han remitido un lector de Pullback Trading, vamos a exponer de una forma bastante simplificada pero efectiva, los diferentes patrones gráficos realizados por las pautas de las velas japonesas en los mercados financieros.
Como sabemos, el análisis de las velas japonesas es tenido en cuenta por miles de inversores y analistas que acuden al mercado cada día con el fin de determinar la mejor estrategia de inversión a través del estudio de los gráficos de los mercados.
A través del análisis de gráficos de las velas japonesas de un activo financiero, se pueden delimitar zonas vitales que servirán para entender la volatilidad o la acción del precio en un momento dado y poder adaptar nuestras estrategias de compra y venta de acciones de bolsa, pares de divisas en Forex, opciones, o futuros financieros.
Además del estudio de los patrones gráficos de las velas japonesas, se pueden adaptar indicadores técnicos de trading con el fin de diseñar una estrategia de trading más fiable y efectiva.
A lo largo del tutorial del curso rápido de velas japonesas, el lector podrá hacerse una idea de las pautas gráficas más representativas con el fin de identificarlas en los gráficos de cualquier activo financiero y determinar la tendencia o los cambios de esta.
The document provides an overview of the Elliott Wave principle, which was discovered in the 1920s by Ralph Elliott. He found that stock markets move in repetitive cycles reflecting human psychology. Elliott identified fractal patterns on different timescales, with impulsive waves consisting of 5 waves in the direction of the trend and corrective waves against the trend. The Elliott Wave principle gained popularity in the 1970s and is used to analyze and forecast financial markets based on the recurring patterns Elliott discovered.
Support resistance trading strategies - a comparisonHimanshu Patil
The document discusses various support and resistance trading strategies, including manually drawing support and resistance lines, automatic support and resistance, pivot points, Fibonacci retracements, new highs/lows, and using risk/reward ratios. It provides guidance on determining the strength of support and resistance, and how to use these concepts for buying and selling decisions. Composite scans are presented for identifying potential high-volume breakouts and breakdowns.
Forex Trading For Beginners (2019) - The Holy Grail Of TradingRoberts Eihmanis
Forex Trading pdf eBook with the most distilled and actionable info: basics, tips, tricks & strategies for forex beginners.
Some of the topics covered:
- TOP 3 forex tools that professional traders use
- TOP 9 factors that influence the forex prices
- Why more than 86% of forex traders lose money
- The #1 advice from the investing guru Warren Buffet on how to make money while you sleep.
- How much should you invest to increase your chances of profitability
- TOP 5 news reports that create the most significant opportunities for profits
- - Forex trading strategy for news trading – how not to hit the stop loss
- The best times for trading forex
- 9 worst times for forex trading that you should avoid
- Which is the best timeframe for trading forex – learn from the pros
- Which analysis is better – fundamental or technical
- Best currency pairs to trade for beginners
- The secret nicknames of currencies
- The secrets of commodity currencies – how gold and oil can influence the forex prices
Este documento presenta 10 patrones técnicos comúnmente utilizados para analizar los mercados financieros. Explica cada patrón con detalles sobre su apariencia y significado, incluyendo banderas alcistas y bajistas, triángulos simétricos y expansivos, canales ascendentes y descendentes, y formaciones de inversión como el doble techo y el doble suelo. El objetivo es brindar una guía sobre estas herramientas técnicas para mejorar la comprensión de los movimientos de precios.
Introduction to elliott_wave_fibonacci_spread_tradingPragasit Thitaram
The document discusses Elliott-Wave theory and its application to analyzing market trends. Some key points:
1) Markets move in trends that can be characterized as impulses (moves with the trend) and corrections (moves against the trend). Trends exist on different timeframes.
2) According to Elliott-Wave theory, markets advance in 5 waves and retrace in 3 waves. These patterns repeat and combine to form larger degree waves.
3) An example is provided showing how Elliott-Wave analysis can identify the position of daily price moves within larger intermediate and major trends.
This document provides an overview of supply and demand trading strategies. It begins with an introduction and disclaimer about the risks of trading. It then discusses key concepts like identifying trends on charts, drawing trendlines, and understanding retracements and reversals. The document focuses on explaining supply and demand zones, how to identify and draw them on charts, and how to develop a trading strategy around high probability supply and demand zones. It emphasizes the importance of risk management strategies like stop losses and position sizing. The goal is to provide readers with the fundamental tools and framework to execute a supply and demand trading approach.
The best swing trading strategies are the ones that allow you to trade and profit from your beliefs about the market. I have added some of the most popular swing trading indicators as a guide for you to explore. The swing trading indicators listed here focus on trend trading, volatility, and overbought/oversold conditions.
This document provides an overview of technical analysis, including its key definitions, assumptions, differences from fundamental analysis, and various technical indicators used to analyze market trends such as support and resistance levels, trend lines, and Dow theory. Technical analysis uses historical price and volume data to identify patterns and predict future market behavior. It assumes current prices reflect all known information, prices move in trends, and past trends may recur in the future.
The document discusses the scalping trading strategy. It defines scalping as making many small profitable trades over short time periods, from seconds to minutes. Key aspects of scalping include taking short positions, aiming for small profit margins, and using leverage. The strategy outlined uses technical indicators like volume and moving averages to identify opportunities for quick trades when prices gap or pull back. It provides steps for analyzing volume to spot trends and reversals, and explains how to enter and exit trades quickly for small profits.
This document provides an introduction to trend following strategies for novice traders. It discusses how markets move based on the constant battle between bullish and bearish investors. When one group gains an advantage over the other, it can be difficult for the losing side to reverse the trend. The document advises traders to take an objective, neutral view of the market and look for major trends rather than trying to time every small movement. It emphasizes the importance of identifying clear support and resistance levels on charts in order to get into trades that have the greatest potential to yield large profits.
Support/Resistance is one of the techniques that performs very well if done properly. This webinar will focus on all the strategies based on Support/Resistance and show the attendee some tips on using each one and which one gives the best results and the reasons why. It also introduces a new feature in Investar, namely, Risk/Reward Ratio.
- Pivot Levels
- Fibonacci Retracements
- Gap Up/Gap Down
- New High/New Low
- Support/Resistance (Manually drawn or Automatic like Auto-SR)
- Brief intro to factors identifying strong support/resistance.
- Best settings for Auto-Support/Resistance
- Using the Risk/Reward Ratio
- Using Support/Resistance Zones
Day trading techniques include scalping, fading, daily pivots, and momentum trading. Scalping aims to take quick profits by entering and exiting positions as soon as they become profitable. Fading shorts a stock when it moves up quickly, expecting a sell-off. Daily pivots look to benefit from volatility by buying low and selling high, exiting on signs of reversal. Momentum trades ride trends fueled by news or volume until signs of reversal like decreasing volume or bearish candles. Day traders use candlestick charts, level 2 quotes, and newsfeeds to identify entry points supported by patterns, volume spikes, and order book depth.
Technical indicators are mathematical representations of market patterns and behavior that are used to generate buy and sell signals and confirm price movements. Some common leading indicators that precede price movement include RSI, Parabolic SAR, Stochastic, and Williams %R. Lagging indicators like MACD and moving averages follow price movement. Technical analysis uses indicators like RSI, Stochastic, and Bollinger Bands to identify overbought and oversold markets. Divergences between indicators and prices also signal potential trend reversals.
El documento trata sobre el análisis técnico del precio de acciones. Explica que el análisis de acción de precio se basa en los movimientos históricos de precios para identificar señales de entrada y salida en el mercado de valores. Describe conceptos clave como soportes, resistencias, pullbacks, dobles techos/suelos y zonas de consolidación/acumulación que son importantes para identificar patrones en el movimiento de precios. El objetivo final es aprender a reconocer estos patrones para tomar mejores decisiones
The document provides an overview of technical analysis techniques including Elliot wave theory. It discusses using moving averages, RSI, stochastic indicators, Bollinger bands and seasonal charting. It then covers Elliot wave patterns in depth, explaining impulse and corrective waves, wave degrees, extensions, truncations, zigzags, flats, triangles, and rules for waves 2 and 4. The document aims to demystify technical analysis and Elliot wave theory for traders.
This document summarizes an algorithm writing technique using invariants inspired by Professor Dijkstra's style of proving and deriving algorithms. It explains what invariants and predicates are, and how to use Hoare triples to prove correctness of while loops. An example is provided to derive an algorithm to calculate 2^n using an invariant. Exercises are provided to practice deriving algorithms for various problems like calculating sums, finding maximums, sorting arrays, and more using invariants.
A power series is a series of the form Σan(x-x0)n where x0 and an are numbers. A power series converges for x=c if the limit of the partial sums exists and is finite. The radius of convergence of a power series can be found using the ratio test, and determines the values of x for which the power series converges. Basic operations like addition, multiplication, differentiation, and index shifts can be performed on power series term-by-term.
This document contains definitions and information related to complex numbers and quadratic equations, including:
- Iota (i) represents the square root of -1.
- A complex number is defined as z = a + ib, where a is the real part and b is the imaginary part.
- Operations like addition, subtraction, multiplication, and division are defined for complex numbers by applying the operations to the real and imaginary parts separately.
- The modulus (absolute value) of a complex number z = a + ib is defined as |z| = √(a2 + b2).
- Complex numbers can be represented on a complex plane with real numbers on the x-axis and imaginary numbers on the y
This document provides an overview of topics in advanced physics, including vectors, Newton's laws of motion, projectile motion, momentum, energy, waves, and optics. It contains over 60 pages of content organized into sections on scalars and vectors, vector addition and subtraction, Newton's laws, reaction forces, projectile motion, momentum and collisions, energy, circular motion, simple harmonic motion, waves, interference, refraction, and lenses. Examples and practice problems are provided throughout to illustrate key concepts.
The document discusses inverse trigonometric functions and how to define their inverses by restricting the domains of the trig functions. It explains that the sine function's inverse is defined on [-1,1] and the cosine function's inverse is defined on [0,π]. Similarly, the tangent function's inverse is defined on (-π/2, π/2). Graphs and examples of the inverse sine, cosine, and tangent functions are provided.
An array is a fixed size sequence of elements of the same type. It allows direct access to elements by their index position. Arrays can store multiple values in an organized way and are a fundamental abstract data type. The document then provides algorithms for matrix addition, subtraction, and multiplication using two-dimensional arrays. It also discusses sparse matrices and different types of control statements like if/else, loops (while, do-while, for), and nested structures.
This document provides tutorials on mechanical principles and engineering structures. It focuses on tutorial 2 which covers reaction forces in pin-jointed framed structures. It defines pin joints and how they allow rotation. It distinguishes between struts, which are members in compression, and ties, which are in tension. It introduces Bow's notation for solving forces in framed structures by drawing force polygons at each joint. Worked examples demonstrate how to apply this method to determine the forces and whether each member is a strut or tie. Further practice problems are provided for the student to solve pin-jointed frames.
Discover the Beauty and Functionality of The Expert Remodeling Serviceobriengroupinc04
Unlock your kitchen's true potential with expert remodeling services from O'Brien Group Inc. Transform your space into a functional, modern, and luxurious haven with their experienced professionals. From layout reconfiguration to high-end upgrades, they deliver stunning results tailored to your style and needs. Visit obriengroupinc.com to elevate your kitchen's beauty and functionality today.
Starting a business is like embarking on an unpredictable adventure. It’s a journey filled with highs and lows, victories and defeats. But what if I told you that those setbacks and failures could be the very stepping stones that lead you to fortune? Let’s explore how resilience, adaptability, and strategic thinking can transform adversity into opportunity.
Zodiac Signs and Food Preferences_ What Your Sign Says About Your Tastemy Pandit
Know what your zodiac sign says about your taste in food! Explore how the 12 zodiac signs influence your culinary preferences with insights from MyPandit. Dive into astrology and flavors!
Ellen Burstyn: From Detroit Dreamer to Hollywood Legend | CIO Women MagazineCIOWomenMagazine
In this article, we will dive into the extraordinary life of Ellen Burstyn, where the curtains rise on a story that's far more attractive than any script.
NIMA2024 | De toegevoegde waarde van DEI en ESG in campagnes | Nathalie Lam |...BBPMedia1
Nathalie zal delen hoe DEI en ESG een fundamentele rol kunnen spelen in je merkstrategie en je de juiste aansluiting kan creëren met je doelgroep. Door middel van voorbeelden en simpele handvatten toont ze hoe dit in jouw organisatie toegepast kan worden.
Cover Story - China's Investment Leader - Dr. Alyce SUmsthrill
In World Expo 2010 Shanghai – the most visited Expo in the World History
https://www.britannica.com/event/Expo-Shanghai-2010
China’s official organizer of the Expo, CCPIT (China Council for the Promotion of International Trade https://en.ccpit.org/) has chosen Dr. Alyce Su as the Cover Person with Cover Story, in the Expo’s official magazine distributed throughout the Expo, showcasing China’s New Generation of Leaders to the World.
Prescriptive analytics BA4206 Anna University PPTFreelance
Business analysis - Prescriptive analytics Introduction to Prescriptive analytics
Prescriptive Modeling
Non Linear Optimization
Demonstrating Business Performance Improvement
Best Competitive Marble Pricing in Dubai - ☎ 9928909666Stone Art Hub
Stone Art Hub offers the best competitive Marble Pricing in Dubai, ensuring affordability without compromising quality. With a wide range of exquisite marble options to choose from, you can enhance your spaces with elegance and sophistication. For inquiries or orders, contact us at ☎ 9928909666. Experience luxury at unbeatable prices.
Satta matka fixx jodi panna all market dpboss matka guessing fixx panna jodi kalyan and all market game liss cover now 420 matka office mumbai maharashtra india fixx jodi panna
Call me 9040963354
WhatsApp 9040963354
The Genesis of BriansClub.cm Famous Dark WEb PlatformSabaaSudozai
BriansClub.cm, a famous platform on the dark web, has become one of the most infamous carding marketplaces, specializing in the sale of stolen credit card data.
𝐔𝐧𝐯𝐞𝐢𝐥 𝐭𝐡𝐞 𝐅𝐮𝐭𝐮𝐫𝐞 𝐨𝐟 𝐄𝐧𝐞𝐫𝐠𝐲 𝐄𝐟𝐟𝐢𝐜𝐢𝐞𝐧𝐜𝐲 𝐰𝐢𝐭𝐡 𝐍𝐄𝐖𝐍𝐓𝐈𝐃𝐄’𝐬 𝐋𝐚𝐭𝐞𝐬𝐭 𝐎𝐟𝐟𝐞𝐫𝐢𝐧𝐠𝐬
Explore the details in our newly released product manual, which showcases NEWNTIDE's advanced heat pump technologies. Delve into our energy-efficient and eco-friendly solutions tailored for diverse global markets.
During the budget session of 2024-25, the finance minister, Nirmala Sitharaman, introduced the “solar Rooftop scheme,” also known as “PM Surya Ghar Muft Bijli Yojana.” It is a subsidy offered to those who wish to put up solar panels in their homes using domestic power systems. Additionally, adopting photovoltaic technology at home allows you to lower your monthly electricity expenses. Today in this blog we will talk all about what is the PM Surya Ghar Muft Bijli Yojana. How does it work? Who is eligible for this yojana and all the other things related to this scheme?
IMPACT Silver is a pure silver zinc producer with over $260 million in revenue since 2008 and a large 100% owned 210km Mexico land package - 2024 catalysts includes new 14% grade zinc Plomosas mine and 20,000m of fully funded exploration drilling.
❼❷⓿❺❻❷❽❷❼❽ Dpboss Matka Result Satta Matka Guessing Satta Fix jodi Kalyan Final ank Satta Matka Dpbos Final ank Satta Matta Matka 143 Kalyan Matka Guessing Final Matka Final ank Today Matka 420 Satta Batta Satta 143 Kalyan Chart Main Bazar Chart vip Matka Guessing Dpboss 143 Guessing Kalyan night
Sustainable Logistics for Cost Reduction_ IPLTech Electric's Eco-Friendly Tra...
Complex correction
1. Practical Application of Elliott’s Wave Principles by Deepak Kumar December 21, 2014
1 Analysis by Deepak Kumar | www.sweeglu.com
Triple Zigzag Correction of Elliott Wave Theory Explained by Deepak Kumar
Triple Zigzag correction also known as Complex Correction or Combination Correction is a combination
of three set of “abc” cycles connected by a link wave ‘x’ and it always forms a wedge pattern. Wedge
may be triangle or parallel.
You must have heard of Triple Zigzag or Complex correction in many books or videos but today I am
going to explain something about triple zigzag that you may not find anywhere else. This deep
explanation of Triple Zigzag correction is a result of my own research and observations of last 3 year. But
let me familiarize you with some basics of corrections (Corrective Waves) before Complex Correction.
As I explained in “Elliott’s Wave Cycle” that there are total 8 waves in Elliott waves cycle which are
1,2,3,4,5 and a,b,c. Waves 1,3,5,a and c are Impulsive waves whereas 2,4 and b are corrective waves.
Corrective waves 2, 4 and b are also called correction and also consist of three internal waves (a,b,c).
Now, these corrective waves have 4 different patterns:
1. Simple Zigzag Correction
2. 3-3-5 Flat Correction
3. Irregular Correction
4. Complex Correction/Combination Correction
This combination correction can be “Double Zigzag” or “Triple Zigzag”. We see Triple Zigzag correction
most of the time as Complex Correction and now I am going to explain the internal structure, personality
and importance “Triple Zigzag Correction” here in this article. Let me start.
Triple Zigzag Correction
Triple Zigzag correction is combination or series of three zigzag corrections (three “abc” cycles)
connected by a link wave “x” between every “abc” cycle and its internal structure is (abc-x-abc-x-abc).
Triple Zigzag correction always forms a wedge pattern and that wedge may be triangle or parallel.
The individual internal “abc” cycle of Triple Zigzag may be Simple Zigzag Correction, 3-3-5 Flat
Correction or Irregular Correction.
Link wave “x” generally has three inner waves (abc) and can be any type of correction.
Triple Zigzag correction is most important pattern of Elliott Wave Theory and it can give huge profit with
minimum risk if you manage to identify before it before breakout. Triple Zigzag takes long time in
completion and results in long consolidation with range bound volatility.
But breakout after completion of Triple Zigzag is always aggressive and we see a great aggressive move
after breakout from the pattern. This correction is a tug of war between buyers and sellers that make
price to move up and down within in a range for long time. But breakout from this range bound pattern
makes mass traders/investors confident about the trend and they start taking action in the direction of
breakout aggressively after a long wait. Let me show you some practical examples:
2. Practical Application of Elliott’s Wave Principles by Deepak Kumar December 21, 2014
2 Analysis by Deepak Kumar | www.sweeglu.com
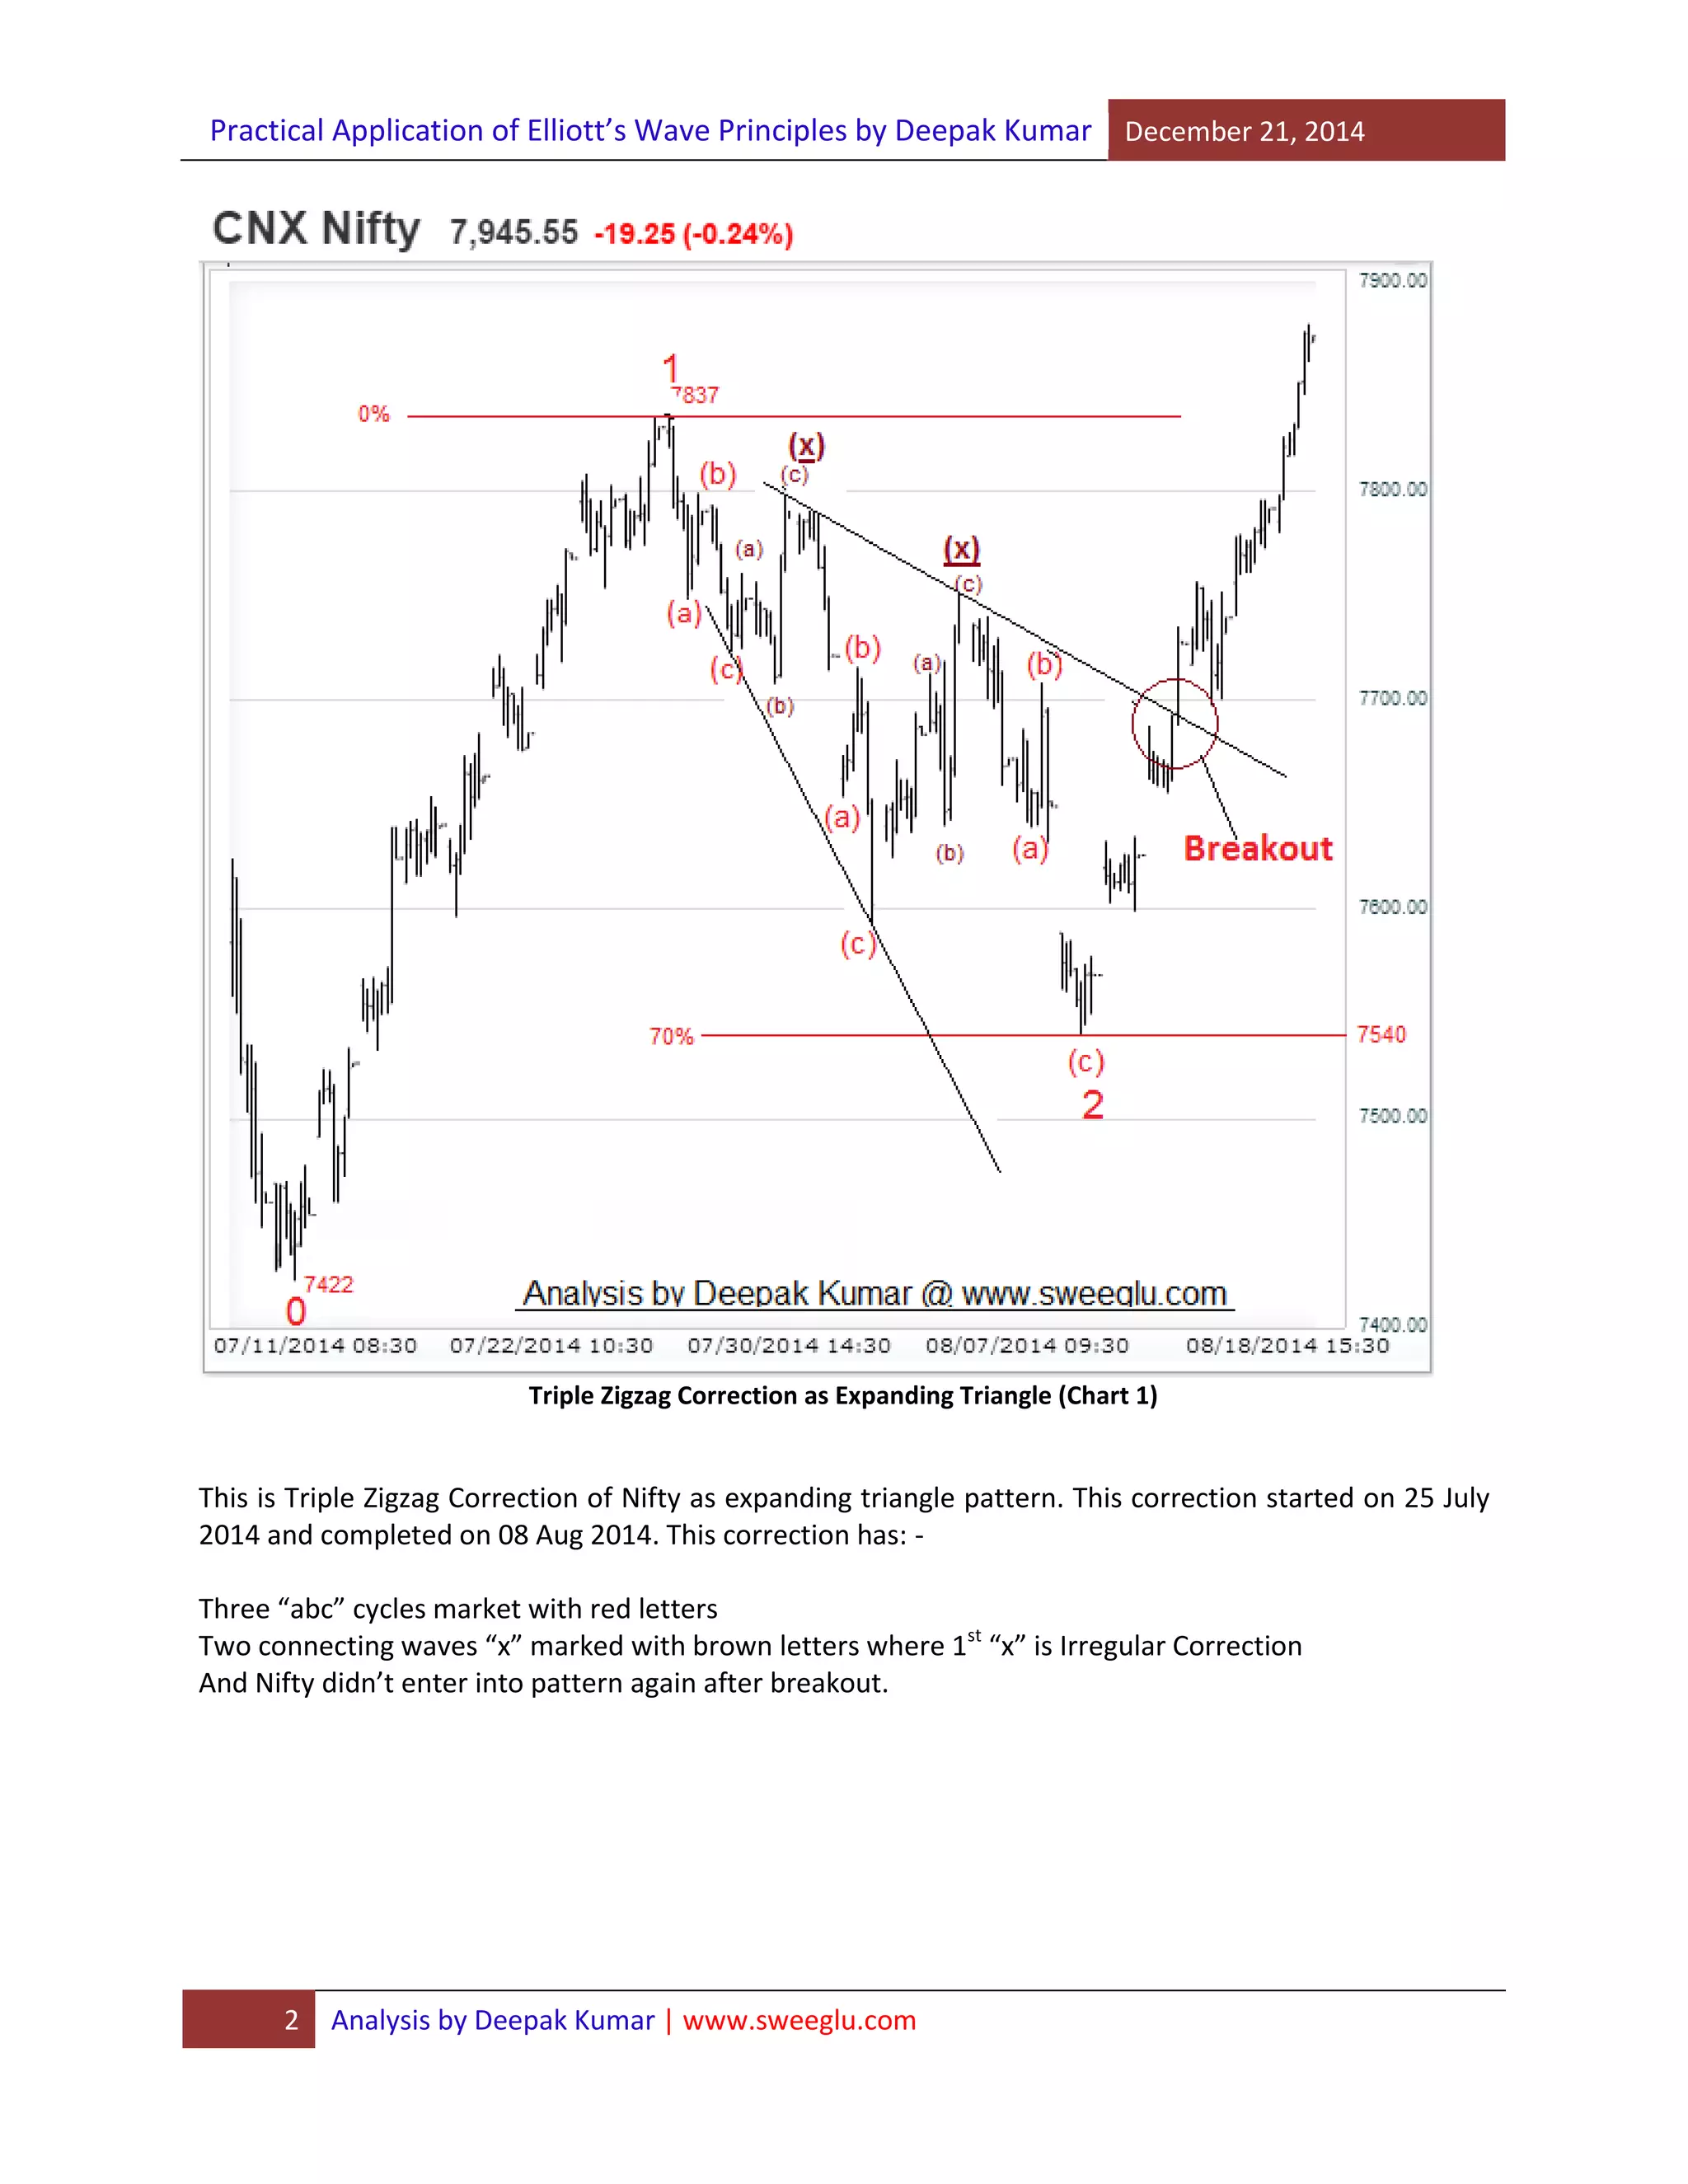
Triple Zigzag Correction as Expanding Triangle (Chart 1)
This is Triple Zigzag Correction of Nifty as expanding triangle pattern. This correction started on 25 July
2014 and completed on 08 Aug 2014. This correction has: -
Three “abc” cycles market with red letters
Two connecting waves “x” marked with brown letters where 1st
“x” is Irregular Correction
And Nifty didn’t enter into pattern again after breakout.
3. Practical Application of Elliott’s Wave Principles by Deepak Kumar December 21, 2014
3 Analysis by Deepak Kumar | www.sweeglu.com
Triple Zigzag Correction as Contracting Triangle (Chart 2)
This is another Triple Zigzag correction as Contracting Triangle Wedge Pattern. This pattern started on
08 Sept 2014 and completed on 17 Oct 2014. This triple Zigzag Correction also has three “abc” cycles
connected with two “x” waves in between. 2nd
“x” wave is Irregular Correction.
Nifty bounced about 800 points after breakout from this correction without entering again in the
pattern after breakout. And it is not just an example but I identified it before time. Read this report:
Nifty can Show 8380 before breaking below 7723.
I will show you the nature of move after breakout later in this article.
4. Practical Application of Elliott’s Wave Principles by Deepak Kumar December 21, 2014
4 Analysis by Deepak Kumar | www.sweeglu.com
Triple Zigzag Correction as Parallel Wedge Pattern (Chart 3)
This is another practical example for Triple Zigzag as Parallel Wedge Pattern started on 17 Nov 2014 and
completed on 20 Nov 2014. This correction also has three inner “abc” cycles connected by link waves
“x’. Just observe the nature of next move after breakout. Nifty didn’t enter again in wedge after
breakout.
Again, this is not just example and I identified this correction well in advance but I missed this
opportunity because of small confusion and it was a learning lesson. Read this report: Elliott Wave
Analysis Report of Nifty for 21 Nov 2014.
Let me show you after effect of these Triple Zigzag corrections on Bigger Time Frame Chart:
5. Practical Application of Elliott’s Wave Principles by Deepak Kumar December 21, 2014
5 Analysis by Deepak Kumar | www.sweeglu.com
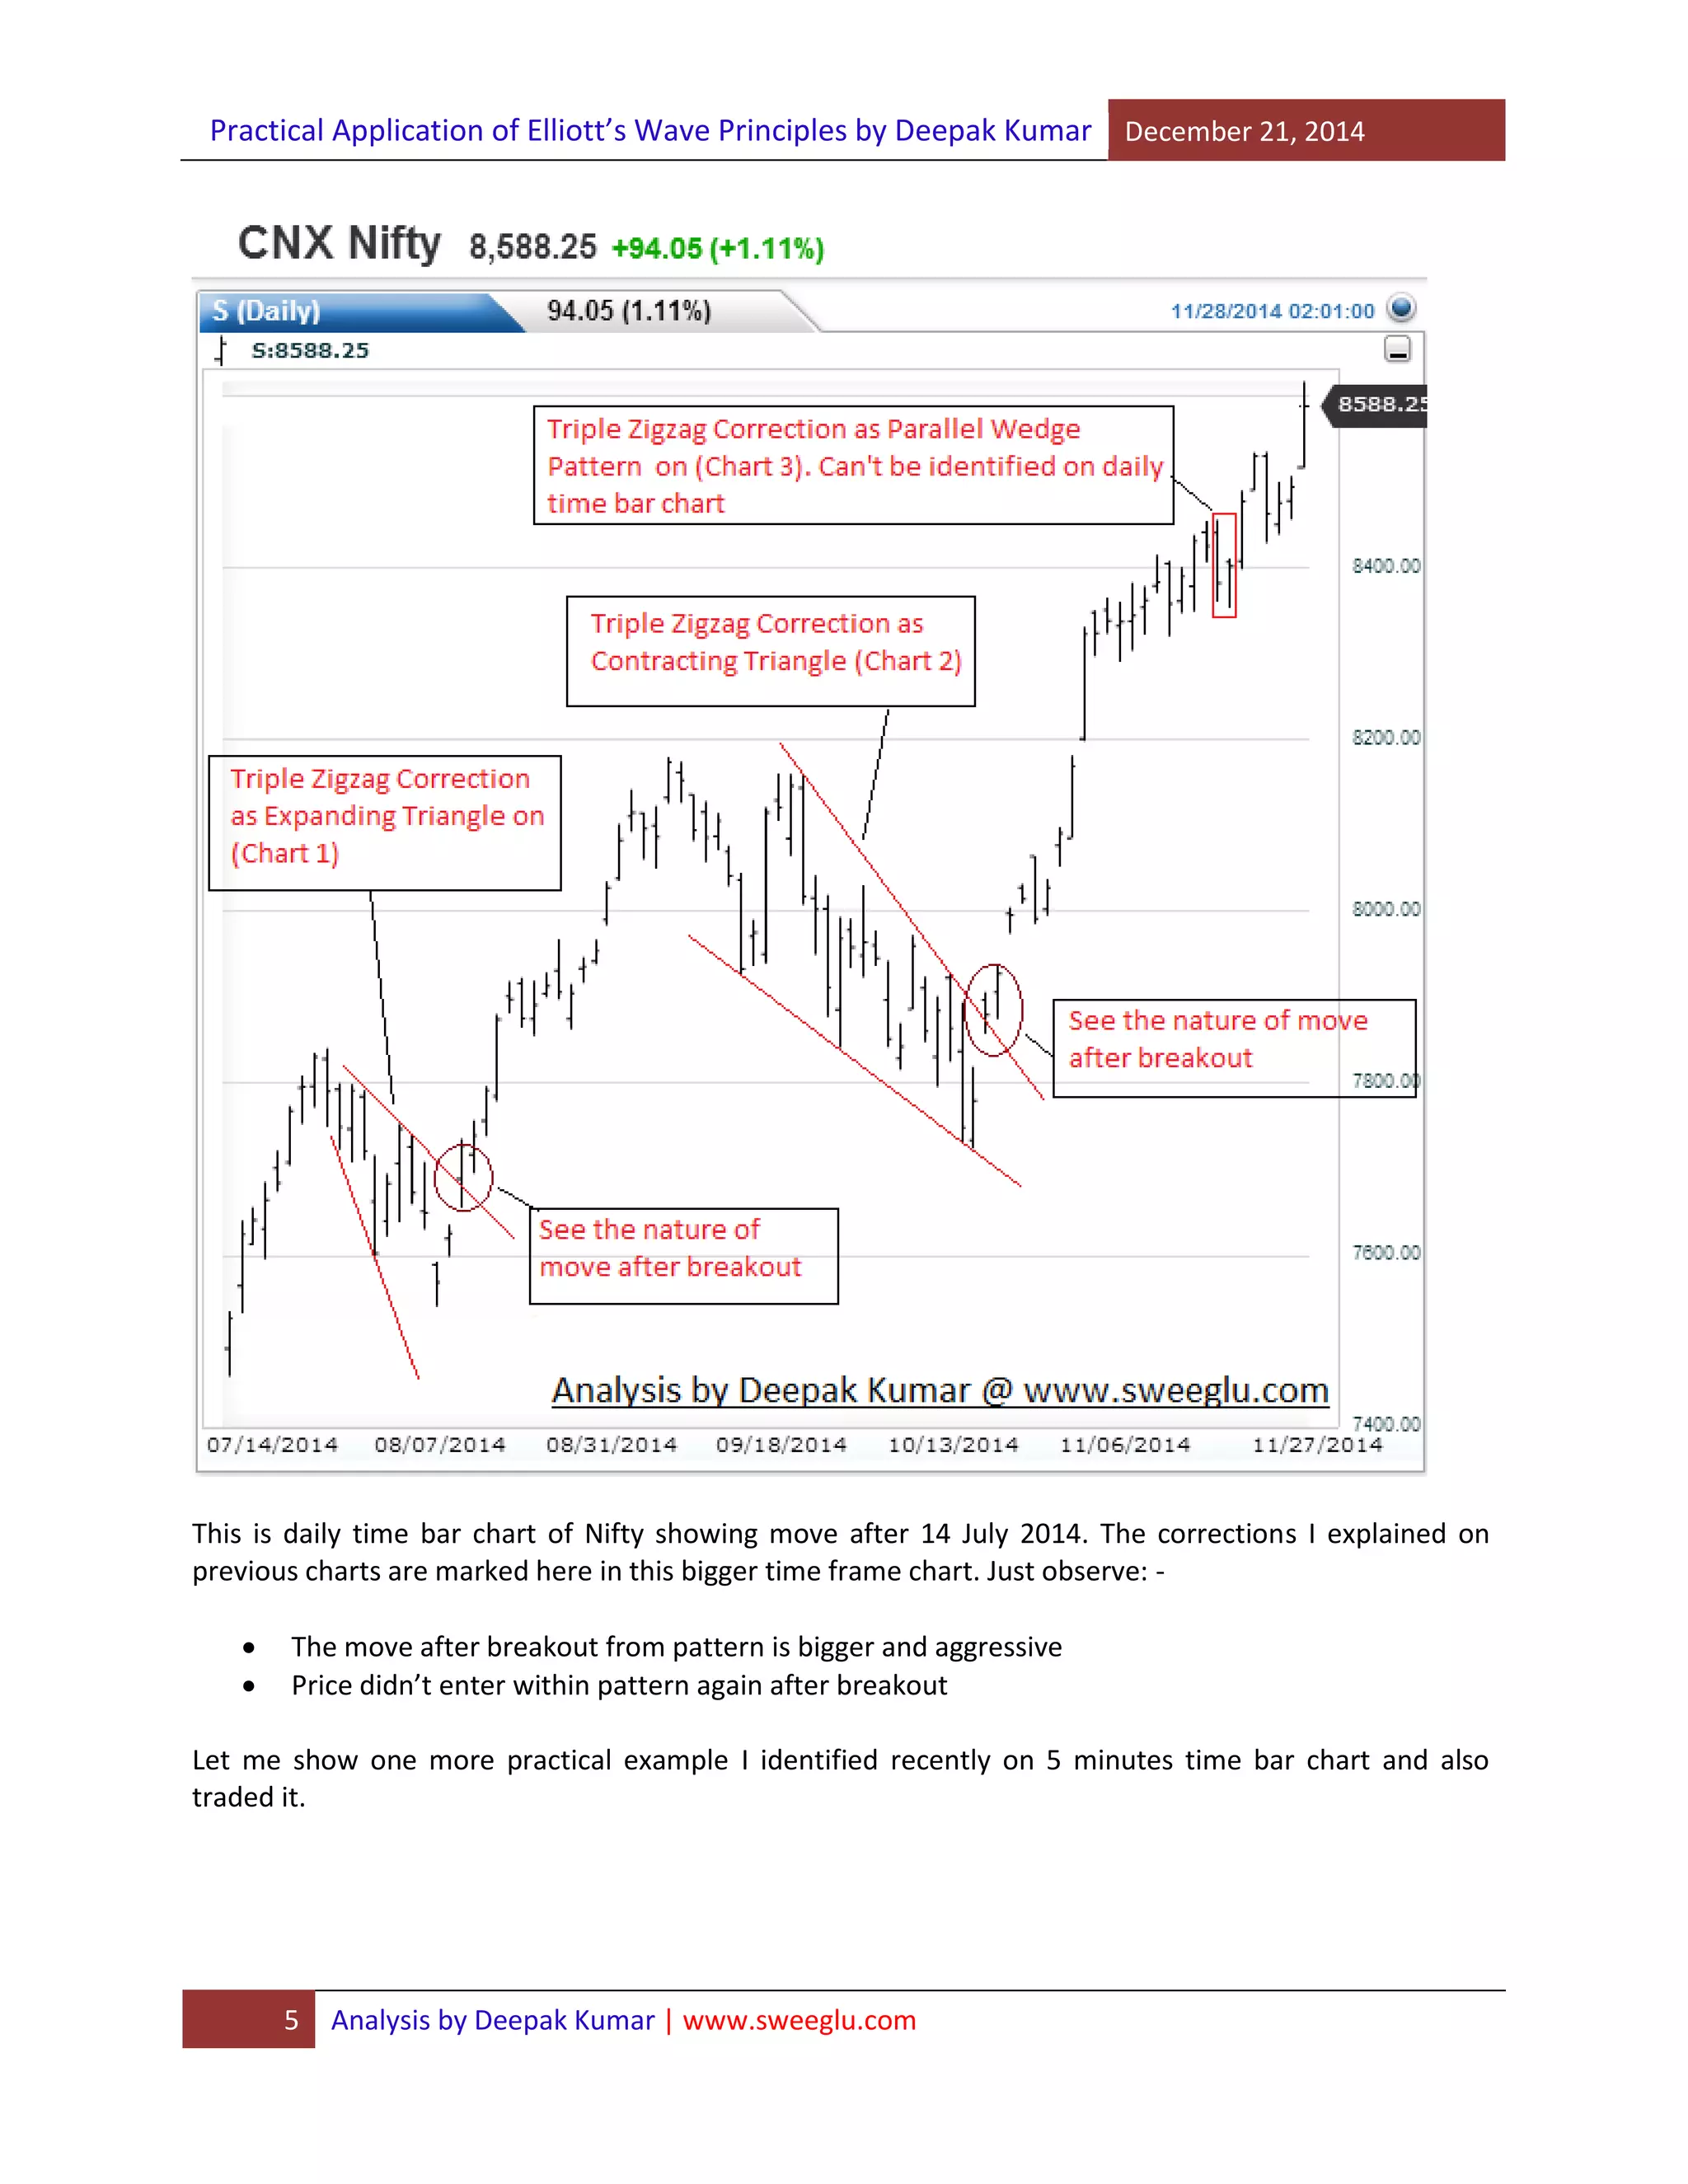
This is daily time bar chart of Nifty showing move after 14 July 2014. The corrections I explained on
previous charts are marked here in this bigger time frame chart. Just observe: -
The move after breakout from pattern is bigger and aggressive
Price didn’t enter within pattern again after breakout
Let me show one more practical example I identified recently on 5 minutes time bar chart and also
traded it.
6. Practical Application of Elliott’s Wave Principles by Deepak Kumar December 21, 2014
6 Analysis by Deepak Kumar | www.sweeglu.com
This is again a triple zigzag correction on 5 minutes time bar chart I identified on 09 Dec 2014. See the
inner waves of correction and also the nature of move after breakout. Again I identified it in advance and
also traded it. Read this Report: Elliott Wave Analysis Report of Nifty for 11 Dec 2014
These are some practical examples of Triple Zigzag Corrections and now let me explain deeply about its
internal structure, calculations and identification.
7. Practical Application of Elliott’s Wave Principles by Deepak Kumar December 21, 2014
7 Analysis by Deepak Kumar | www.sweeglu.com
Calculation and Personality of Inner waves of Complex Correction:
As I explained, Triple Correction has (abc-x-abc-x-abc) as internal wave’s structure where three “abc”
cycles are linked by wave “x” between every cycle. If we assume (abc-x-abc-x-abc) and waves (1-2-3-4-5)
then it follows the same calculation I explained in “Personalities and Calculation of Waves” chapter in my
book. The only difference is: -
1. Wave 2 (x1) can correct more than 100% of 1 (1st
“abc” cycle) in Triple Zigzag Correction. Means
wave “x” can be irregular. Whereas wave 2 is not allowed to correct more than 100% of wave 1
in case of Impulse or Ending Diagonal Triangle.
2. There is no condition for wave 4 (x2). Wave 4 (x2) can or cannot overlap wave 2 (x1).
Otherwise all other calculations are same. For example: -
Wave 3 (2nd
“abc”) can never be shortest.
Wave 3 (2nd
“abc”) will be taken as extended above 161% and calculation of wave 5 (3rd
“abc”)
depends on extension of wave 3. i.e. if wave is extended then wave 5 can be normal (below 61%)
and opposite in other case.
All internal waves (all smaller ‘a’, ‘b’, and ‘c’ waves) carries the same calculations and
personalities as I explained in “Personalities of Calculations of waves” chapter of my book.
You can predict the end of correction even before breakout following these calculation and information.
Drawing the line of Wedge/Pattern
Most of the starters don’t know where to draw lines of Wedge for Triple Zigzag and that is the reason
they failed to identify its formation and breakout. We need to draw lines: -
1st
line must be drawn joining the end points of 1st “abc” cycle and 2nd
“abc” cycle.
2nd
line must be drawn joining the end points of both “x” waves.
You need not to use start of correction to draw the lines for wedge.
3rd
“abc” cycle (last) need not to touch the line of wedge.
And breakout is always through the line joining (x) waves.
Just see the charts above to observe the same as I mentioned here about drawing lines and direction of
breakout. All these observations will help you to identify this Triple Zigzag correction, direction of
immediate trend and direction of breakout well in advance to make you mentally prepared to catch next
big move.
8. Practical Application of Elliott’s Wave Principles by Deepak Kumar December 21, 2014
8 Analysis by Deepak Kumar | www.sweeglu.com
Importance of Triple Zigzag:
I am always excited after identifying the formation of Triple Zigzag as I feel it as jackpot opportunity
after completion. The most important factors of this correction are: -
1. Move after the completion of this correction is aggressive most of the time which is good for
quick profits and better for options trading.
2. Price rarely enters the pattern again after breakout which gives very low stop loss for very high
profit probability.
Practical Application of Elliott’s Wave Principles by Deepak Kumar
(The perfect tool to predict the futureof Stock Market)
By : Deepak Kumar
Phone: 8716001383, 8885001304
WhatsApp: 9618211353
Email: sweeglu@gmail.com
Website: www.sweeglu.com