Download to read offline

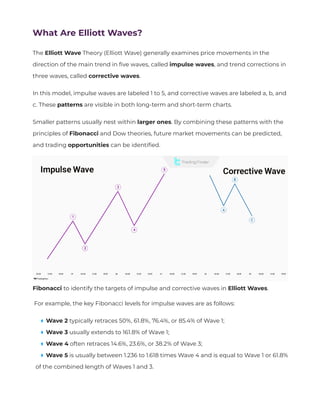


The Elliott Wave Theory in technical analysis is used to describe price movements in financial markets. This concept was developed by Ralph Nelson Elliott after identifying repetitive fractal wave patterns and was divided into two parts: impulse waves and corrective waves.


![What Is Cryptocurrency? [Decentralized & Secure P2P Financial Transactions]](https://cdn.slidesharecdn.com/ss_thumbnails/whatiscryptocurrencydecentralizedsecurep2pfinancialtransactions-250609051556-6e359d34-thumbnail.jpg?width=640&height=640&fit=bounds)
![What is Blockchain? [Applications of Blockchain in Cryptocurrency and Banking]](https://cdn.slidesharecdn.com/ss_thumbnails/blockchaindecentralizedstoragepowposmechanisms-250609045147-b01d52eb-thumbnail.jpg?width=640&height=640&fit=bounds)


![ICT Trading Style Abbreviations and Terminologies [FVGs, OBs, PO3 & MMXM]](https://cdn.slidesharecdn.com/ss_thumbnails/icttradingstyleabbreviationsandterminologiesfvgsobspo3mmxm-250527052348-38610370-thumbnail.jpg?width=640&height=640&fit=bounds)
![What is Inflation? [Examining the PPI, CPI, and PCE Indices]](https://cdn.slidesharecdn.com/ss_thumbnails/inflationcpimonetaryandcostpushinflation2-250524044427-996efc14-thumbnail.jpg?width=640&height=640&fit=bounds)

![Economic Recession [2008 Recession and Government Actions].pdf](https://cdn.slidesharecdn.com/ss_thumbnails/economicrecession2008recessionandgovernmentactions-250519053549-486f743e-thumbnail.jpg?width=640&height=640&fit=bounds)


![The Impact of Monetary Policy on Inflation [Contractionary and Expansionary]](https://cdn.slidesharecdn.com/ss_thumbnails/theimpactofmonetarypolicyoninflation-250515064846-124938d8-thumbnail.jpg?width=640&height=640&fit=bounds)


