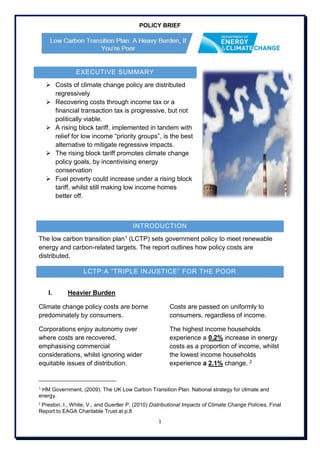
The document discusses policies to address the regressive impacts of climate change policies. It finds that lower income households bear a disproportionate burden yet contribute less to emissions. A rising block tariff that exempts low income priority groups is proposed to make costs more progressive while incentivizing conservation. However, it may increase fuel poverty. Recovering costs through taxes is most progressive but not politically viable.

![Page 3 of 14
Progressive
The lowest income households will see
an increase in disposable income of
£96, whilst the richest would carry the
heaviest burden, and see a decrease
of £1378.5 Therefore, it is progressive
as the richest pay more.
Politics
The U.K. is currently reducing a large
structural deficit. Therefore, using
income taxation to pay for climate
change policy may face political
opposition.
II. Rising Block Tariff “RBT”
The RBT forces energy companies to
change their pricing plans, so that the
first block of energy, which is essential
for civilised existence, does not
embrace any policy costs. This block is
sold at a cheaper rate. Thereafter, for
additional energy, which is optional, a
higher price will be charged.
5 Preston, I., White, V., and Guertler P,(2010)
Distributional Impacts of Climate Change
Policies, Final Report to EAGA Charitable
Trust at p.56
6 Gardner, Richard L.,and Robert A. Young.
(1984b] Effects of Alternative Energy Rates
And Rate Structures On Electricity and Water
This is a purely regulatory measure,
administratively feasible, with low
impact on public funds.
Promotes Consumptive Frugality
The current prevailing energy tariffs
have decreasing prices with
consumption. This approach does not
incentivise consumers to conserve
energy.
On the contrary, with RBT, an
increasing cost of energy will
incentivise consumers to conserve
energy,6 promoting carbon reduction
goals.
Progressive
Higher income households consume
greater amounts of energy, and thus
will be subject to the higher rate,
incurring additional expenses.
Lower income households stand to
benefit, because their energy
consumption tends to fall below the
basic amount, Therefore, they will
enjoy the lower rate, and see their bills
fall.7
Use On the Colorado High Plains. Fort Collins:
Colorado Water Resources Research Institute
Completion Report 135 at p.9 & 10
7 Preston, I., White, V., and Guertler P,(2010)
Distributional Impacts of Climate Change](https://image.slidesharecdn.com/5ad4de1d-fdbc-4bf6-9735-10c64b884e11-160829130255/85/COMPLETED-ESSAY-FINAL-3-320.jpg)


![Page 10 of 14
Total bills increase with consumption,
but at a decreasing rate, due to the
marginal cost diminishing.
Thus the incentive to conserve
declines as lower rate levels are
reached.26
Under RBT marginal costs increase
with increasing consumption, therefore
the total cost of electricity also grows
at an increasing rate.
Social Policies. Journal of Social Policy, 42, pp
191-213 at p.198
26 Gardner, Richard L.,and Robert A. Young.
(1984b] Effects of Alternative Energy Rates
And Rate Structures On Electricity and Water
Use On the Colorado High Plains. Fort Collins:
Colorado Water Resources Research Institute
Completion Report 135 at p.9
27 Ibid at p.10
The incentives to conserve
increases as higher rate levels are
achieved.27
Detrimental To Low Income High
Consumption Households
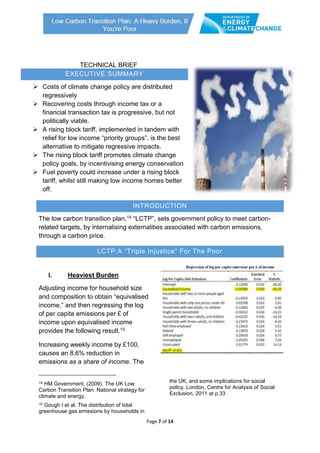
Regression analysis reveals that
income itself explains only 25% of the
variation in log per capita emissions.28
Therefore, there is considerable
variation in emissions within income
deciles, shown below.29
Bubble width represents total count of
households. The red box shows
28 Gough I et al. The distribution of total
greenhouse gas emissions by households in
the UK, and some implications for social
policy. London, Centre for Analysis of Social
Exclusion, 2011 at p.29
29 White, V., Roberts, S. and Preston, I.
(2010), Understanding ‘High Use Low Income’
Energy Consumers, Final Report to Ofgem,
Bristol: Centre for Sustainable Energy at p.9](https://image.slidesharecdn.com/5ad4de1d-fdbc-4bf6-9735-10c64b884e11-160829130255/85/COMPLETED-ESSAY-FINAL-10-320.jpg)


![Page 14 of 14
Bibliography
Baker et al (2009), A General Financial Transaction Tax: A Short Cut of the Pros, the
Cons and a Proposal;
BRE (2009), An Investigation Of the Effect Of Rising Block Tariffs On Fuel Poverty.
Committee For Climate Change.
Committee on Climate Change (2008). First Report: Building a Low-carbon
Economy.London: HMSO.
HM Government, (2009). The UK Low Carbon Transition Plan. National strategy for
climate and energy.
White, V., Roberts, S. and Preston, I. (2010), Understanding ‘High Use Low Income’
Energy Consumers, Final Report to Ofgem, Bristol: Centre for Sustainable Energy
Gough I et al. The distribution of total greenhouse gas emissions by households in
the UK, and some implications for social policy. London, Centre for Analysis of
Social Exclusion, 2011
Gardner, Richard L.,and Robert A. Young. (1984b] Effects of Alternative Energy
Rates And Rate Structures On Electricity and Water Use On the Colorado High
Plains. Fort Collins: Colorado Water Resources Research Institute Completion
Report 135
IAN GOUGH (2013). Carbon Mitigation Policies, Distributional Dilemmas and
Social Policies. Journal of Social Policy, 42, pp 191-213 at p.198
Preston, I., White, V., and Guertler P,(2010) Distributional Impacts of Climate
Change Policies, Final Report to EAGA Charitable](https://image.slidesharecdn.com/5ad4de1d-fdbc-4bf6-9735-10c64b884e11-160829130255/85/COMPLETED-ESSAY-FINAL-14-320.jpg)


