Download as PDF, PPTX


![INFLUENCES ON COMPETITIVENESS
WORLD ECONOMY
BROAD ECONOMIC AREAS
GROUP OF NEIGHBOURING NATIONS
NATIONS
STATES, PROVINCES
METROPOLITAN AREAS, RURAL AREAS
Multiple Geographic Levels
[Our Focus]
Source:- Institute for Strategy and Competitiveness
Institute for Competitiveness, India Presented by: Dr. Amit Kapoor](https://image.slidesharecdn.com/competitivenessandurbanmobility-170308123953/85/Competitiveness_and_urban_mobility-4-320.jpg)
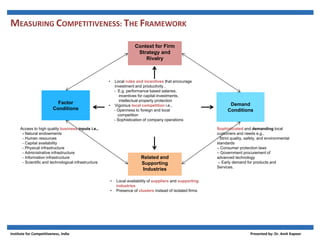

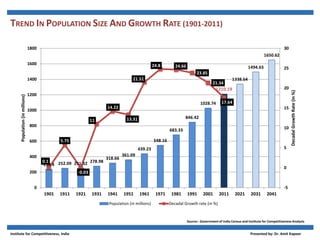
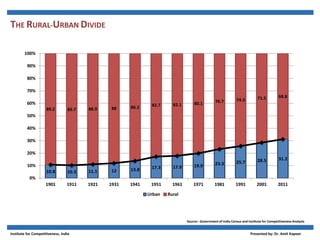

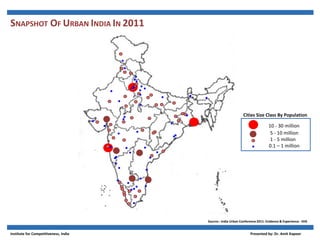

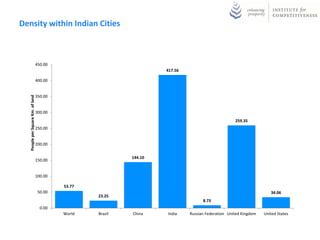

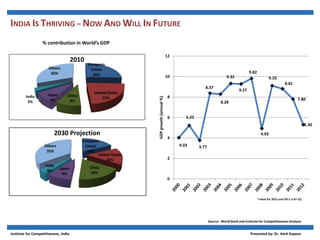


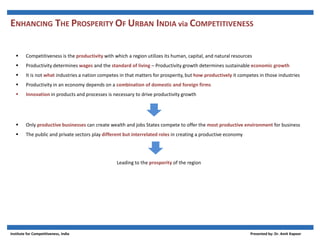
The document discusses the competitiveness of Indian cities in comparison to global benchmarks, highlighting the importance of productivity and innovation as drivers of economic growth. It emphasizes that a productive environment is essential for business prosperity, involving both public and private sector collaboration. Statistical analyses reveal trends in urbanization, population growth, and urban density, illustrating challenges and opportunities for urban India in enhancing overall competitiveness.