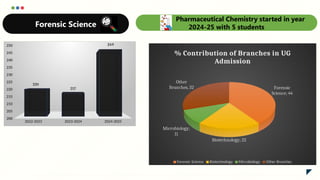
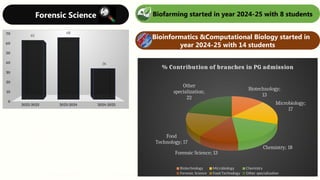
Forensic Science Biofarmingstarted in year 2024-25 with 8 students
2022-2023 2023-2024 2024-2025
0
10
20
30
40
50
60
70 65
68
34
Bioinformatics &Computational Biology started in
year 2024-25 with 14 students
Biotechnology;
13
Microbiology;
17
Chemistry; 18
Forensic Science; 13
Food
Technology; 17
Other
specialization;
22
% Contribution of branches in PG admission
Biotechnology Microbiology Chemistry
Forensic Science Food Technology Other specialization
9.
2022-23 2023-24 2024-2025
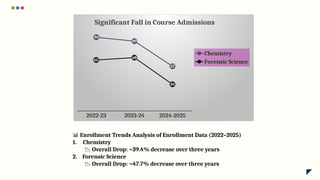
94
89
57
65
68
34
SignificantFall in Course Admissions
Chemistry
Forensic Science
📊 Enrollment Trends Analysis of Enrollment Data (2022–2025)
1. Chemistry
📉 Overall Drop: ~39.4% decrease over three years
2. Forensic Science
📉 Overall Drop: ~47.7% decrease over three years
2022-23 2023-24 2024-25
0
100
200
300
400
500
600
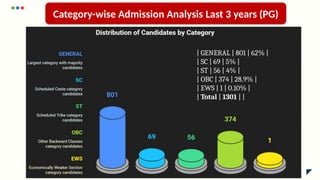
230
186163
283
223 216
513
409
379
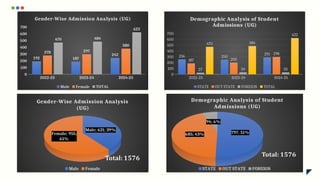
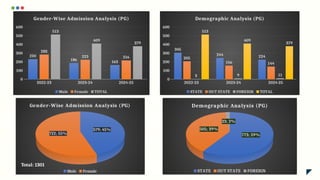
Gender-Wise Admission Analysis (PG)
Male Female TOTAL
579; 45%
722; 55%
Gender-Wise Admission Analysis (PG)
Male Female
Total: 1301
2022-23 2023-24 2024-25
0
100
200
300
400
500
600
305
244 224
205
156 144
3 9 11
513
409
379
Demographic Analysis (PG)
STATE OUT STATE FOREIGN TOTAL
773; 59%
505; 39%
23; 2%
Demographic Analysis (PG)
STATE OUT STATE FOREIGN
15.
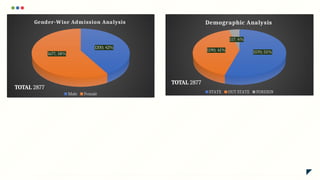
1200; 42%
1677; 58%
Gender-WiseAdmission Analysis
Male Female
TOTAL 2877
1570; 55%
1190; 41%
117; 4%
Demographic Analysis
STATE OUT STATE FOREIGN
TOTAL 2877
18.
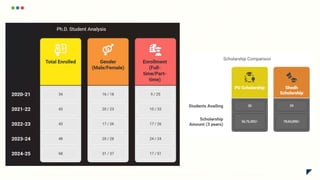
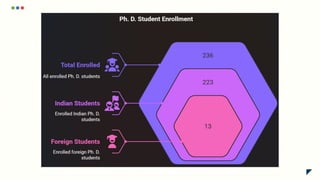
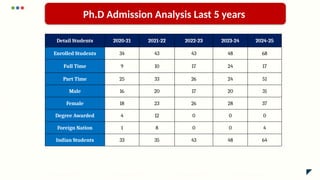
Ph.D Admission AnalysisLast 5 years
Detail Students 2020-21 2021-22 2022-23 2023-24 2024-25
Enrolled Students 34 43 43 48 68
Full Time 9 10 17 24 17
Part Time 25 33 26 24 51
Male 16 20 17 20 31
Female 18 23 26 28 37
Degree Awarded 4 12 0 0 0
Foreign Nation 1 8 0 0 4
Indian Students 33 35 43 48 64
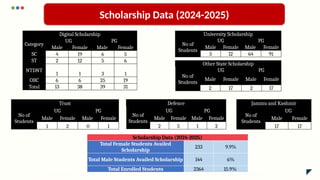
Digital Scholarship
Category
UG PG
MaleFemale Male Female
SC 4 19 6 5
ST 2 12 5 6
NTDNT
1 1 3 1
OBC 6 6 25 19
Total 13 38 39 31
University Scholarship
No of
Students
UG PG
Male Female Male Female
3 12 64 91
Other State Scholarship
No of
Students
UG PG
Male Female Male Female
2 17 2 17
Trust
No of
Students
UG PG
Male Female Male Female
1 2 0 1
Defence
No of
Students
UG PG
Male Female Male Female
2 5 1 2
Jammu and Kashmir
No of
Students
UG
Male Female
17 17
Scholarship Data (2024-2025)
Scholarship Data (2024-2025)
Total Female Students Availed
Scholarship
233 9.9%
Total Male Students Availed Scholarship 144 6%
Total Enrolled Students 2364 15.9%
21.
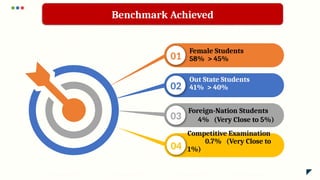
Female Students
58% >45%
01
02
03
Competitive Examination
0.7% (Very Close to
1%)
04
Benchmark Achieved
Out State Students
41% > 40%
Foreign-Nation Students
4% (Very Close to 5%)
22.
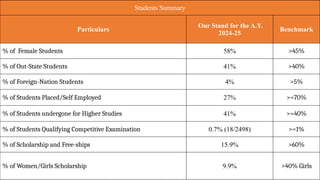
Students Summary
Particulars
Our Standfor the A.Y.
2024-25
Benchmark
% of Female Students 58% >45%
% of Out-State Students 41% >40%
% of Foreign-Nation Students 4% >5%
% of Students Placed/Self Employed 27% >=70%
% of Students undergone for Higher Studies 41% >=40%
% of Students Qualifying Competitive Examination 0.7% (18/2498) >=1%
% of Scholarship and Free-ships 15.9% >60%
% of Women/Girls Scholarship 9.9% >40% Girls
23.
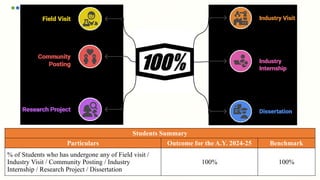
Students Summary
Particulars Outcomefor the A.Y. 2024-25 Benchmark
% of Students who has undergone any of Field visit /
Industry Visit / Community Posting / Industry
Internship / Research Project / Dissertation
100% 100%
24.
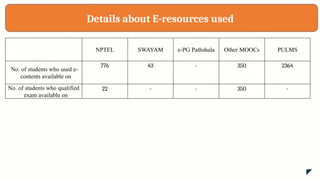
Details about E-resourcesused
NPTEL SWAYAM e-PG Pathshala Other MOOCs PULMS
No. of students who used e-
contents available on
776 43 - 350 2364
No. of students who qualified
exam available on
22 - - 350 -
25.
Details about ValueAdded Course
Sr. No. Name of the Value Added Course(Other than offered by CEP) Course code
Duration
(in Hours)
Number of
students
enrolled
Number of
students who
successfully
completed the
course
1 Protein Technology 227603 16 13 13
2 Environment Pollution & Prevention 227597 16 24 23
3 Good Laboratory Practices (GLP) 227593 16 90 90
4 Advanced Separation Technology 227590 16 2 2
5 Medical Geology 227675 16 6 6
6 Data Science For Earth And Environment: Leveraging Statistical Tools 227736 16 17 17
7 Intellectual Property Rights and Biosafety 227629 16 18 18
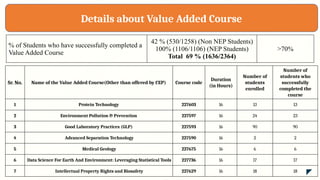
% of Students who have successfully completed a
Value Added Course
42 % (530/1258) (Non NEP Students)
100% (1106/1106) (NEP Students)
Total 69 % (1636/2364)
>70%
26.
Sr. No. Nameof the Value Added Course(Other than offered by CEP) Course code
Duration
(in Hours)
Number of
students
enrolled
Number of
students who
successfully
completed the
course
8 Understanding and Managing Blue Carbon Ecosystems 227680 16 17 17
9 Glaciology 227674 16 2 2
10 Sustainable Campus- Clean, Green and Sustainable Technology 227678 16 12 12
11 Gemmology 227673 16 9 9
12 Groundwater Geophysics 227737 16 7 5
13 Nutrition Care Process 227676 16 25 15
14 Stress Management 227617 16 38 38
15 Nutrition Approches To Manage Emotional Eating And Food Cravings 227677 16 16 11
16 Practical Training in Forensic Instrumentation 227718 16 28 28
17 Forensic Facial Approximation: Unveiling The Faces 227605 16 48 48
18 Biomolecular Techniques 227611 16 54 54
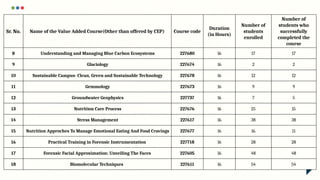
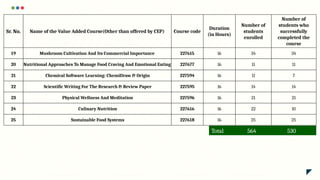
27.
Sr. No. Nameof the Value Added Course(Other than offered by CEP) Course code
Duration
(in Hours)
Number of
students
enrolled
Number of
students who
successfully
completed the
course
19 Mushroom Cultivation And Its Commercial Importance 227615 16 34 34
20 Nutritional Approaches To Manage Food Craving And Emotional Eating 227677 16 11 11
21 Chemical Software Learning: ChemiDraw & Origin 227594 16 11 7
22 Scientific Writing For The Research & Review Paper 227595 16 14 14
23 Physical Wellness And Meditation 227596 16 21 21
24 Culinary Nutrition 227616 16 22 10
25 Sustainable Food Systems 227618 16 25 25
Total 564 530
29.
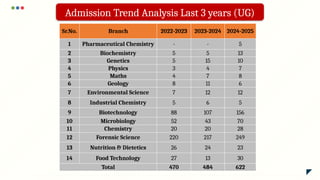
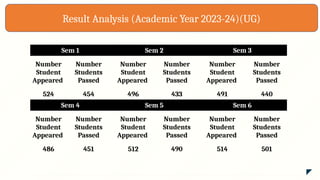
Result Analysis (AcademicYear 2023-24)(UG)
Sem 1 Sem 2 Sem 3
Number
Student
Appeared
Number
Students
Passed
Number
Student
Appeared
Number
Students
Passed
Number
Student
Appeared
Number
Students
Passed
524 454 496 433 491 440
Sem 4 Sem 5 Sem 6
Number
Student
Appeared
Number
Students
Passed
Number
Student
Appeared
Number
Students
Passed
Number
Student
Appeared
Number
Students
Passed
486 451 512 490 514 501
30.
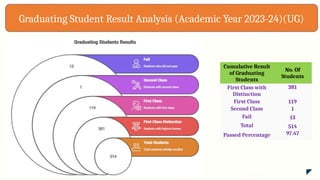
Cumulative Result
of Graduating
Students
No.Of
Students
First Class with
Distinction
381
First Class 119
Second Class 1
Fail 13
Total 514
Passed Percentage 97.47
Graduating Student Result Analysis (Academic Year 2023-24)(UG)
31.
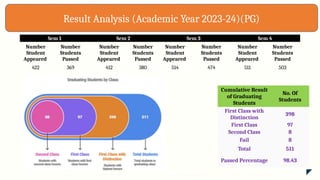
Result Analysis (AcademicYear 2023-24)(PG)
Sem 1 Sem 2 Sem 3 Sem 4
Number
Student
Appeared
Number
Students
Passed
Number
Student
Appeared
Number
Students
Passed
Number
Student
Appeared
Number
Students
Passed
Number
Student
Appeared
Number
Students
Passed
422 369 412 380 514 474 511 503
Cumulative Result
of Graduating
Students
No. Of
Students
First Class with
Distinction
398
First Class 97
Second Class 8
Fail 8
Total 511
Passed Percentage 98.43
32.
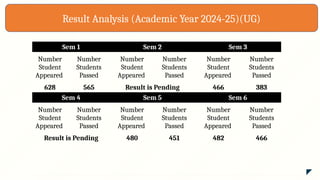
Result Analysis (AcademicYear 2024-25)(UG)
Sem 1 Sem 2 Sem 3
Number
Student
Appeared
Number
Students
Passed
Number
Student
Appeared
Number
Students
Passed
Number
Student
Appeared
Number
Students
Passed
628 565 Result is Pending 466 383
Sem 4 Sem 5 Sem 6
Number
Student
Appeared
Number
Students
Passed
Number
Student
Appeared
Number
Students
Passed
Number
Student
Appeared
Number
Students
Passed
Result is Pending 480 451 482 466
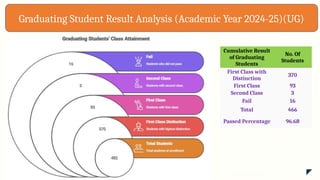
33.
Cumulative Result
of Graduating
Students
No.Of
Students
First Class with
Distinction
370
First Class 93
Second Class 3
Fail 16
Total 466
Passed Percentage 96.68
Graduating Student Result Analysis (Academic Year 2024-25)(UG)
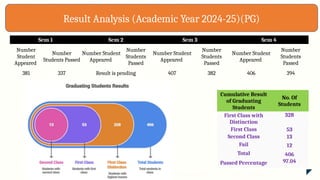
34.
Sem 1 Sem2 Sem 3 Sem 4
Number
Student
Appeared
Number
Students Passed
Number Student
Appeared
Number
Students
Passed
Number Student
Appeared
Number
Students
Passed
Number Student
Appeared
Number
Students
Passed
381 337 Result is pending 407 382 406 394
Result Analysis (Academic Year 2024-25)(PG)
Cumulative Result
of Graduating
Students
No. Of
Students
First Class with
Distinction
328
First Class 53
Second Class 13
Fail 12
Total 406
Passed Percentage 97.04
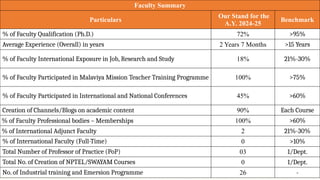
Faculty Summary
Particulars
Our Standfor the
A.Y. 2024-25
Benchmark
% of Faculty Qualification (Ph.D.) 72% >95%
Average Experience (Overall) in years 2 Years 7 Months >15 Years
% of Faculty International Exposure in Job, Research and Study 18% 21%-30%
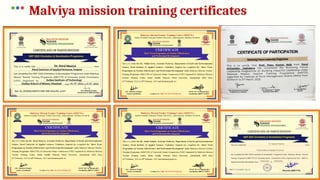
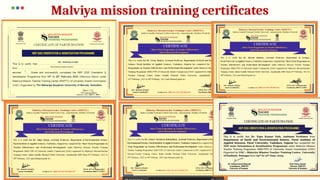
% of Faculty Participated in Malaviya Mission Teacher Training Programme 100% >75%
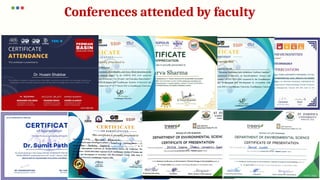
% of Faculty Participated in International and National Conferences 45% >60%
Creation of Channels/Blogs on academic content 90% Each Course
% of Faculty Professional bodies – Memberships 100% >60%
% of International Adjunct Faculty 2 21%-30%
% of International Faculty (Full-Time) 0 >10%
Total Number of Professor of Practice (PoP) 03 1/Dept.
Total No. of Creation of NPTEL/SWAYAM Courses 0 1/Dept.
No. of Industrial training and Emersion Programme 26 -
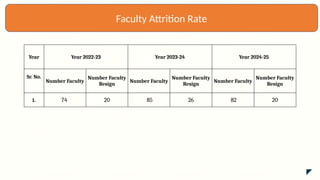
Year Year 2022-23Year 2023-24 Year 2024-25
Sr. No.
Number Faculty
Number Faculty
Resign
Number Faculty
Number Faculty
Resign
Number Faculty
Number Faculty
Resign
1. 74 20 85 26 82 20
Faculty Attrition Rate
45.
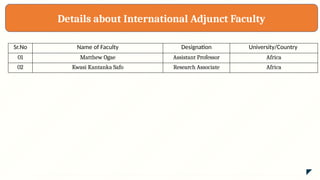
Details about InternationalAdjunct Faculty
Sr.No Name of Faculty Designation University/Country
01 Matthew Ogae Assistant Professor Africa
02 Kwasi Kantanka Safo Research Associate Africa
46.
Details about InternationalFaculty (Full-Time)
Sr.No Name of Faculty Designation University/Country
1 NA NA NA
47.
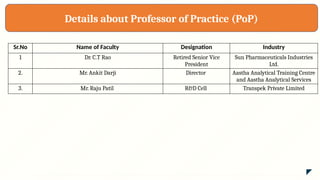
Details about Professorof Practice (PoP)
Sr.No Name of Faculty Designation Industry
1 Dr. C.T Rao Retired Senior Vice
President
Sun Pharmaceuticals Industries
Ltd.
2. Mr. Ankit Darji Director Aastha Analytical Training Centre
and Aastha Analytical Services
3. Mr. Raju Patil R&D Cell Transpek Private Limited
48.
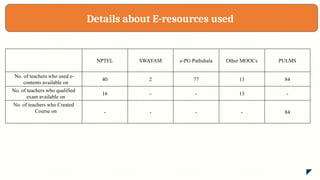
Details about E-resourcesused
NPTEL SWAYAM e-PG Pathshala Other MOOCs PULMS
No. of teachers who used e-
contents available on
40 2 77 13 84
No. of teachers who qualified
exam available on
16 - - 13 -
No. of teachers who Created
Course on - - - - 84
49.
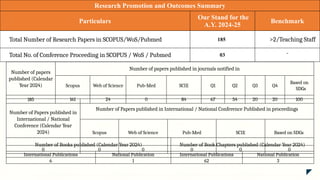
Research Promotion andOutcomes Summary
Particulars
Our Stand for the
A.Y. 2024-25
Benchmark
Total Number of Research Papers in SCOPUS/WoS/Pubmed 185 >2/Teaching Staff
Total No. of Conference Proceeding in SCOPUS / WoS / Pubmed 03 -
Number of papers
published (Calendar
Year 2024)
Number of papers published in journals notified in
Scopus Web of Science Pub-Med SCIE Q1 Q2 Q3 Q4
Based on
SDGs
185 161 24 0 84 67 54 20 20 100
Number of Papers published in
International / National
Conference (Calendar Year
2024)
Number of Papers published in International / National Conference Published in proceedings
Scopus Web of Science Pub-Med SCIE Based on SDGs
0 0 0 0 0 0
Number of Books published (Calendar Year 2024) Number of Book Chapters published (Calendar Year 2024)
International Publications National Publication International Publications National Publication
6 1 62 3
50.
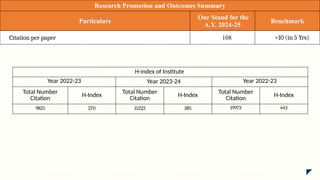
Research Promotion andOutcomes Summary
Particulars
Our Stand for the
A.Y. 2024-25
Benchmark
Citation per paper 108 >10 (in 5 Yrs)
H-index of Institute
Year 2022-23 Year 2023-24 Year 2022-23
Total Number
Citation
H-Index
Total Number
Citation
H-Index
Total Number
Citation
H-Index
9825 270 15222 385 19973 443
51.
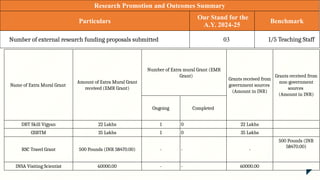
Research Promotion andOutcomes Summary
Particulars
Our Stand for the
A.Y. 2024-25
Benchmark
Number of external research funding proposals submitted 03 1/5 Teaching Staff
Name of Extra Mural Grant
Amount of Extra Mural Grant
received (EMR Grant)
Number of Extra mural Grant (EMR
Grant)
Grants received from
government sources
(Amount in INR)
Grants received from
non-government
sources
(Amount in INR)
Ongoing Completed
DBT Skill Vigyan 22 Lakhs 1 0 22 Lakhs
GSBTM 35 Lakhs 1 0 35 Lakhs
RSC Travel Grant 500 Pounds (INR 58470.00) - - -
500 Pounds (INR
58470.00)
INSA Visiting Scientist 60000.00 - - 60000.00
52.
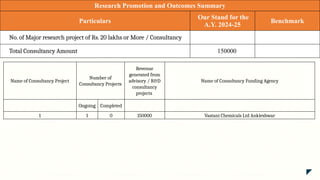
Research Promotion andOutcomes Summary
Particulars
Our Stand for the
A.Y. 2024-25
Benchmark
No. of Major research project of Rs. 20 lakhs or More / Consultancy
Total Consultancy Amount 150000
Name of Consultancy Project
Number of
Consultancy Projects
Revenue
generated from
advisory / R&D
consultancy
projects
Name of Consultancy Funding Agency
Ongoing Completed
1 1 0 150000 Vastani Chemicals Ltd Ankleshwar
53.
Research Promotion andOutcomes Summary
Particulars
Our Stand for the A.Y.
2024-25
Benchmark
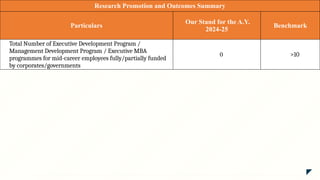
Total Number of Executive Development Program /
Management Development Program / Executive MBA
programmes for mid-career employees fully/partially funded
by corporates/governments
0 >10
54.
Research Promotion andOutcomes Summary
Particulars
Our Stand for the
A.Y. 2024-25
Benchmark
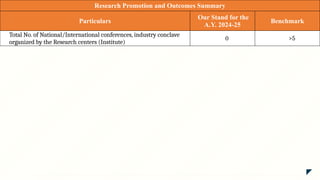
Total No. of National/International conferences, industry conclave
organized by the Research centers (Institute)
0 >5
55.
Research Promotion andOutcomes Summary
Particulars
Our Stand for the
A.Y. 2024-25
Benchmark
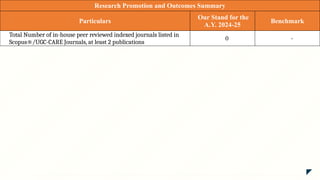
Total Number of in-house peer reviewed indexed journals listed in
Scopus®/UGC-CARE Journals, at least 2 publications
0 -
56.
Research Promotion andOutcomes Summary
Particulars
Our Stand for the
A.Y. 2024-25
Benchmark
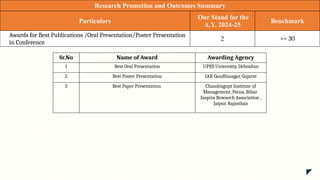
Awards for Best Publications /Oral Presentation/Poster Presentation
in Conference
2 >= 30
Sr.No Name of Award Awarding Agency
1 Best Oral Presentation UPES University, Dehradun
2 Best Poster Presentation IAR Gandhinagar, Gujarat
3 Best Paper Presentation Chandragupt Institute of
Management, Patna, Bihar
Inspira Research Association ,
Jaipur, Rajasthan
57.
Research Promotion andOutcomes Summary
Particulars
Our Stand for the
A.Y. 2024-25
Benchmark
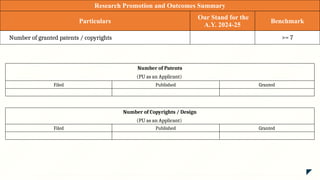
Number of granted patents / copyrights >= 7
Number of Patents
(PU as an Applicant)
Filed Published Granted
Number of Copyrights / Design
(PU as an Applicant)
Filed Published Granted
58.
Research Promotion andOutcomes Summary
Particulars
Our Stand for the
A.Y. 2024-25
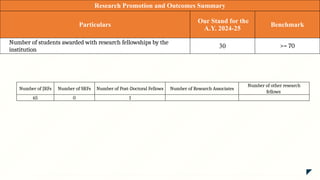
Benchmark
Number of students awarded with research fellowships by the
institution
30 >= 70
Number of JRFs Number of SRFs Number of Post-Doctoral Fellows Number of Research Associates
Number of other research
fellows
65 0 1
59.
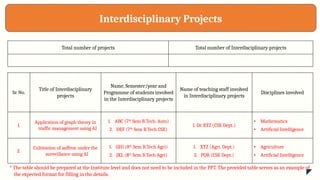
Interdisciplinary Projects
Total numberof projects Total number of Interdisciplinary projects
Sr. No.
Title of Interdisciplinary
projects
Name, Semester/year and
Programme of students involved
in the Interdisciplinary projects
Name of teaching staff involved
in Interdisciplinary projects
Disciplines involved
1.
Application of graph theory in
traffic management using AI
1. ABC (7th
Sem B.Tech. Auto)
2. DEF (7th
Sem B.Tech CSE)
1. Dr. XYZ (CSE Dept.)
• Mathematics
• Artificial Intelligence
2.
Cultivation of saffron under the
surveillance using AI
1. GHI (8th
Sem B.Tech Agri)
2. JKL (8th
Sem B.Tech Agri)
1. XYZ (Agri. Dept.)
2. PQR (CSE Dept.)
• Agriculture
• Artificial Intelligence
* The table should be prepared at the Institute level and does not need to be included in the PPT. The provided table serves as an example of
the expected format for filling in the details.
60.
Multidisciplinary Projects
Total numberof projects Total number of Multidisciplinary projects
Sr. No.
Title of Multidisciplinary
projects
Name, Semester/year and
Programme of students involved
in the Multidisciplinary projects
Name of teaching staff involved
in Multidisciplinary projects
Disciplines involved
1.
Application of graph theory in
traffic management using AI
1. ABC (7th
Sem B.Tech. Auto)
2. DEF (7th
Sem B.Tech CSE)
1. Dr. XYZ (CSE Dept.)
• Mathematics
• Artificial Intelligence
2.
Cultivation of saffron under the
surveillance using AI
1. GHI (8th
Sem B.Tech Agri)
2. JKL (8th
Sem B.Tech Agri)
1. XYZ (Agri. Dept.)
2. PQR (CSE Dept.)
• Agriculture
• Artificial Intelligence
* The table should be prepared at the Institute level and does not need to be included in the PPT. The provided table serves as an example of
the expected format for filling in the details.
61.
Transdisciplinary Projects
Total numberof projects Total number of Transdisciplinary projects
Sr. No.
Title of Transdisciplinary
projects
Name, Semester/year and
Programme of students involved
in the Transdisciplinary projects
Name of teaching staff involved
in Transdisciplinary projects
Disciplines involved
1.
Application of graph theory in
traffic management using AI
1. ABC (7th
Sem B.Tech. Auto)
2. DEF (7th
Sem B.Tech CSE)
1. Dr. XYZ (CSE Dept.)
• Mathematics
• Artificial Intelligence
2.
Cultivation of saffron under the
surveillance using AI
1. GHI (8th
Sem B.Tech Agri)
2. JKL (8th
Sem B.Tech Agri)
1. XYZ (Agri. Dept.)
2. PQR (CSE Dept.)
• Agriculture
• Artificial Intelligence
* The table should be prepared at the Institute level and does not need to be included in the PPT. The provided table serves as an example of
the expected format for filling in the details.
62.
Details about Institute
•Feedback of stakeholder
• Mentor-Mentee allocation, meeting conducted and outcome
• NEP Implementation
• Any additional activities
❖ Add Upto 5 Slides Only
65.
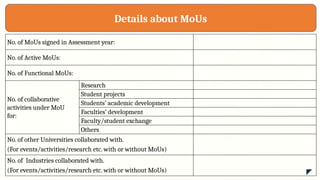
Details about MoUs
No.of MoUs signed in Assessment year:
No. of Active MoUs:
No. of Functional MoUs:
No. of collaborative
activities under MoU
for:
Research
Student projects
Students’ academic development
Faculties’ development
Faculty/student exchange
Others
No. of other Universities collaborated with.
(For events/activities/research etc. with or without MoUs)
No. of Industries collaborated with.
(For events/activities/research etc. with or without MoUs)
67.
Details about MoUs
No.of MoUs signed in Assessment year:
No. of Active MoUs:
No. of Functional MoUs:
No. of collaborative
activities under MoU
for:
Research
Student projects
Students’ academic development
Faculties’ development
Faculty/student exchange
Others
No. of other Universities collaborated with.
(For events/activities/research etc. with or without MoUs)
No. of Industries collaborated with.
(For events/activities/research etc. with or without MoUs)
LET US DOYOUR
PRESENTATION
after
before
after
before
24 HOUR
TURN AROUND
From $11
PER SLIDE
GET STARTED
Go to 24Slides.com/order
to find out more
70.
With a fullteam of
designers, we produce
hundreds of thousands of
slides each year, in dozens of
languages, for thousands of
clients around the world.
Get Started
Go to 24Slides.com/order to find out more
71.
As used by
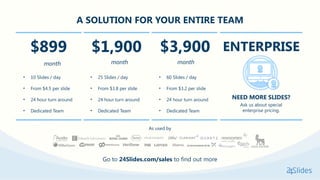
ASOLUTION FOR YOUR ENTIRE TEAM
$899
month
• 10 Slides / day
• From $4.5 per slide
• 24 hour turn around
• Dedicated Team
$1,900
month
• 25 Slides / day
• From $3.8 per slide
• 24 hour turn around
• Dedicated Team
$3,900
month
• 60 Slides / day
• From $3.2 per slide
• 24 hour turn around
• Dedicated Team
ENTERPRISE
NEED MORE SLIDES?
Ask us about special
enterprise pricing.
Go to 24Slides.com/sales to find out more
72.
72
COMPARISON CHARTS
01 0203
Lorem ipsum dolor
Lorem ipsum dolor
Lorem ipsum dolor
Lorem ipsum dolor
Lorem ipsum dolor
Lorem ipsum dolor sit Lorem ipsum dolor sit Lorem ipsum dolor sit
20%
40%
50%
80%
10%
70%
30%
10%
50%
20%
50%
90%
20%
70%
60%
73.
73
90
35
50
40
60
45
80
20
COMPARISON CHARTS
Lorem ipsumdolor sit amet,
consectetur adipiscing elit, sed do
Lorem ipsum dolor sit amet,
consectetur adipiscing elit, sed do
Lorem ipsum dolor sit amet,
consectetur adipiscing elit, sed do
Lorem ipsum dolor sit amet,
consectetur adipiscing elit, sed do
Lorem ipsum dolor sit
amet, consectetur
adipiscing elit, sed do
eiusmod tempor
Lorem ipsum dolor sit
amet, consectetur
adipiscing elit, sed do
eiusmod tempor
74.
74
COMPARISON CHARTS
70% 50%65%
Lorem ipsum dolor sit amet,
consectetur adipiscing elit, sed
• Lorem ipsum dolor sit amet,
consectetur adipiscing elit
• Lorem ipsum dolor sit amet,
consectetur adipiscing elit
• Lorem ipsum dolor sit amet,
consectetur adipiscing elit
Lorem ipsum dolor sit amet,
consectetur adipiscing elit, sed
• Lorem ipsum dolor sit amet,
consectetur adipiscing elit
• Lorem ipsum dolor sit amet,
consectetur adipiscing elit
• Lorem ipsum dolor sit amet,
consectetur adipiscing elit
Lorem ipsum dolor sit amet,
consectetur adipiscing elit, sed
• Lorem ipsum dolor sit amet,
consectetur adipiscing elit
• Lorem ipsum dolor sit amet,
consectetur adipiscing elit
• Lorem ipsum dolor sit amet,
consectetur adipiscing elit
76
COMPARISON CHARTS
70% 45%
Lorem
ipsumdolor
sit amet,
•
Lorem ipsum dolor
sit amet, consectetur
adipiscing elit, sed
•
Lorem ipsum dolor
sit amet, consectetur
adipiscing elit, sed
•
Lorem ipsum dolor
sit amet, consectetur
adipiscing elit, sed
•
Lorem ipsum dolor
sit amet, consectetur
adipiscing elit, sed
• Lorem ipsum dolor
sit amet, consectetur
adipiscing elit, sed
• Lorem ipsum dolor
sit amet, consectetur
adipiscing elit, sed
• Lorem ipsum dolor
sit amet, consectetur
adipiscing elit, sed
• Lorem ipsum dolor
sit amet, consectetur
adipiscing elit, sed
77.
77
COMPARISON CHARTS
10
5
2
8
Axis Title
Axis
Title
5
7
14
2
AxisTitle
Axis
Title
2
9
6
14
Axis Title
Axis
Title
Lorem ipsum Lorem ipsum Lorem ipsum
• Lorem ipsum dolor sit amet,
consectetur adipiscing elit, sed
• Lorem ipsum dolor sit amet,
consectetur adipiscing elit, sed
• Lorem ipsum dolor sit amet,
consectetur adipiscing elit, sed
• Lorem ipsum dolor sit amet,
consectetur adipiscing elit, sed
• Lorem ipsum dolor sit amet,
consectetur adipiscing elit, sed
• Lorem ipsum dolor sit amet,
consectetur adipiscing elit, sed
• Lorem ipsum dolor sit amet,
consectetur adipiscing elit, sed
• Lorem ipsum dolor sit amet,
consectetur adipiscing elit, sed
• Lorem ipsum dolor sit amet,
consectetur adipiscing elit, sed
78.
78
COMPARISON CHARTS
70%
30%
Lorem ipsumdolor
sit amet,
consectetur
Lorem ipsum
dolor sit
amet,
consectetur
• Lorem ipsum dolor
sit amet, consectetur
adipiscing elit.
Quisque pharetra mi
nec ultrices lacinia.
• Lorem ipsum dolor
sit amet, consectetur
adipiscing elit.
Quisque pharetra mi
nec ultrices lacinia.
• Lorem ipsum dolor
sit amet, consectetur
adipiscing elit.
Quisque pharetra mi
nec ultrices lacinia.
• Lorem ipsum dolor
sit amet, consectetur
adipiscing elit.
Quisque pharetra mi
nec ultrices lacinia.
• Lorem ipsum dolor
sit amet, consectetur
adipiscing elit.
Quisque pharetra mi
nec ultrices lacinia.
• Lorem ipsum dolor
sit amet, consectetur
adipiscing elit.
Quisque pharetra mi
nec ultrices lacinia.
79.
79
COMPARISON CHARTS
Lorem ipsumdolor sit
amet, consectetur
adipiscing elit, sed do
eiusmod tempor
incididunt ut labore et
dolore magna aliqua.
01
Lorem ipsum dolor sit
amet, consectetur
adipiscing elit, sed do
eiusmod tempor
incididunt ut labore et
dolore magna aliqua.
02
Lorem ipsum dolor sit
amet, consectetur
adipiscing elit, sed do
eiusmod tempor
incididunt ut labore et
dolore magna aliqua.
03
Lorem ipsum dolor sit
amet, consectetur
adipiscing elit, sed do
eiusmod tempor
incididunt ut labore et
dolore magna aliqua.
04
Lorem ipsum dolor sit
amet, consectetur
adipiscing elit, sed do
eiusmod tempor
incididunt ut labore et
dolore magna aliqua.
01
Lorem ipsum dolor sit
amet, consectetur
adipiscing elit, sed do
eiusmod tempor
incididunt ut labore et
dolore magna aliqua.
02
Lorem ipsum dolor sit
amet, consectetur
adipiscing elit, sed do
eiusmod tempor
incididunt ut labore et
dolore magna aliqua.
03
Lorem ipsum dolor sit
amet, consectetur
adipiscing elit, sed do
eiusmod tempor
incididunt ut labore et
dolore magna aliqua.
04
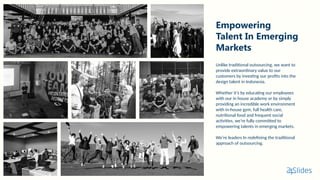
Empowering
Talent In Emerging
Markets
Unliketraditional outsourcing, we want to
provide extraordinary value to our
customers by investing our profits into the
design talent in Indonesia.
Whether it’s by educating our employees
with our in house academy or by simply
providing an incredible work environment
with in-house gym, full health care,
nutritional food and frequent social
activities, we’re fully committed to
empowering talents in emerging markets.
We’re leaders In redefining the traditional
approach of outsourcing.