Common statistical tests can be used for correlation, comparison of means, regression, or non-parametric analysis. Correlational tests measure the strength of association between variables, comparison of means tests examine differences between group averages, regression assesses how one variable predicts another, and non-parametric tests are used when data does not meet assumptions for standard tests. Specific tests mentioned include the Pearson, Spearman, and chi-square for correlation, paired t-test, independent t-test and ANOVA for means, simple and multiple regression, and the Wilcoxon rank-sum, Wilcoxon sign-rank, and sign tests for non-parametric analysis.
Explains how to select a statistical test suitable for your hypothesis. Suggests points to consider before deciding about a test. Gives a list of commonly used parametric and non-parametric tests with their purposes of use.
this activity is designed for you to explore the continuum of an a.docxhowardh5
this activity is designed for you to explore the continuum of an addictive behavior of your choice.
Addictive behavior appears in stages. The earliest stage is non-use, which finally leads up to out-of-control dependence. The stages in between are important to identify, as it is much easier to correct an early-stage issue as opposed to a late-stage problem.
After reviewing the module readings and tasks, use the module notes as a reference and alcohol or substance abuse addiction as an example to identify the various levels of addiction.
You may choose to develop a time line identifying the stages or develop a written essay (no more than 500 words in Word format) to describe the escalation of addictive behaviors.
You are to include at least two references from academic sources that you have researched on this topic in the Excelsior College Library and use appropriate citations in American Psychological Association (APA) style.
You cannot just do a Google search for the topic! Academic sources are required. You may use Google Scholar or other libraries.
Chapter 13
Qualitative Data Analysis
1
Process of Qualitative Data Analysis
Preparing the Qualitative Data
Transform the data into readable text
Check for and resolve transcription errors
Manage the data
Organize by attribute coding
Two Separate Processes
5
Coding: Involves labeling and breaking down the data to find:
Patterns
Themes
Interpretation: Giving meaning to the identified patterns and themes
Coding
Starts with identifying the unit of analysis
Coding categories may reflect realms of meaning or different activities.
Coding categories can be theoretically-based or inductively created emerging from the data.
Use of Analytical Memos
7
Analytical memos help researchers w/ process of breaking down the data
Personal reflections on the research experience, methodological issues, or patterns in the data
Comes in 3 varieties:
Code notes
Operational notes
Theoretical notes
Data Displays
Taxonomy: system of ordered classification
Data matrix: individuals or other units represent columns and coding categories represent rows
Typologies: representation of findings based on the interrelationship between two or more ideas, concepts, or variables
Flow charts: diagrams that display processes
Taxonomy of Survival Strategies
Data Matrix: Homeless Individuals by Dimensions
Drawing and Evaluating Conclusions
Conclusions may result in:
Rich descriptions
Identification of themes
Inferences about patterns and concepts
Theoretical propositions
Evaluation of the data can occur by:
Comparing notes among observers
Using multiple sources of data
Examining exceptions to the data patterns
Member checking
Variations in Qualitative Data Analysis: Grounded Theory
Objective is to develop theory from data
Emphasizes people’s actions and voices as the main sources of d.
Correlational AnalysisAccording to Gogtay et al (2017) c.docxmelvinjrobinson2199
Correlational Analysis
According to Gogtay
et al
(2017) correlational analysis is a data analysis method used to show the relationship between two or more quantitative variables based on the assumption that there is a relationship between the variables. This analysis gives the correlation coefficient whose value can be either +1 (to show positive correlation), -1 (to indicate a negative correlation), or 0 (to show that there is no correlation between the variables). Correlation analysis only shows that the data is associated and should not be confused with causation thus cannot be used for prediction in data analysis.
There are two correlation analysis tests;
Pearson correlation
Spearman’s correlation test.
Pearson Correlation Analysis
Pearson correlation measures the strength and direction between two variables.
It’s based on the assumptions that;
The relationship between the variables is linear
The variables are independent of each other
The variables are distributed normally.
Spearman’s correlation Analysis
It's a non-parametric analysis that is used to indicate the strength and direction of a monotonic association between two ranked variables. It’s used when measuring the relationship between two ordinal variables. The result of the analysis is the Spearman’s correlation coefficient (rs) the coefficient can be -1(negative correlation), 0( no correlation between the variables), or +1( a positive correlation).
Assumptions of a Spearman’s correlation test
A random sample
A monotonic relationship between the variables
Variables are at least ordinal
Data contain paired samples
Independence of observations.
Discussion
Correlation coefficients are used to show the strength and direction between pairs of continuous data. When the data is normally distributed Pearson’s coefficient is used and when the data is non-parametric Spearman’s coefficient is used. The study sample was normally distributed and analyzed using Spearman’s correlation instead of the Pearson correlation thus it was not the correct level of analyzing the data. Spearman’s correlation is mostly preferred for non-parametric data. As explained above, correlation is a way of measuring the extent to which two variables are related, i.e. changes in one variable is accompanied by changes in the other variable. Thus in correlational analysis, the variables being analyzed are dependent on each other (change in one variable is associated with changes in the other variable).
Association analysis
Association analysis is a data analysis method used to identify data items that often appear together. It is used for identifying dependent and associated data variables in a sample. There are three important terms (metrics) used to determine the strength of the analysis, these are; Support, Confidence, and Lift.
In conclusion, correlation analysis is used when there exists a linear relationship between the different data variables being analyzed. Association anal.
Inferential statistics are techniques that allow us to use these samples to make generalizations about the populations from which the samples were drawn. ... The methods of inferential statistics are (1) the estimation of parameter(s) and (2) testing of statistical hypotheses.
Inferential Statistics- Dr Ryan Thomas WilliamsRyan Williams
Chi-square test – tests whether two categorical variables are associated
Bivariate Correlation – to what extent are two variables related
Linear Regression- how well does a set of variables ‘predict’ the value of another (dichotomous) variable
ANOVA- check if the means of more than two groups are significantly different from each other
T-test- statistical significance in means of two groups
Questions concerning means
A. when the question involves only one or two means or making only one comparison , a t test will be used.
e.g. Estimation of a population mean ?, testing a hypothesis about population mean?, comparing two sample means with each other .
B. if n > 100 or if the standard deviation of the population is known a Z test may be used.
2. Questions concerning Variances:
C. Are the variances in two samples significantly different.
3. Questions concerning Association:
D. To what degree are two variables correlated?.
the various forms of chi-square tests
the Fisher Exact Probability test
the Mann-Whitney Test,
the Wilcoxon Signed-Rank Test,
the Kruskal-Wallis Test,
the Friedman Test.
McNemar test
Commonly used Statistics in Medical Research HandoutPat Barlow
We found this handout to be incredibly useful as a guide and resource for non-statistical professionals to make quick decisions about statistical methods. The handout accompanies the Commonly Used Statistics in Medical Research Part I Presentation
Skye Residences | Extended Stay Residences Near Toronto Airportmarketingjdass
Experience unparalleled EXTENDED STAY and comfort at Skye Residences located just minutes from Toronto Airport. Discover sophisticated accommodations tailored for discerning travelers.
Website Link :
https://skyeresidences.com/
https://skyeresidences.com/about-us/
https://skyeresidences.com/gallery/
https://skyeresidences.com/rooms/
https://skyeresidences.com/near-by-attractions/
https://skyeresidences.com/commute/
https://skyeresidences.com/contact/
https://skyeresidences.com/queen-suite-with-sofa-bed/
https://skyeresidences.com/queen-suite-with-sofa-bed-and-balcony/
https://skyeresidences.com/queen-suite-with-sofa-bed-accessible/
https://skyeresidences.com/2-bedroom-deluxe-queen-suite-with-sofa-bed/
https://skyeresidences.com/2-bedroom-deluxe-king-queen-suite-with-sofa-bed/
https://skyeresidences.com/2-bedroom-deluxe-queen-suite-with-sofa-bed-accessible/
#Skye Residences Etobicoke, #Skye Residences Near Toronto Airport, #Skye Residences Toronto, #Skye Hotel Toronto, #Skye Hotel Near Toronto Airport, #Hotel Near Toronto Airport, #Near Toronto Airport Accommodation, #Suites Near Toronto Airport, #Etobicoke Suites Near Airport, #Hotel Near Toronto Pearson International Airport, #Toronto Airport Suite Rentals, #Pearson Airport Hotel Suites
RMD24 | Debunking the non-endemic revenue myth Marvin Vacquier Droop | First ...BBPMedia1
Marvin neemt je in deze presentatie mee in de voordelen van non-endemic advertising op retail media netwerken. Hij brengt ook de uitdagingen in beeld die de markt op dit moment heeft op het gebied van retail media voor niet-leveranciers.
Retail media wordt gezien als het nieuwe advertising-medium en ook mediabureaus richten massaal retail media-afdelingen op. Merken die niet in de betreffende winkel liggen staan ook nog niet in de rij om op de retail media netwerken te adverteren. Marvin belicht de uitdagingen die er zijn om echt aansluiting te vinden op die markt van non-endemic advertising.
Premium MEAN Stack Development Solutions for Modern BusinessesSynapseIndia
Stay ahead of the curve with our premium MEAN Stack Development Solutions. Our expert developers utilize MongoDB, Express.js, AngularJS, and Node.js to create modern and responsive web applications. Trust us for cutting-edge solutions that drive your business growth and success.
Know more: https://www.synapseindia.com/technology/mean-stack-development-company.html
Personal Brand Statement:
As an Army veteran dedicated to lifelong learning, I bring a disciplined, strategic mindset to my pursuits. I am constantly expanding my knowledge to innovate and lead effectively. My journey is driven by a commitment to excellence, and to make a meaningful impact in the world.
Cracking the Workplace Discipline Code Main.pptxWorkforce Group
Cultivating and maintaining discipline within teams is a critical differentiator for successful organisations.
Forward-thinking leaders and business managers understand the impact that discipline has on organisational success. A disciplined workforce operates with clarity, focus, and a shared understanding of expectations, ultimately driving better results, optimising productivity, and facilitating seamless collaboration.
Although discipline is not a one-size-fits-all approach, it can help create a work environment that encourages personal growth and accountability rather than solely relying on punitive measures.
In this deck, you will learn the significance of workplace discipline for organisational success. You’ll also learn
• Four (4) workplace discipline methods you should consider
• The best and most practical approach to implementing workplace discipline.
• Three (3) key tips to maintain a disciplined workplace.
Attending a job Interview for B1 and B2 Englsih learnersErika906060
It is a sample of an interview for a business english class for pre-intermediate and intermediate english students with emphasis on the speking ability.
What are the main advantages of using HR recruiter services.pdfHumanResourceDimensi1
HR recruiter services offer top talents to companies according to their specific needs. They handle all recruitment tasks from job posting to onboarding and help companies concentrate on their business growth. With their expertise and years of experience, they streamline the hiring process and save time and resources for the company.
Kseniya Leshchenko: Shared development support service model as the way to ma...Lviv Startup Club
Kseniya Leshchenko: Shared development support service model as the way to make small projects with small budgets profitable for the company (UA)
Kyiv PMDay 2024 Summer
Website – www.pmday.org
Youtube – https://www.youtube.com/startuplviv
FB – https://www.facebook.com/pmdayconference
LA HUG - Video Testimonials with Chynna Morgan - June 2024Lital Barkan
Have you ever heard that user-generated content or video testimonials can take your brand to the next level? We will explore how you can effectively use video testimonials to leverage and boost your sales, content strategy, and increase your CRM data.🤯
We will dig deeper into:
1. How to capture video testimonials that convert from your audience 🎥
2. How to leverage your testimonials to boost your sales 💲
3. How you can capture more CRM data to understand your audience better through video testimonials. 📊
Tata Group Dials Taiwan for Its Chipmaking Ambition in Gujarat’s DholeraAvirahi City Dholera
The Tata Group, a titan of Indian industry, is making waves with its advanced talks with Taiwanese chipmakers Powerchip Semiconductor Manufacturing Corporation (PSMC) and UMC Group. The goal? Establishing a cutting-edge semiconductor fabrication unit (fab) in Dholera, Gujarat. This isn’t just any project; it’s a potential game changer for India’s chipmaking aspirations and a boon for investors seeking promising residential projects in dholera sir.
Visit : https://www.avirahi.com/blog/tata-group-dials-taiwan-for-its-chipmaking-ambition-in-gujarats-dholera/
RMD24 | Retail media: hoe zet je dit in als je geen AH of Unilever bent? Heid...BBPMedia1
Grote partijen zijn al een tijdje onderweg met retail media. Ondertussen worden in dit domein ook de kansen zichtbaar voor andere spelers in de markt. Maar met die kansen ontstaan ook vragen: Zelf retail media worden of erop adverteren? In welke fase van de funnel past het en hoe integreer je het in een mediaplan? Wat is nu precies het verschil met marketplaces en Programmatic ads? In dit half uur beslechten we de dilemma's en krijg je antwoorden op wanneer het voor jou tijd is om de volgende stap te zetten.
VAT Registration Outlined In UAE: Benefits and Requirementsuae taxgpt
Vat Registration is a legal obligation for businesses meeting the threshold requirement, helping companies avoid fines and ramifications. Contact now!
https://viralsocialtrends.com/vat-registration-outlined-in-uae/
Unveiling the Secrets How Does Generative AI Work.pdfSam H
At its core, generative artificial intelligence relies on the concept of generative models, which serve as engines that churn out entirely new data resembling their training data. It is like a sculptor who has studied so many forms found in nature and then uses this knowledge to create sculptures from his imagination that have never been seen before anywhere else. If taken to cyberspace, gans work almost the same way.
Unveiling the Secrets How Does Generative AI Work.pdf
Common Statistical Tests.pdf
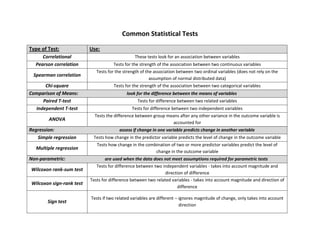
1. Common Statistical Tests
Type of Test: Use:
Correlational These tests look for an association between variables
Pearson correlation Tests for the strength of the association between two continuous variables
Spearman correlation
Tests for the strength of the association between two ordinal variables (does not rely on the
assumption of normal distributed data)
Chi-square Tests for the strength of the association between two categorical variables
Comparison of Means: look for the difference between the means of variables
Paired T-test Tests for difference between two related variables
Independent T-test Tests for difference between two independent variables
ANOVA
Tests the difference between group means after any other variance in the outcome variable is
accounted for
Regression: assess if change in one variable predicts change in another variable
Simple regression Tests how change in the predictor variable predicts the level of change in the outcome variable
Multiple regression
Tests how change in the combination of two or more predictor variables predict the level of
change in the outcome variable
Non-parametric: are used when the data does not meet assumptions required for parametric tests
Wilcoxon rank-sum test
Tests for difference between two independent variables - takes into account magnitude and
direction of difference
Wilcoxon sign-rank test
Tests for difference between two related variables - takes into account magnitude and direction of
difference
Sign test
Tests if two related variables are different – ignores magnitude of change, only takes into account
direction