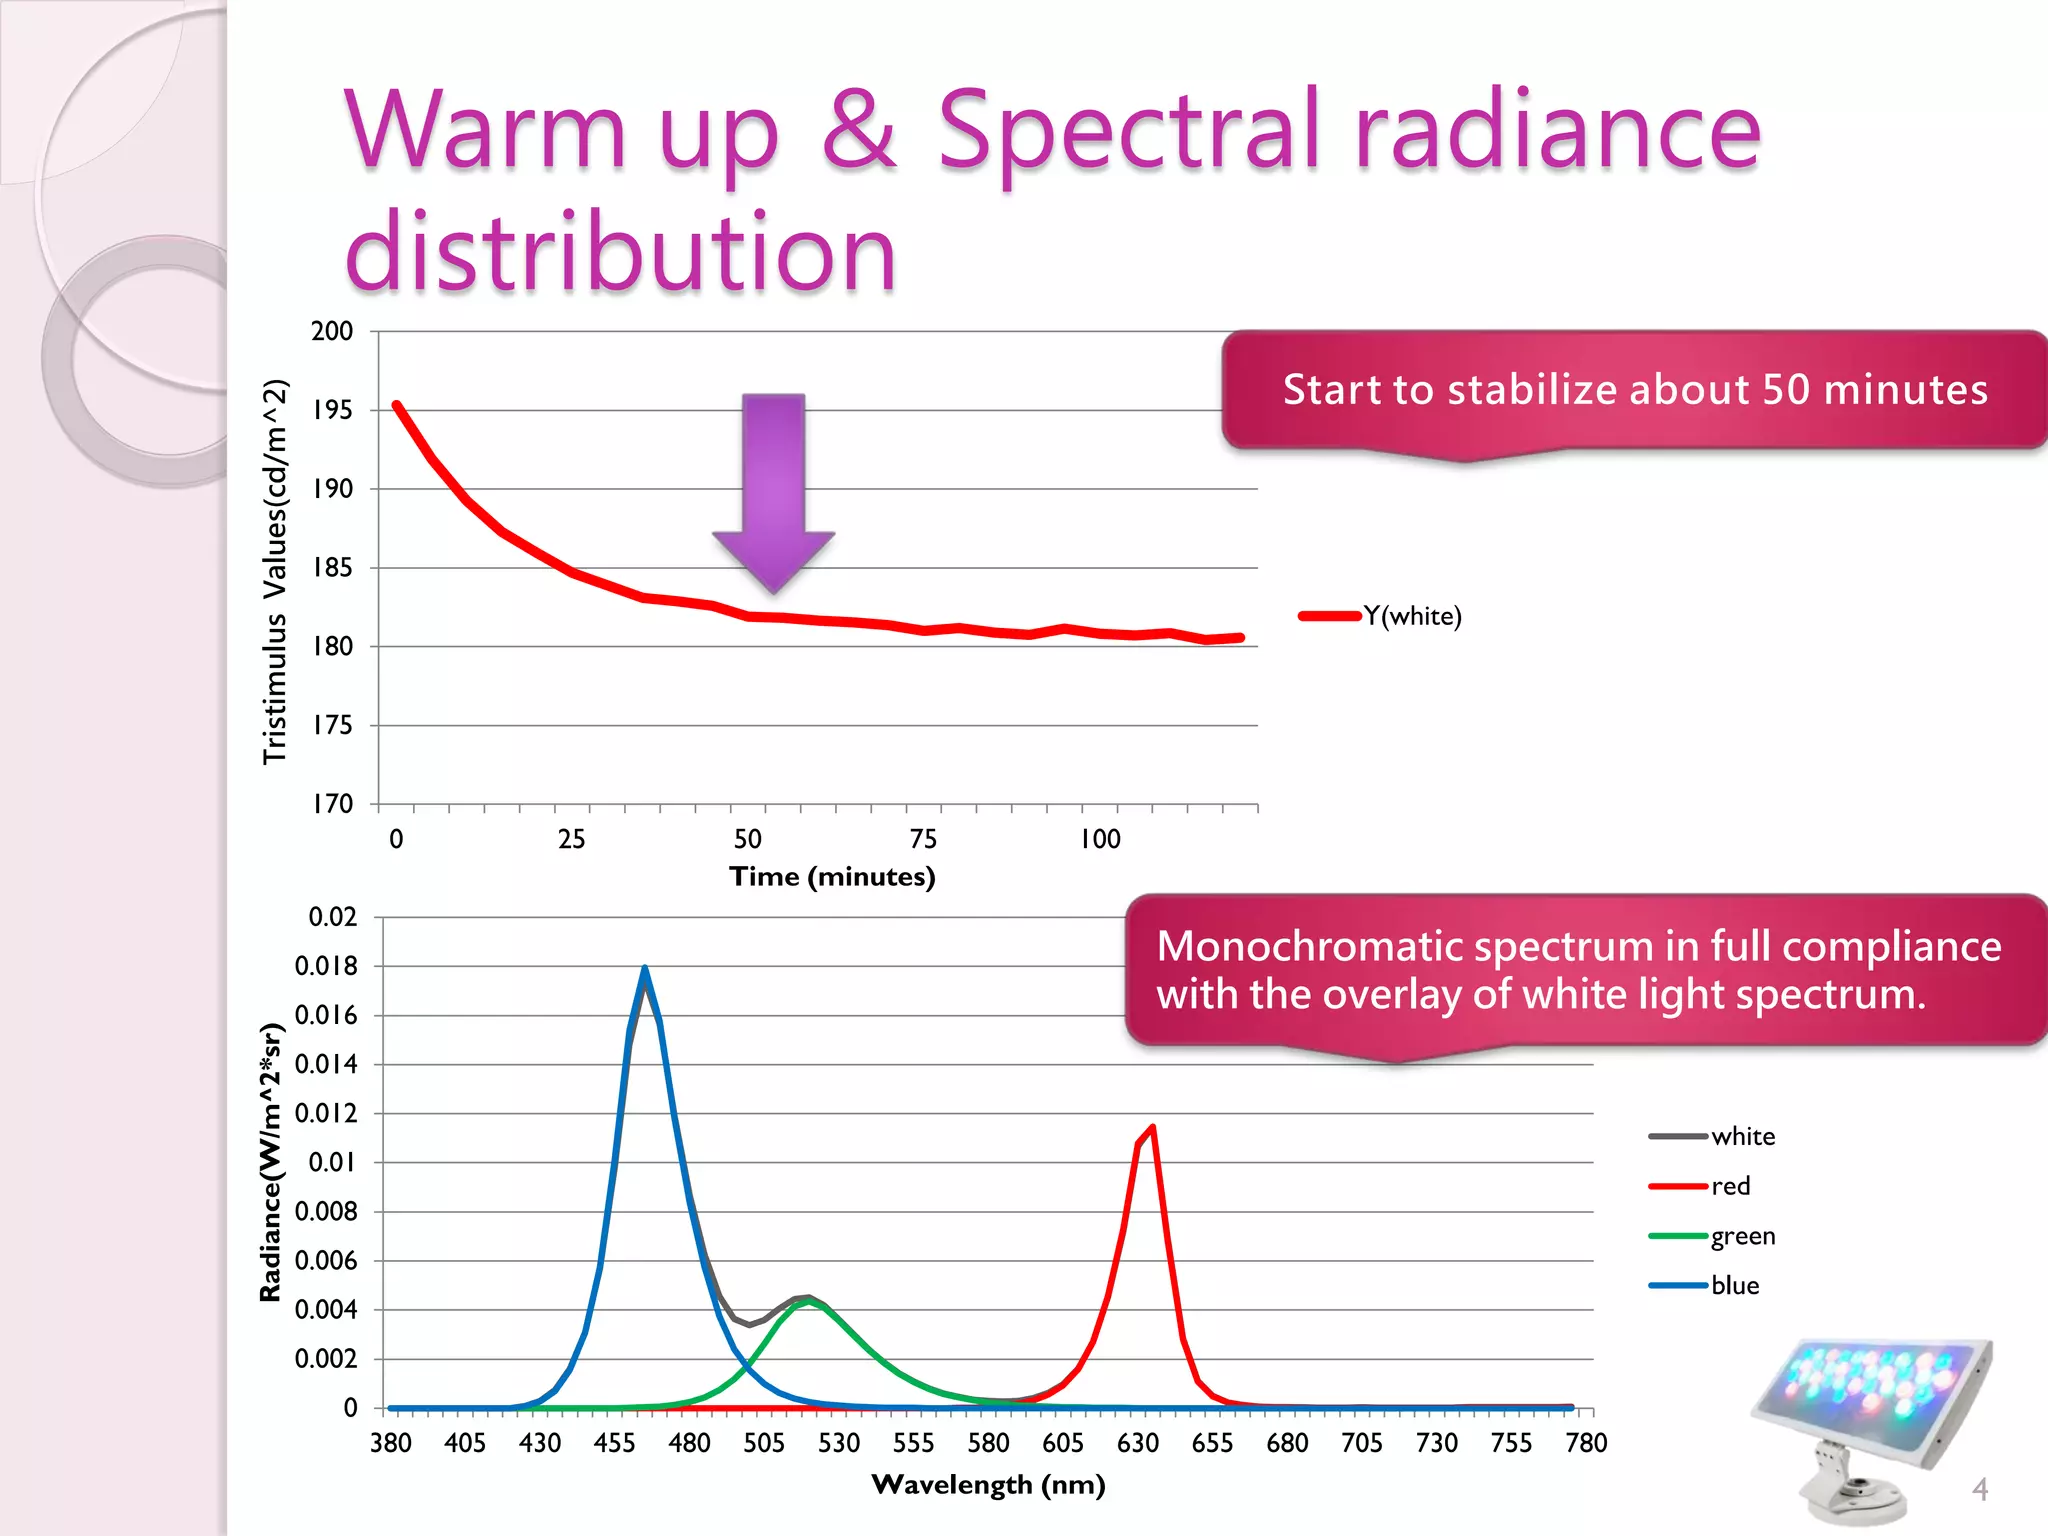
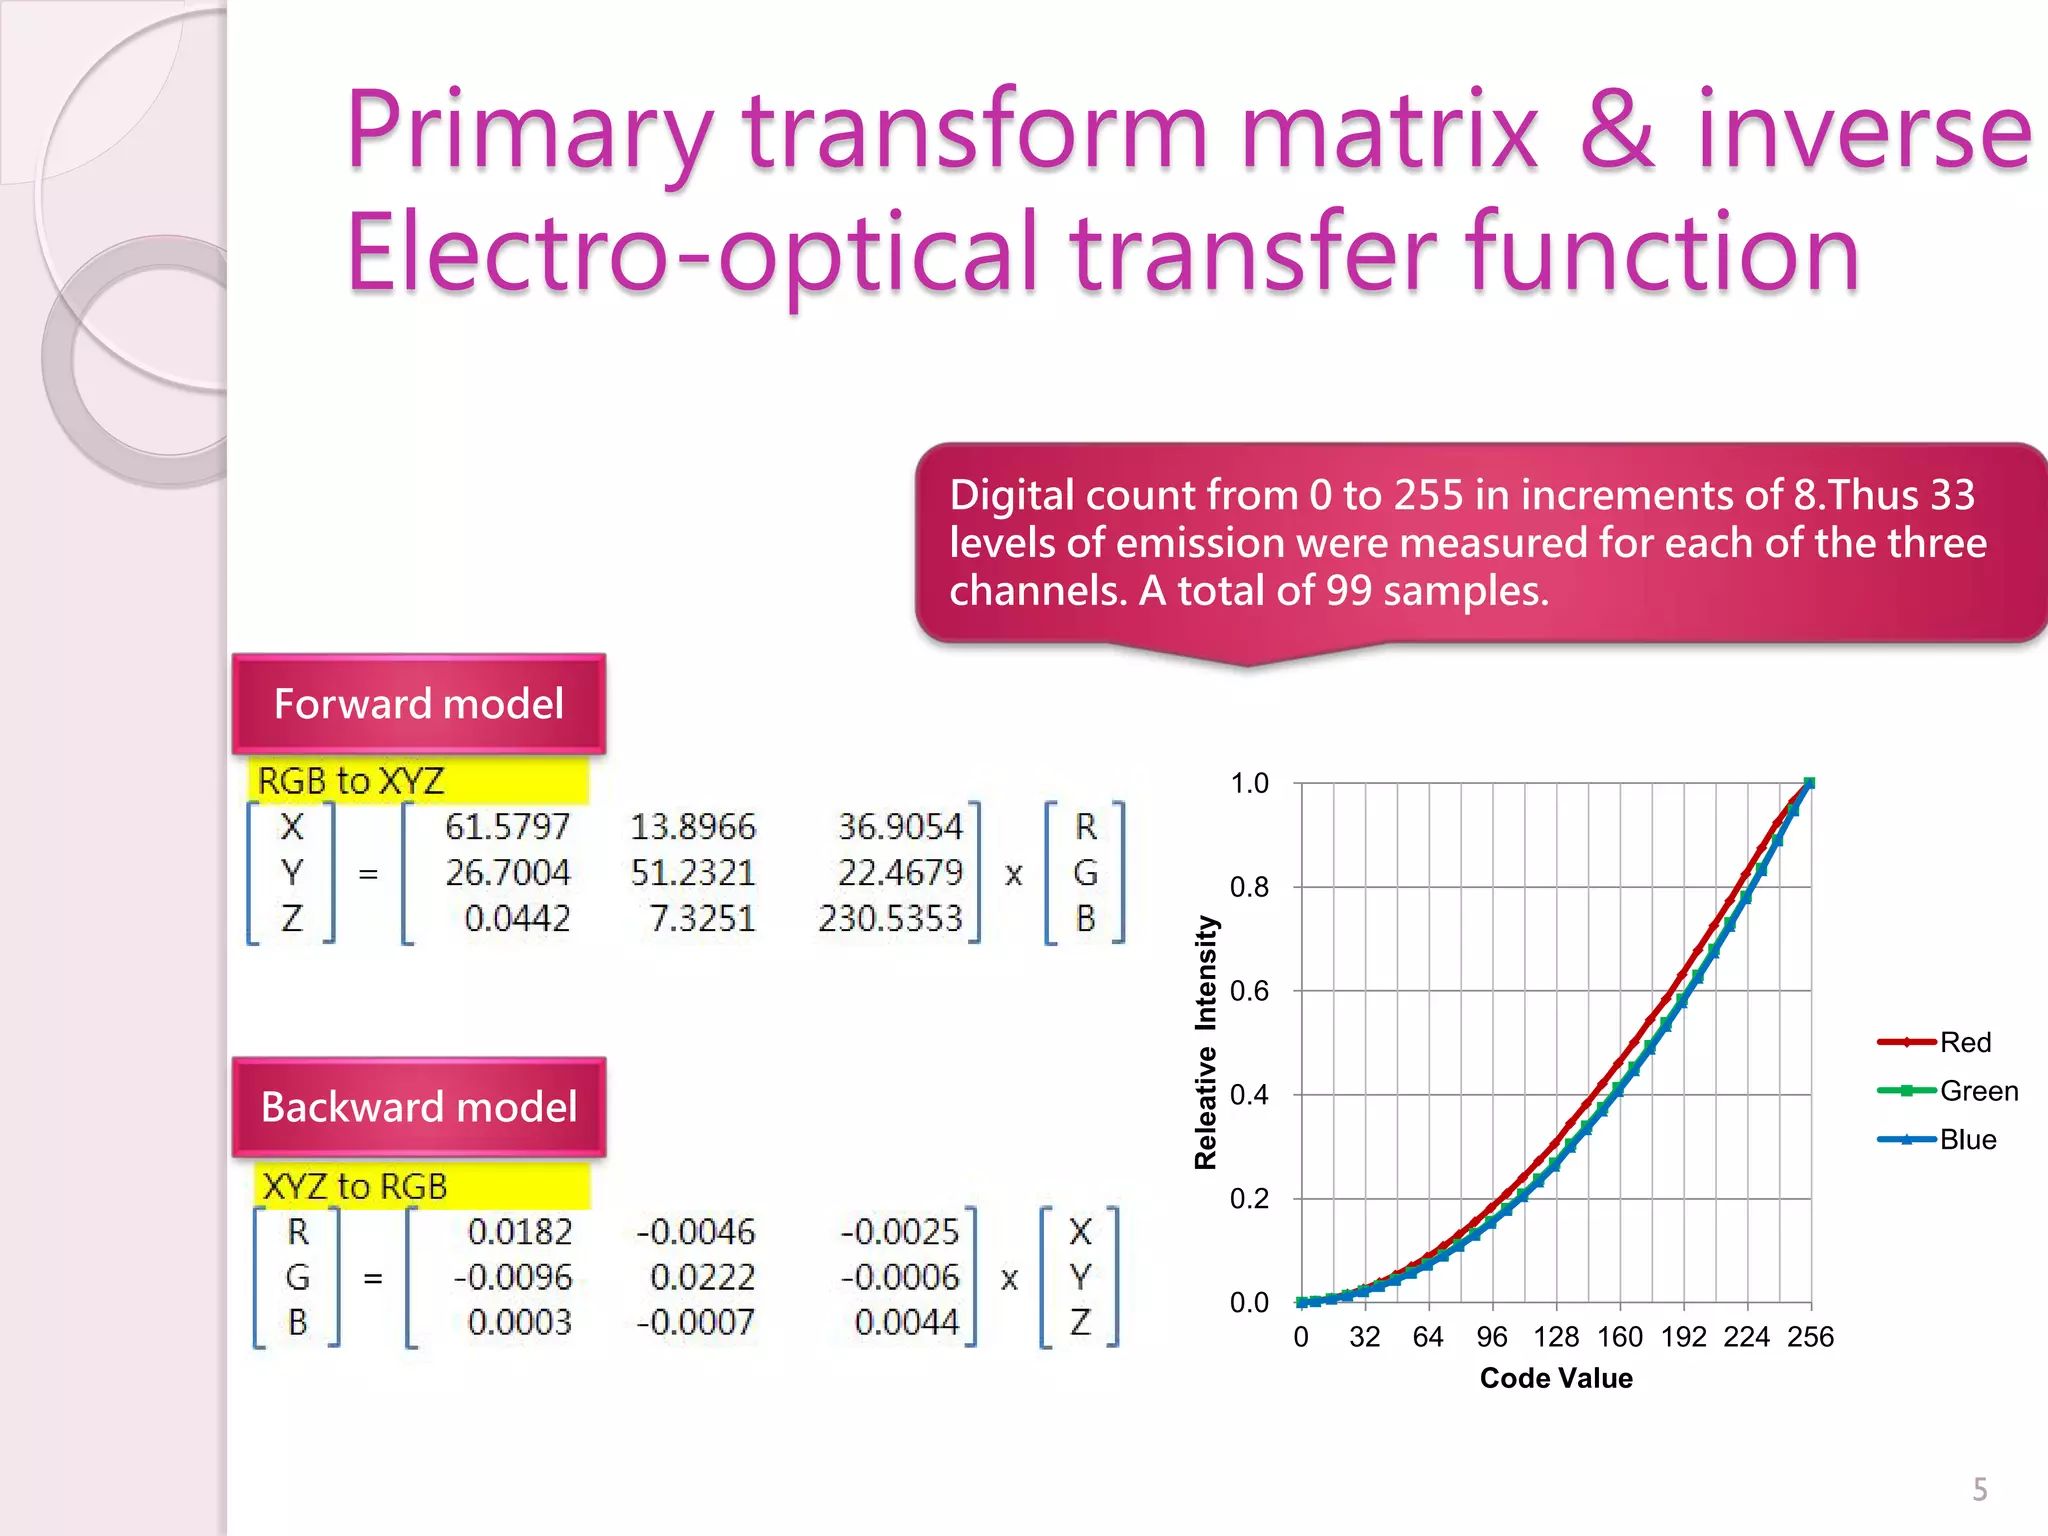
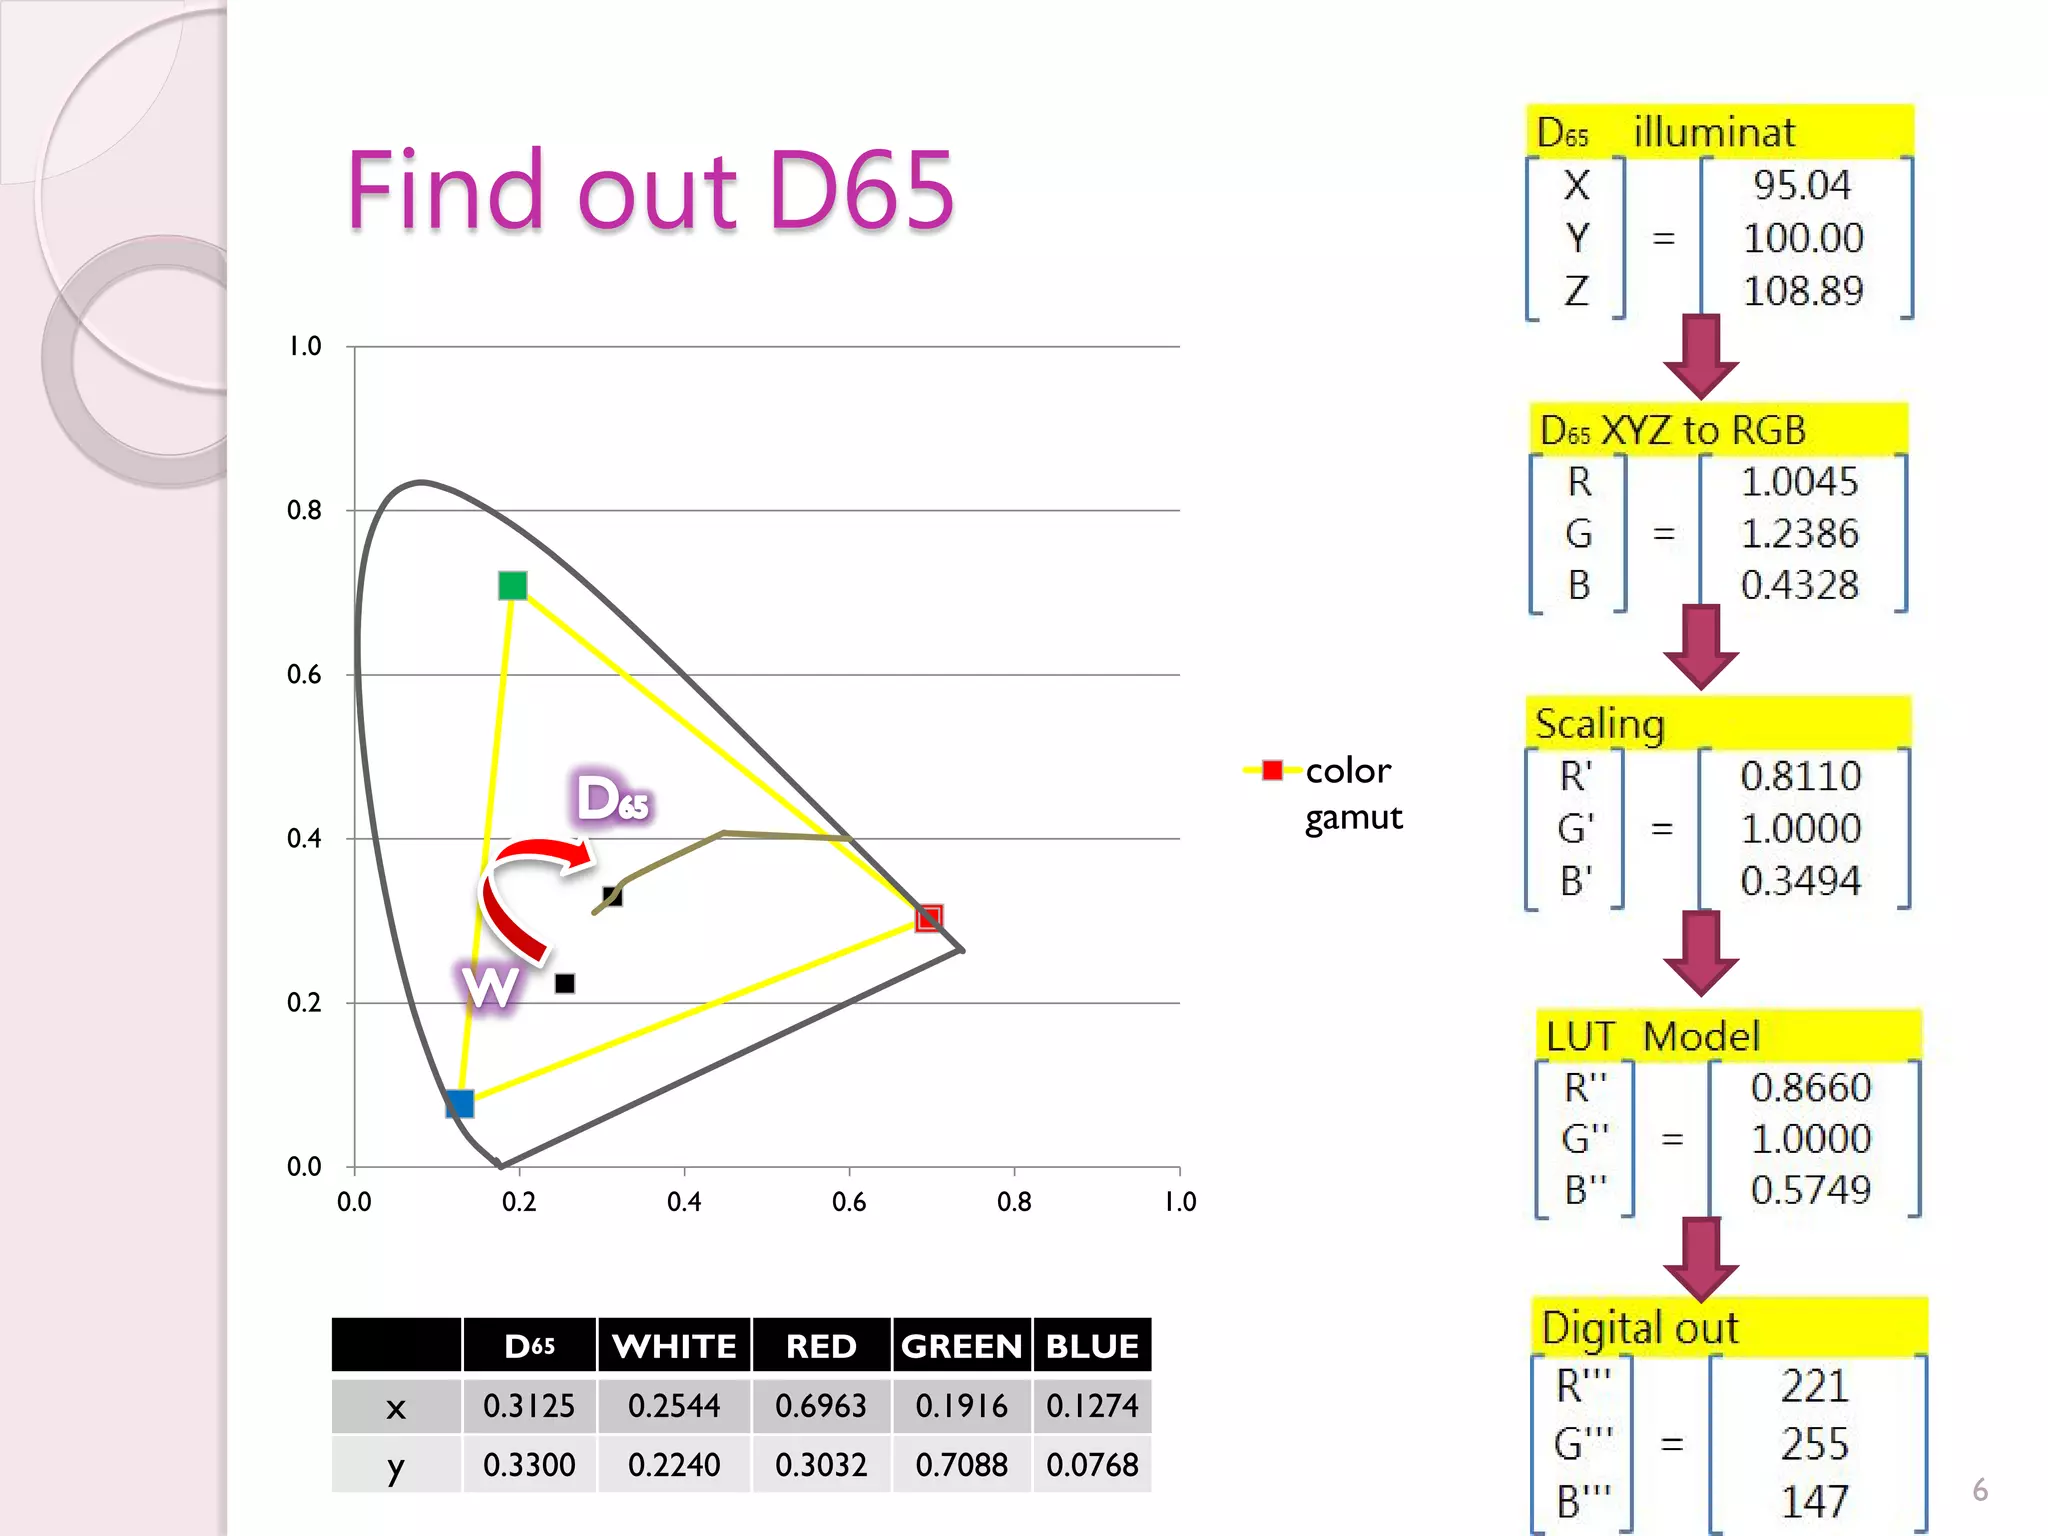
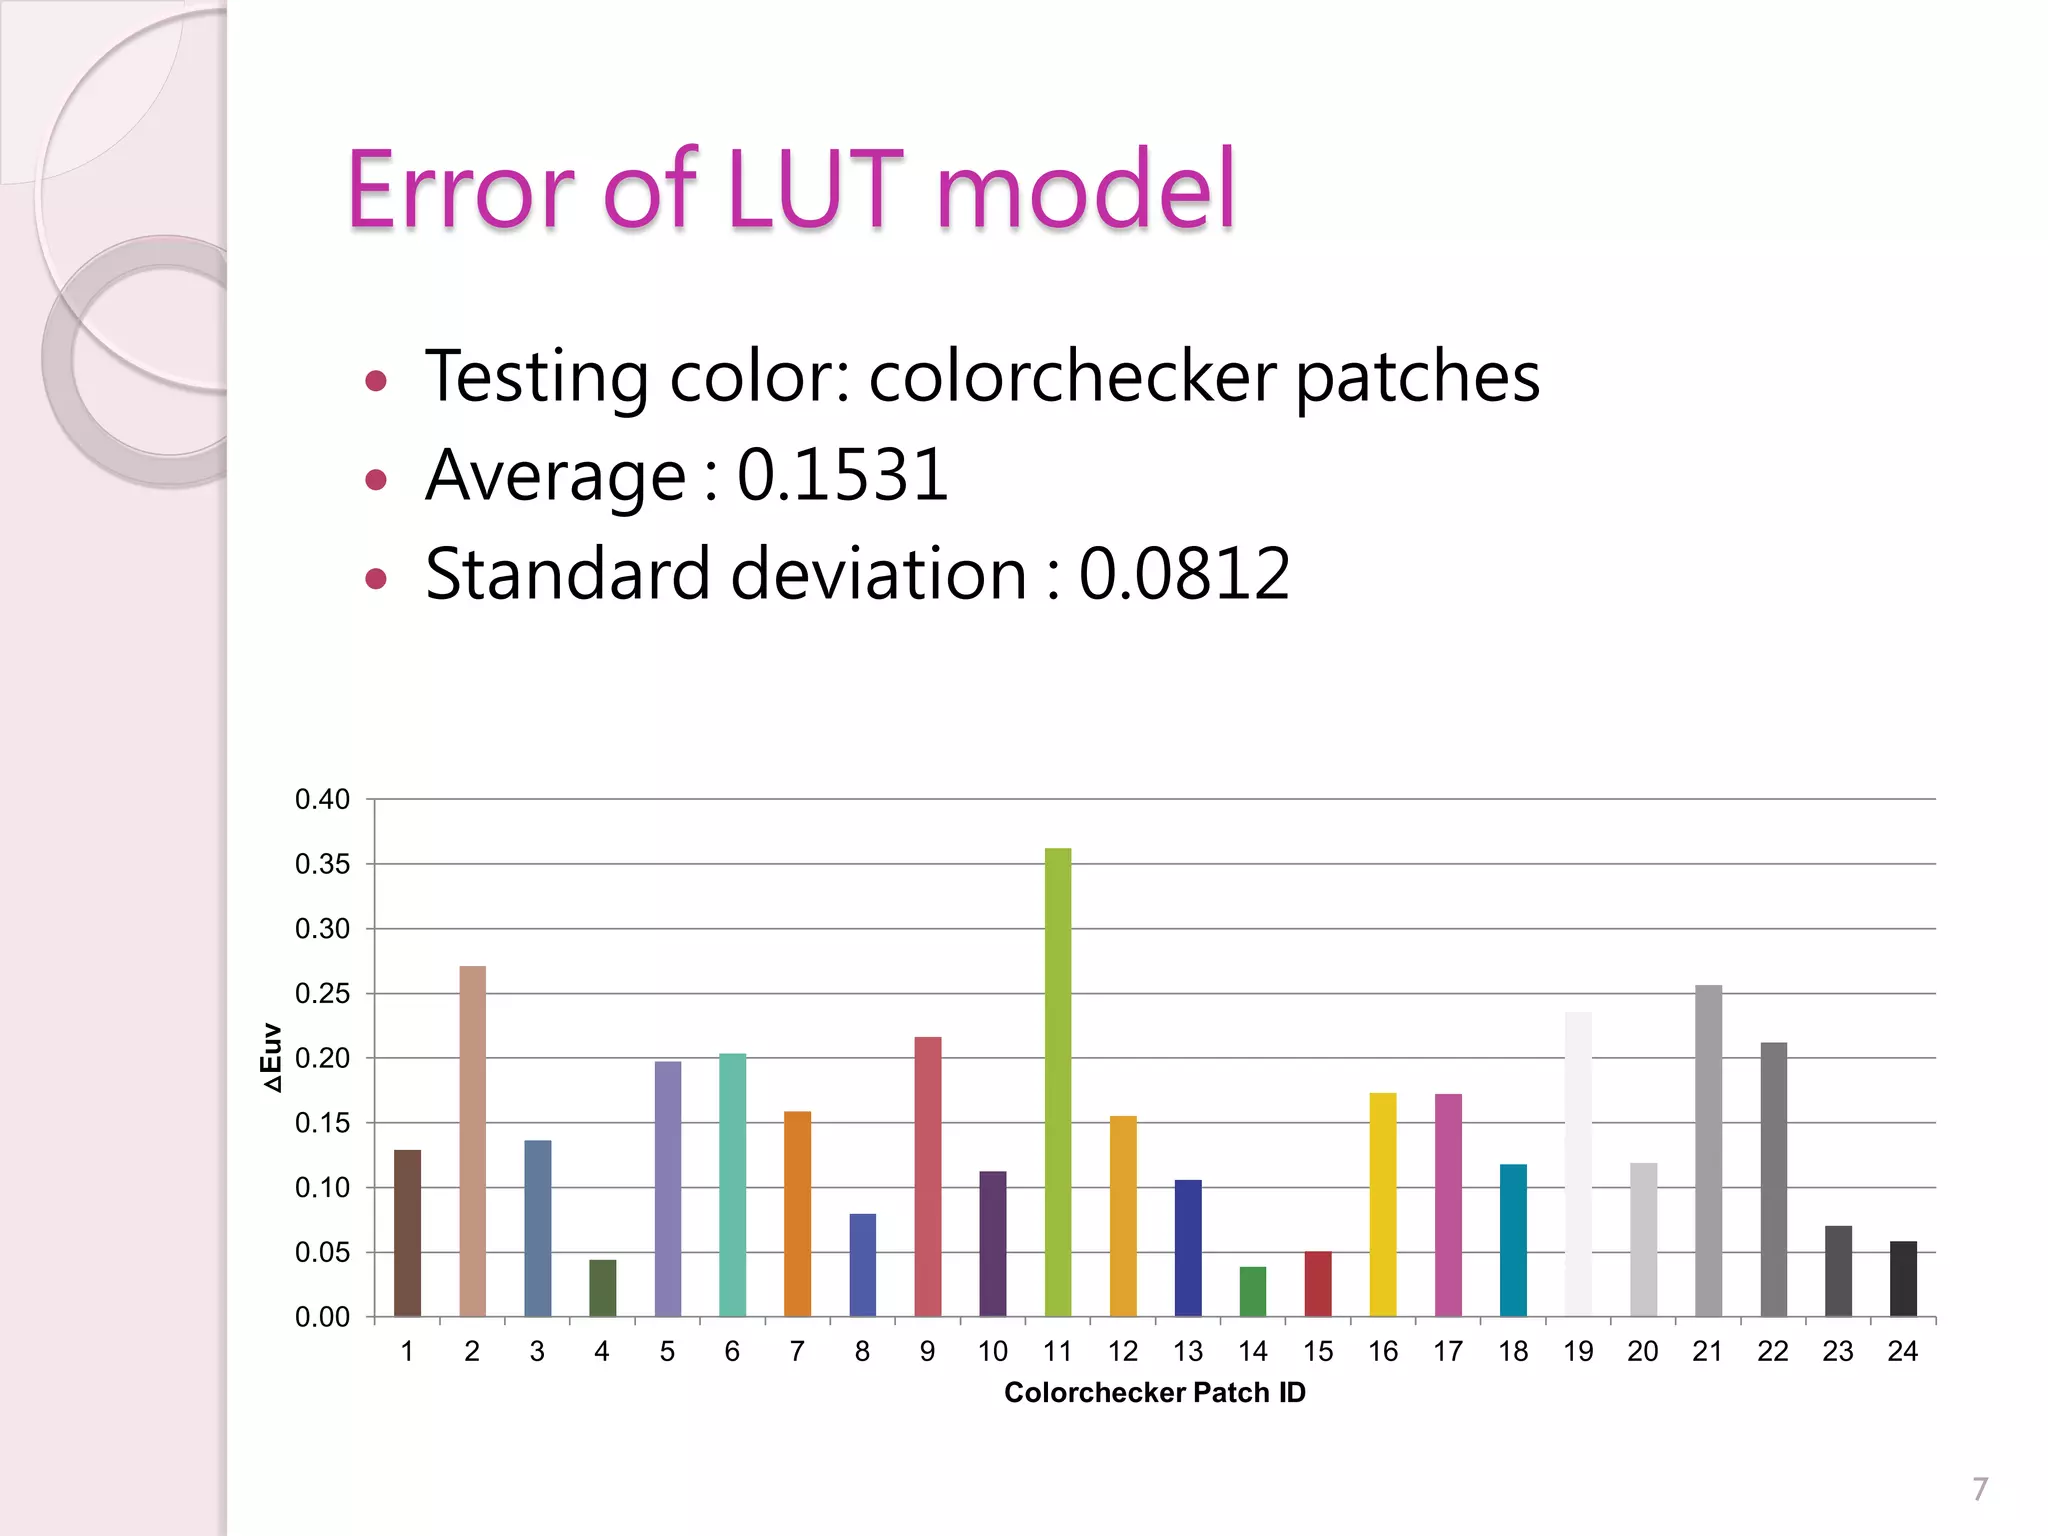
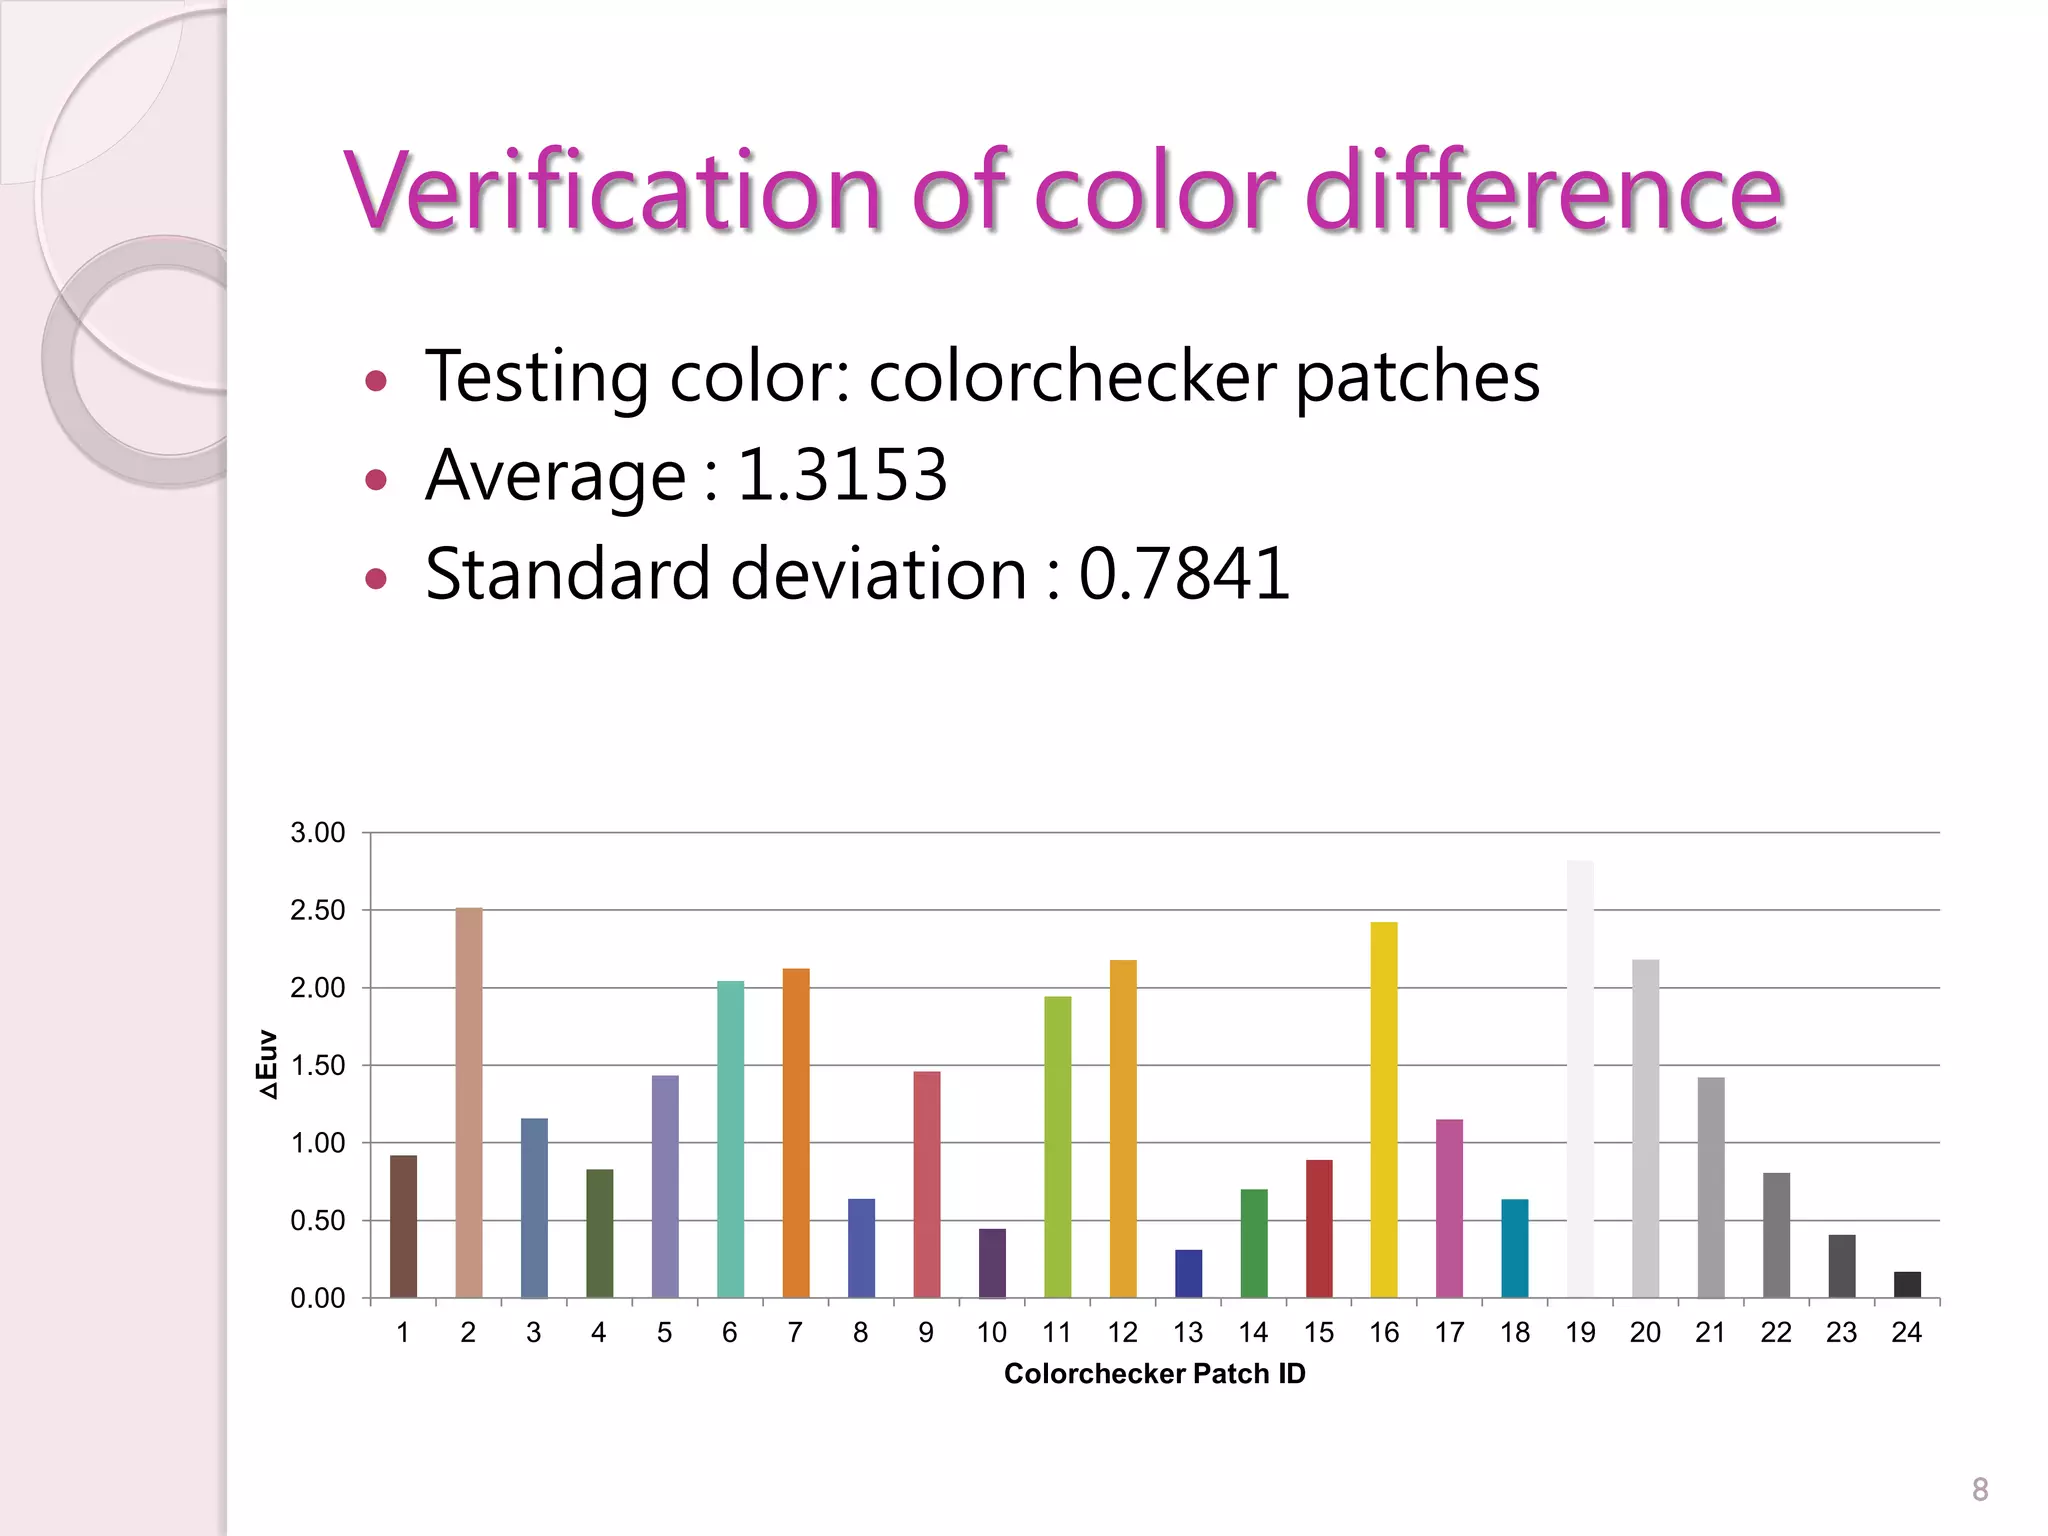
Color adjustment for LED
   projection system


Color, Imaging and Illumination Center
Graduate Institute of Engineering
National Taiwan University of Science and
Technology                                  1
Motivation
   Color mixing can create a rich color changes.
   LED projection system is able to show the
    correct brightness and color.

Goals
   Calibration, characterization, conversion.
   Analysis spectral, brightness and color.
   LED as a light source to be considered in the
    CRI (Color rendering) and the relationship
    between surface and color of projection.
                                     Whitewashed walls


                                                         2
Experimental design

Set up                             Experiments

• Projection system                • Brightness stability time.
  • Projection angle fixed at 15   • Spectral radiance distribution.
    degrees elevation.             • Primary transform matrix &
  • 40cm from the surface to be      inverse.
    projected.                     • Electro-optical transfer
• Projection surface                 function.
  • Assuming homogeneity           • Find out D65.
    refection of different         • Analysis color differences.
    measuring points.
  • Range 30cm to 180cm on
    the ground range.


                                                                       3
Warm up & Spectral radiance
                                  distribution
                                200

                                                                                                            Start to stabilize about 50 minutes
  Tristimulus Values(cd/m^2)


                                195

                                190

                                185
                                                                                                                  Y(white)
                                180

                                175

                                170
                                        0            25               50          75         100
                                                                      Time (minutes)
                                0.02
                               0.018
                                                                                                   Monochromatic spectrum in full compliance
                               0.016
                                                                                                   with the overlay of white light spectrum.
Radiance(W/m^2*sr)


                               0.014
                               0.012
                                                                                                                                         white
                                0.01
                                                                                                                                         red
                               0.008
                                                                                                                                         green
                               0.006
                                                                                                                                         blue
                               0.004
                               0.002
                                  0
                                       380   405   430    455   480   505   530    555 580 605 630   655   680   705   730   755   780
                                                                                  Wavelength (nm)                                                4
Primary transform matrix & inverse
   Electro-optical transfer function

                 Digital count from 0 to 255 in increments of 8.Thus 33
                 levels of emission were measured for each of the three
                 channels. A total of 99 samples.

Forward model
                                                   1.0


                                                   0.8


                             Releative Intensity
                                                   0.6
                                                                                                Red
                                                                                                Green
Backward model                                     0.4
                                                                                                Blue

                                                   0.2


                                                   0.0
                                                         0   32   64   96 128 160 192 224 256
                                                                       Code Value


                                                                                                  5
Find out D65
1.0


0.8


0.6


                                                                     color
0.4
                                                                     gamut


0.2


0.0
      0.0        0.2       0.4       0.6        0.8            1.0


                 D65     WHITE    RED      GREEN BLUE
            x   0.3125   0.2544   0.6963   0.1916     0.1274
            y   0.3300   0.2240   0.3032   0.7088     0.0768
                                                                             6
Error of LUT model
                Testing color: colorchecker patches
                Average : 0.1531
                Standard deviation : 0.0812


  0.40

  0.35

  0.30

  0.25
△Euv


  0.20

  0.15

  0.10

  0.05

  0.00
             1    2   3   4   5   6   7   8   9   10 11 12 13 14 15         16   17   18   19   20   21   22   23   24
                                                    Colorchecker Patch ID


                                                                                                                         7
Verification of color difference
                Testing color: colorchecker patches
                Average : 1.3153
                Standard deviation : 0.7841


  3.00

  2.50

  2.00
△Euv


  1.50

  1.00

  0.50

  0.00
             1    2   3   4   5   6   7   8   9   10 11 12 13 14 15         16   17   18   19   20   21   22   23   24
                                                    Colorchecker Patch ID


                                                                                                                         8
Discussion
   Color difference becomes large, and found that
    the brightness value(Y) is the greatest impact.
    Especially, the greater of difference in white .
   We found the tristimulus values ​ f D65 is even
                                      o
    larger than the original, confirmed that bright
    light in the case of output, resulting in increased
    chromatic aberration.
Summary
   Analysis spectral and Uniformity.
   Define the D65 .
   Verify the color difference.


                                                      9

Color adjustment of led

  • 1.
    Color adjustment forLED projection system Color, Imaging and Illumination Center Graduate Institute of Engineering National Taiwan University of Science and Technology 1
  • 2.
    Motivation  Color mixing can create a rich color changes.  LED projection system is able to show the correct brightness and color. Goals  Calibration, characterization, conversion.  Analysis spectral, brightness and color.  LED as a light source to be considered in the CRI (Color rendering) and the relationship between surface and color of projection. Whitewashed walls 2
  • 3.
    Experimental design Set up Experiments • Projection system • Brightness stability time. • Projection angle fixed at 15 • Spectral radiance distribution. degrees elevation. • Primary transform matrix & • 40cm from the surface to be inverse. projected. • Electro-optical transfer • Projection surface function. • Assuming homogeneity • Find out D65. refection of different • Analysis color differences. measuring points. • Range 30cm to 180cm on the ground range. 3
  • 4.
    Warm up &Spectral radiance distribution 200 Start to stabilize about 50 minutes Tristimulus Values(cd/m^2) 195 190 185 Y(white) 180 175 170 0 25 50 75 100 Time (minutes) 0.02 0.018 Monochromatic spectrum in full compliance 0.016 with the overlay of white light spectrum. Radiance(W/m^2*sr) 0.014 0.012 white 0.01 red 0.008 green 0.006 blue 0.004 0.002 0 380 405 430 455 480 505 530 555 580 605 630 655 680 705 730 755 780 Wavelength (nm) 4
  • 5.
    Primary transform matrix& inverse Electro-optical transfer function Digital count from 0 to 255 in increments of 8.Thus 33 levels of emission were measured for each of the three channels. A total of 99 samples. Forward model 1.0 0.8 Releative Intensity 0.6 Red Green Backward model 0.4 Blue 0.2 0.0 0 32 64 96 128 160 192 224 256 Code Value 5
  • 6.
    Find out D65 1.0 0.8 0.6 color 0.4 gamut 0.2 0.0 0.0 0.2 0.4 0.6 0.8 1.0 D65 WHITE RED GREEN BLUE x 0.3125 0.2544 0.6963 0.1916 0.1274 y 0.3300 0.2240 0.3032 0.7088 0.0768 6
  • 7.
    Error of LUTmodel  Testing color: colorchecker patches  Average : 0.1531  Standard deviation : 0.0812 0.40 0.35 0.30 0.25 △Euv 0.20 0.15 0.10 0.05 0.00 1 2 3 4 5 6 7 8 9 10 11 12 13 14 15 16 17 18 19 20 21 22 23 24 Colorchecker Patch ID 7
  • 8.
    Verification of colordifference  Testing color: colorchecker patches  Average : 1.3153  Standard deviation : 0.7841 3.00 2.50 2.00 △Euv 1.50 1.00 0.50 0.00 1 2 3 4 5 6 7 8 9 10 11 12 13 14 15 16 17 18 19 20 21 22 23 24 Colorchecker Patch ID 8
  • 9.
    Discussion  Color difference becomes large, and found that the brightness value(Y) is the greatest impact. Especially, the greater of difference in white .  We found the tristimulus values ​ f D65 is even o larger than the original, confirmed that bright light in the case of output, resulting in increased chromatic aberration. Summary  Analysis spectral and Uniformity.  Define the D65 .  Verify the color difference. 9