Download to read offline

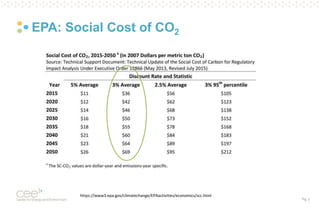
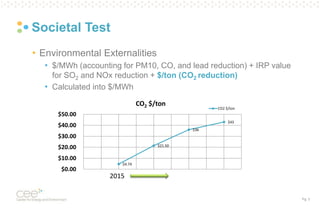
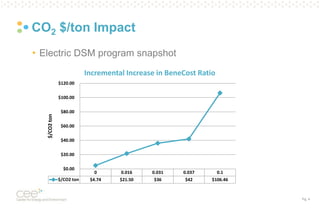
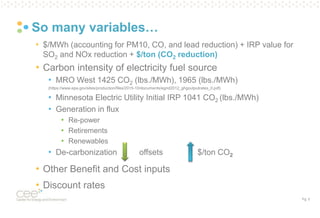


The document discusses the relationship between CO2 emissions and benefit-cost tests, emphasizing the financial implications of various environmental externalities and the cost per ton of CO2 reduction. It highlights the complexities involved, including the carbon intensity of electricity sources and other factors like renewable energy investments and discount rates. The findings and calculations aim to provide a clearer understanding of the financial impacts of reducing CO2 emissions in relation to electric demand-side management programs.


