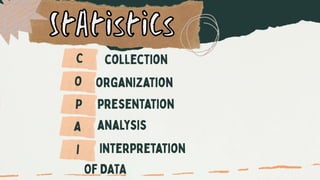
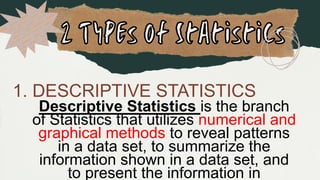
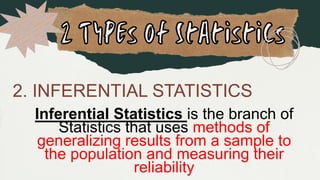
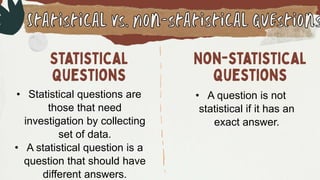
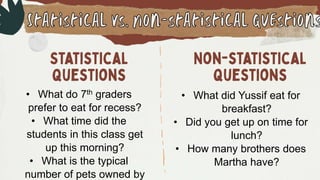
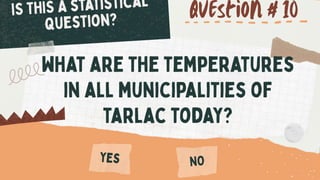
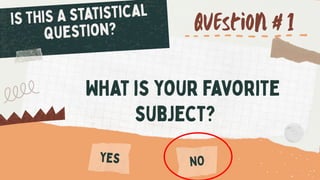
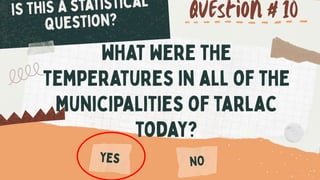
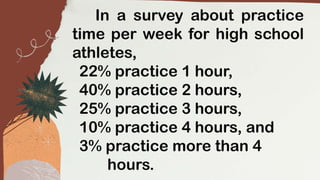
•
•
•
Biscuits
Biscuits
Junk foods
Spaghetti
Spaghetti
Spaghetti
Spaghetti
Biscuits
Spaghetti
Junk foods
Spaghetti
Spaghetti Spaghetti
Junk foods
Junk foods
Spaghetti
Biscuits
Spaghetti Junk foods
Biscuits
Biscuits Spaghetti Biscuits
Spaghetti
Junk foods
Statistics is the science of collecting,
organizing, presenting, analyzing,
and interpreting data collected in a
systematic manner with a definite
purpose.
1. DESCRIPTIVE STATISTICS
Descriptive Statistics is the branch
of Statistics that utilizes numerical and
graphical methods to reveal patterns
in a data set, to summarize the
information shown in a data set, and
to present the information in
2. INFERENTIAL STATISTICS
Inferential Statistics is the branch of
Statistics that uses methods of
generalizing results from a sample to
the population and measuring their
reliability
1. What percent of PNHS students are living
below the poverty line?
2. What is the school’s enrolment rate for the
past three years?
3. A couple has four boys. The mother is
pregnant again. What is the chance that they
will have another boy?
• What do 7th graders
prefer to eat for recess?
• What time did the
students in this class get
up this morning?
• What is the typical
number of pets owned by
• What did Yussif eat for
breakfast?
• Did you get up on time for
lunch?
• How many brothers does
Martha have?
• Statistical questions are
those that need
investigation by collecting
set of data.
• A statistical question is a
question that should have
different answers.
• A question is not
statistical if it has an
exact answer.
• What do 7th graders
prefer to eat for recess?
• What time did the
students in this class get
up this morning?
• What is the typical
number of pets owned by
• What did Yussif eat for
breakfast?
• Did you get up on time for
lunch?
• How many brothers does
Martha have?
In a survey about practice
time per week for high school
athletes,
22% practice 1 hour,
40% practice 2 hours,
25% practice 3 hours,
10% practice 4 hours, and
3% practice more than 4
hours.
The pictures are examples of
situations where Statistics can be
applied. Choose two pictures you
are interested with. Write one
question related to each picture
whose answers can be obtained
using Statistics.
•
•
•
•
•
•
•
•
•
•
•
•
• not
•
• not
•
•
•
•
•
CO 2.pptx
CO 2.pptx
CO 2.pptx
CO 2.pptx
CO 2.pptx
CO 2.pptx

CO 2.pptx

  • 3.
  • 4.
  • 5.
    Biscuits Biscuits Junk foods Spaghetti Spaghetti Spaghetti Spaghetti Biscuits Spaghetti Junk foods Spaghetti SpaghettiSpaghetti Junk foods Junk foods Spaghetti Biscuits Spaghetti Junk foods Biscuits Biscuits Spaghetti Biscuits Spaghetti Junk foods
  • 7.
    Statistics is thescience of collecting, organizing, presenting, analyzing, and interpreting data collected in a systematic manner with a definite purpose.
  • 10.
    1. DESCRIPTIVE STATISTICS DescriptiveStatistics is the branch of Statistics that utilizes numerical and graphical methods to reveal patterns in a data set, to summarize the information shown in a data set, and to present the information in
  • 11.
    2. INFERENTIAL STATISTICS InferentialStatistics is the branch of Statistics that uses methods of generalizing results from a sample to the population and measuring their reliability
  • 12.
    1. What percentof PNHS students are living below the poverty line? 2. What is the school’s enrolment rate for the past three years? 3. A couple has four boys. The mother is pregnant again. What is the chance that they will have another boy?
  • 13.
    • What do7th graders prefer to eat for recess? • What time did the students in this class get up this morning? • What is the typical number of pets owned by • What did Yussif eat for breakfast? • Did you get up on time for lunch? • How many brothers does Martha have?
  • 14.
    • Statistical questionsare those that need investigation by collecting set of data. • A statistical question is a question that should have different answers. • A question is not statistical if it has an exact answer.
  • 15.
    • What do7th graders prefer to eat for recess? • What time did the students in this class get up this morning? • What is the typical number of pets owned by • What did Yussif eat for breakfast? • Did you get up on time for lunch? • How many brothers does Martha have?
  • 38.
    In a surveyabout practice time per week for high school athletes, 22% practice 1 hour, 40% practice 2 hours, 25% practice 3 hours, 10% practice 4 hours, and 3% practice more than 4 hours.
  • 40.
    The pictures areexamples of situations where Statistics can be applied. Choose two pictures you are interested with. Write one question related to each picture whose answers can be obtained using Statistics.
  • 41.
  • 42.
  • 43.
  • 44.
  • 45.
  • 46.
  • 48.
  • 49.

Editor's Notes

  • #9 C- an accumulation of objects gathered for study, comparison, O- categorizing and classifying data to make it more usable P- refers to the organization of data into tables, graphs or charts, so that logical and statistical conclusions can be derived A- process of systematically applying statistical and/or logical techniques to describe and illustrate, condense and recap, and evaluate data. I -Interpreting your data is a process that involves answering a series of questions about it