This document analyzes the compensation of former Valeant Pharmaceuticals CEO J. Michael Pearson. Pearson received a large compensation package heavily tied to stock performance targets. Under Pearson, Valeant grew rapidly through acquisitions but also took on significant debt. While the stock initially soared, scrutiny of Valeant's business practices intensified and the stock price collapsed in 2015-2016. Pearson was replaced as CEO, though his successor also received a largely performance-based compensation package. The document discusses debates around how executive pay incentives can encourage risk-taking and whether Valeant's approach was sustainable.
![Stanford Closer LOOK series
Stanford Closer LOOK series 1
By David F. Larcker and Brian Tayan
april 28, 2016
ceo pay at valeant
does extreme compensation create extreme risk?
introduction
The litmus test for an effective executive compensation program
is whether it provides incentive to attract, retain, and motivate
qualified executives to pursue corporate objectives that build
shareholder wealth. This concept, known as “pay for performance,”
reflects the degree to which executive rewards are correlated
with financial outcomes that benefit shareholders. Companies
typically encourage pay for performance by offering a mix of cash,
equity, and other awards that pay off with the achievement of key
performance targets across both short- and long-term horizons.
While the concept of pay for performance is straightforward,
the optimal structure is not. The board of directors—and
compensation committee in particular—must make a series of
decisions about pay design that involve real tradeoffs, including
whether to tie pay more closely to operating or stock price
results, the balance between financial and nonfinancial targets,
the balance between cash and equity awards, the size of awards,
and whether allowances should be made for executives who miss
targets because of economic factors outside of their control.
The board must also consider the unintended consequences
of pay, including whether it encourages decisions, actions, or
behaviors that are not in the interest of shareholders—such as
excessive risk-taking or artificial moves to boost the value of
awards.1
The research literature provides substantial evidence
that these types of outcomes can occur. For example, Coles,
Daniel, and Naveen (2006) find that executives respond to stock
option grants by taking actions to increase firm risk.2
Armstrong,
Larcker, Ormazabal, and Taylor (2013) find that an increase in
the sensitivity of CEO wealth to stock price volatility is positively
associated with financial misreporting.3
And Larcker, Ormazabal,
Tayan, and Taylor (2014) demonstrate a significant increase in
risk-taking incentives among banks prior to the financial crisis,
particularly banks that originated and distributed the securitized
assets central to the crisis.4
As a result, executives holding
compensation awards whose value is tied to stock price volatility
or that pay out only in the case of extreme performance likely
require especially vigilant oversight by the board.5
ceo pay at valeant
J. Michael Pearson was recruited as chairman and CEO of Valeant
Pharmaceuticals in 2008 by hedge fund ValueAct. ValueAct was
the company’s largest institutional investor, holding a 16 percent
stake and a seat on the board. ValueAct had acquired its position
after a late-stage trial of a promising hepatitis C treatment was
shown to be ineffective, precipitating a 20 percent drop in the
company’s share price.6
ValueAct believed that in-house research
for new drug development was not a cost-effective method for
drug discovery—a belief that Pearson, previous head of the
global pharmaceutical practice at McKinsey & Co., shared. The
two favored an approach of allowing outside research groups
to identify promising treatments and only acquiring those that
offered favorable risk-reward characteristics. The company also
looked for situations of untapped pricing power in existing drugs.
According to a board member, “We [the industry] fail more often
than we succeed. Rather than invest in a high-risk bet, we will be
smart through acquisition and licensing.”7
According to Pearson,
“There have been lots and lots of reports… talking about how
R&D on average is no longer productive. I think most people
accept that. So it is begging for a new model and that is hopefully
what we have come up with.”8
ValueAct was also influential in designing the compensation
package offered to Pearson—one that encouraged a focus on
long-term value creation. Pearson received a $1 million salary
and package of equity awards (stock and options) valued at $16
million (see Exhibit 1). Included in these were performance stock
units that would vest only upon achievement of the following
three-year compounded total shareholder return (TSR) targets:
• 3-year TSR < 15 percent per year, zero shares vest.
• 3-year TSR of 15 percent to 29 percent, 407,498 shares vest
(base amount).
• 3-year TSR of 30 percent to 44 percent, 814,996 shares vest
(double the base amount).
• 3-year TSR > 45 percent, 1,222,494 shares vest (triple the base
amount).](https://image.slidesharecdn.com/8af2679e-309a-4f84-bb81-8f63d6836221-160428202357/85/cl56_Valeant-1-320.jpg)
![CEO Pay at Valeant
2Stanford Closer LOOK series
The performance units were structured to offer an exponential
payout for exceptional long-term share price performance and
zero payout if base-level thresholds were missed (see Exhibit 2).
Similar awards were granted to other senior executives. Pearson
was also required to purchase $5 million in Valeant stock with his
personal money.
Compensation experts lauded the structure. According to one,
“[Performance-based awards] go a substantial distance toward
addressing my concerns about executive pay arrangements.” To
another, “Many companies would benefit from imitating this or
moving in this direction. More pay for performance is a good
thing.” He noted, however, that “it creates some incentive to jack
up the stock price in year three to hit these hurdles.”9
Pearson moved aggressively to reshape the company. He
reduced the research and development budget, slashed corporate
overhead, and launched a string of acquisitions and licensing
deals to bring in new products (see Exhibit 3). In 2010, Pearson
purchased Canadian-based Biovail in a corporate tax inversion
that permanently reduced the company’s tax basis. (According
to Pearson, “We were able to get a corporate tax structure which
took our effective tax rate from 36 percent overall to what was
actually 3.1 percent, which we hope to continue to work on and
move lower.”10
) In 2012, he acquired Medicis Pharmaceutical for
$2.6 billion, in 2013 Bausch & Lomb for $8.7 million, and in 2015
Salix Pharmaceuticals for $11 billion. Corporate revenue grew
10-fold in six years, and Valeant stock price soared (see Exhibit 4).
After 2 years, Valeant stock price exceeded the highest price
target for the maximum number of performance units to vest.
The board renewed and extended Pearson’s contract. Pearson
received additional performance units, this time with a four-year
vesting term and a maximum payout of 4-times the target number
of awards for 60 percent compounded TSR. The board added
multiple measurement dates to protect against short-term run ups
in the company’s stock price. Pearson also agreed not to sell vested
shares.11
At its peak, Pearson’s stake in the company exceeded $3
billion in value (see Exhibit 5).
Valeant’s fortunes began to turn in 2014, when the company
made an unsolicited offer to acquire Allergan (maker of Botox)
for $46 billion, or $153 per share. Allergan’s board rejected the
offer as undervalued. Valeant subsequently raised its bid to $166,
$179, and then $186 per share. Allergan’s board rejected these
offers and, amid legal and proxy battles, agreed to be purchased by
Ireland-based Actavis for $219 per share.
Althoughunsuccessful,thehostilebattledrewrenewedscrutiny
to Valeant’s business practices. According to a competitor, “Valeant
will eventually run out of things to buy and once it does, it faces the
problem of how does it keep on the trajectory. A company without
R&D short-term and mid-term can be viable, but long-term is
not.”12
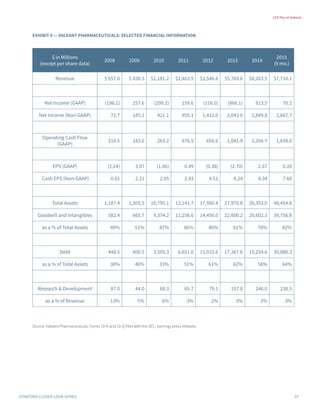
Some noted the significant mismatch between reported
(GAAP) and adjusted (non-GAAP) earnings.13
While the company
claimed nearly $8 billion in profit on a cash-basis over a 7-year
period, generally accepted accounting principles showed zero
net income over this period. Cash flows also significantly lagged
adjusted earnings.14
The company attributed the differences to
amortization and impairments of intangible assets, write offs for
in-process R&D, and other acquisition and restructuring related
charges. Because acquisitions were made in cash, the company
carried a large debt load relative to assets and earnings (see Exhibit
6). A former industry executive asked, “Is the role of leading large
pharmaceutical companies to discover lifesaving drugs or to make
money for shareholders through financial engineering?”15
In 2015 and 2016, the company faced a series of setbacks that
drove down its stock price. The U.S. Congress inquired about
Valeant’s drug pricing practices, including increases of the prices
of certain cardiovascular, dermatological, and ophthalmological
products by as much as 20-fold following their acquisition.16
The
company came under fire for not fully disclosing the extent of its
relationship with specialty pharmacy Philidor, which it relied on
to fill key prescriptions and guide patients and doctors through
the reimbursement process.17
The board of directors conducted
an internal review of the company’s reported financials. Although
revisions were minor, Valeant was forced to delay the release
of its financial statements, lower future earnings guidance, and
enter discussions with lenders to ease financial covenants. Rating
agencies downgraded the company’s debt. Pearson went on
medical leave for severe pneumonia, and following his return,
the board announced he would step down. Valeant’s stock, which
peaked at $260, fell 90 percent to $30.
Valeant named Joseph Papa, former CEO of drug maker
Perrigo, to replace Pearson. He was granted a compensation
package similar in structure to Pearson’s, including approximately
$30 million in performance share units subject to four-year vesting
and multiple performance hurdles. If he achieved the maximum
performance hurdle (compound annual TSR of nearly 70 percent),
Papa stood to receive $500 million. The maximum hurdle was set
to coincide with the company’s previous all-time high stock price
(see Exhibit 7).18
Why This Matters
1. Critics of executive compensation often claim that CEO pay
packages are not sufficiently tied to stock price performance.
At the same time, research evidence suggests that significant](https://image.slidesharecdn.com/8af2679e-309a-4f84-bb81-8f63d6836221-160428202357/85/cl56_Valeant-2-320.jpg)