Download to read offline
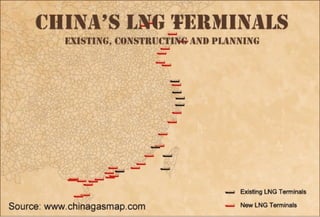
The document provides a map of China's LNG terminals, detailing 39 existing, under construction, and planned receiving terminals. It includes information sourced from project directories and reports published by ARA Research & Publication in 2012. The document is part of a larger dataset available on www.chinagasmap.com.


![[Alghumgham]2011SPEpowerpoint](https://cdn.slidesharecdn.com/ss_thumbnails/8850602d-8d5e-4b61-8bd8-d72c875e4545-151120195603-lva1-app6891-thumbnail.jpg?width=640&height=640&fit=bounds)


