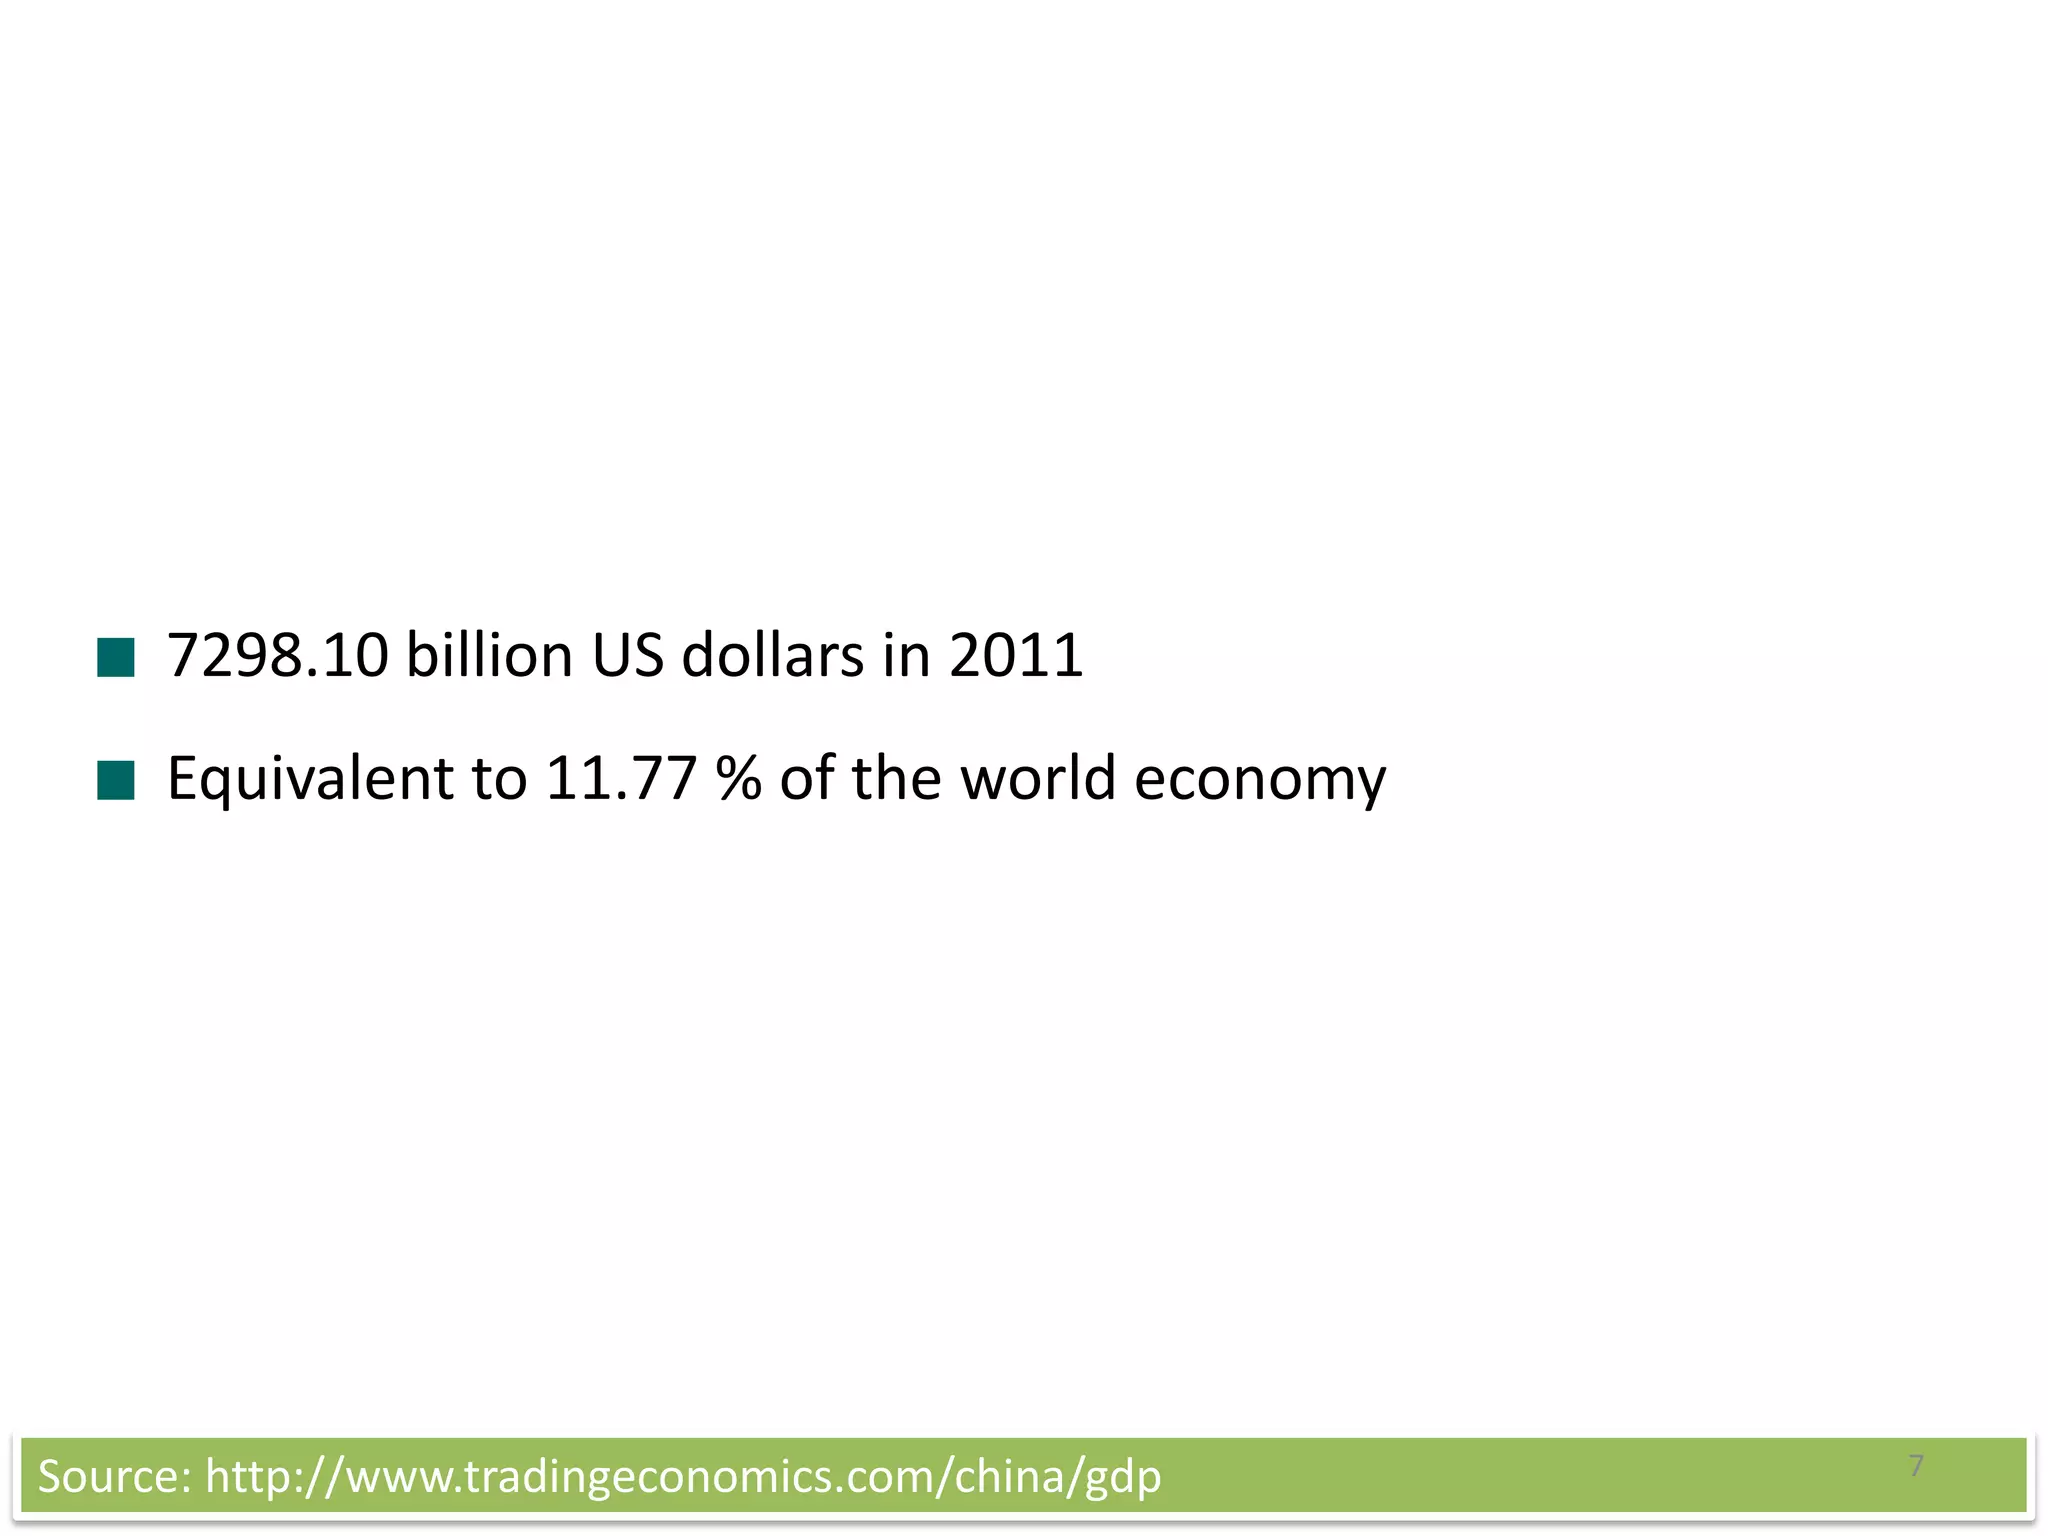
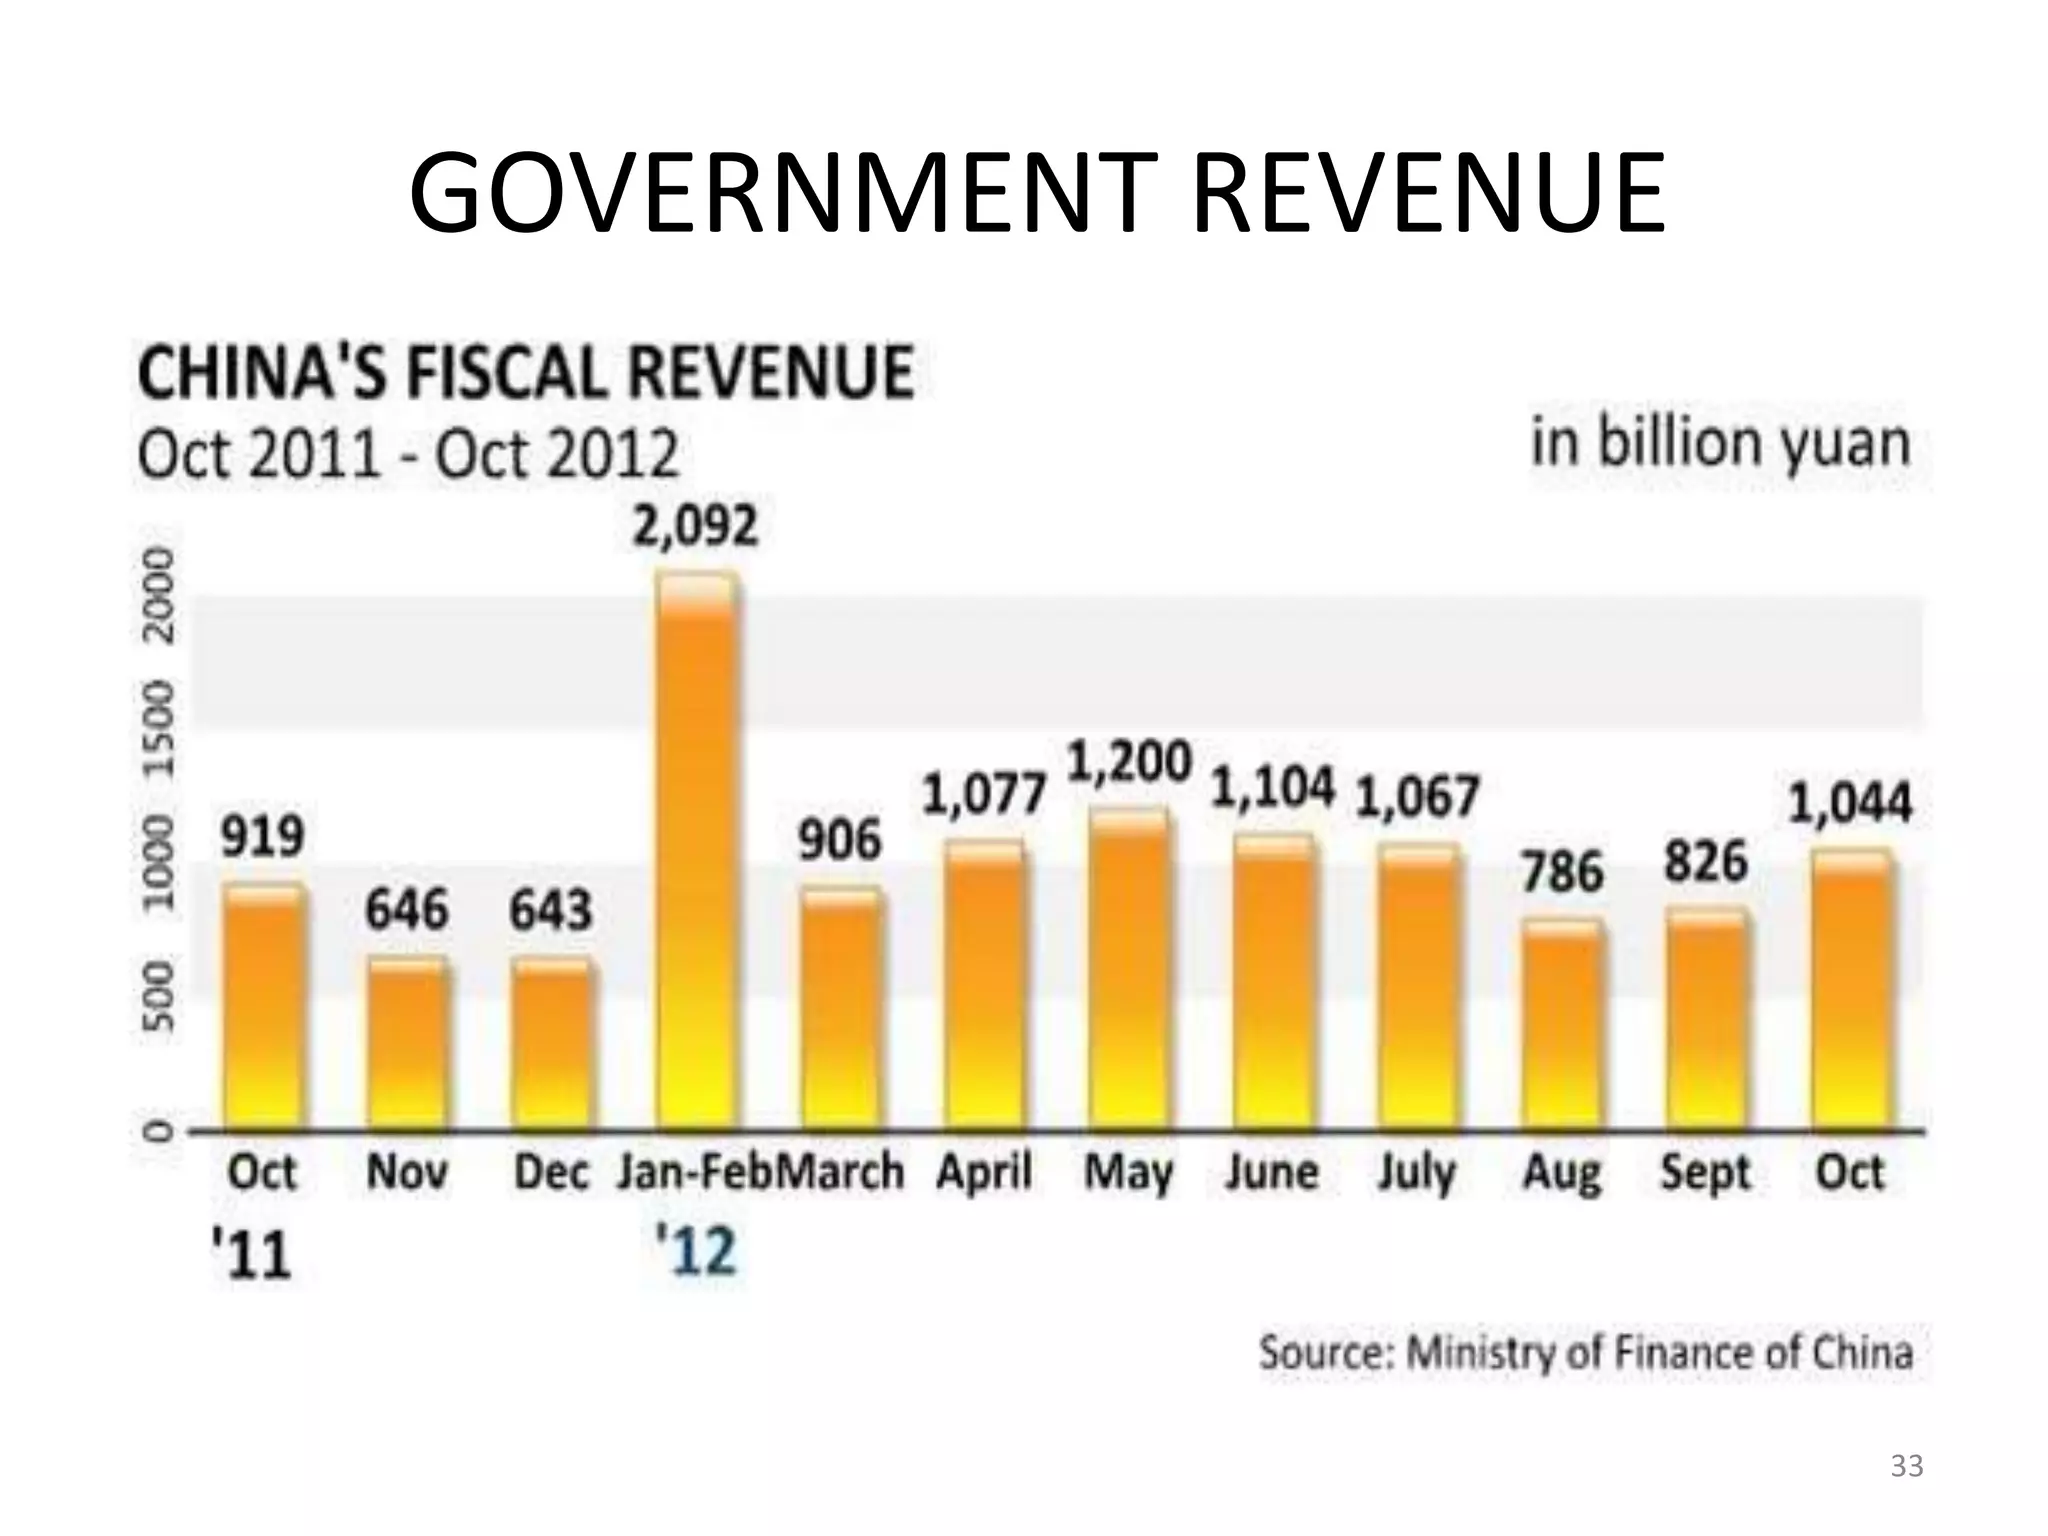
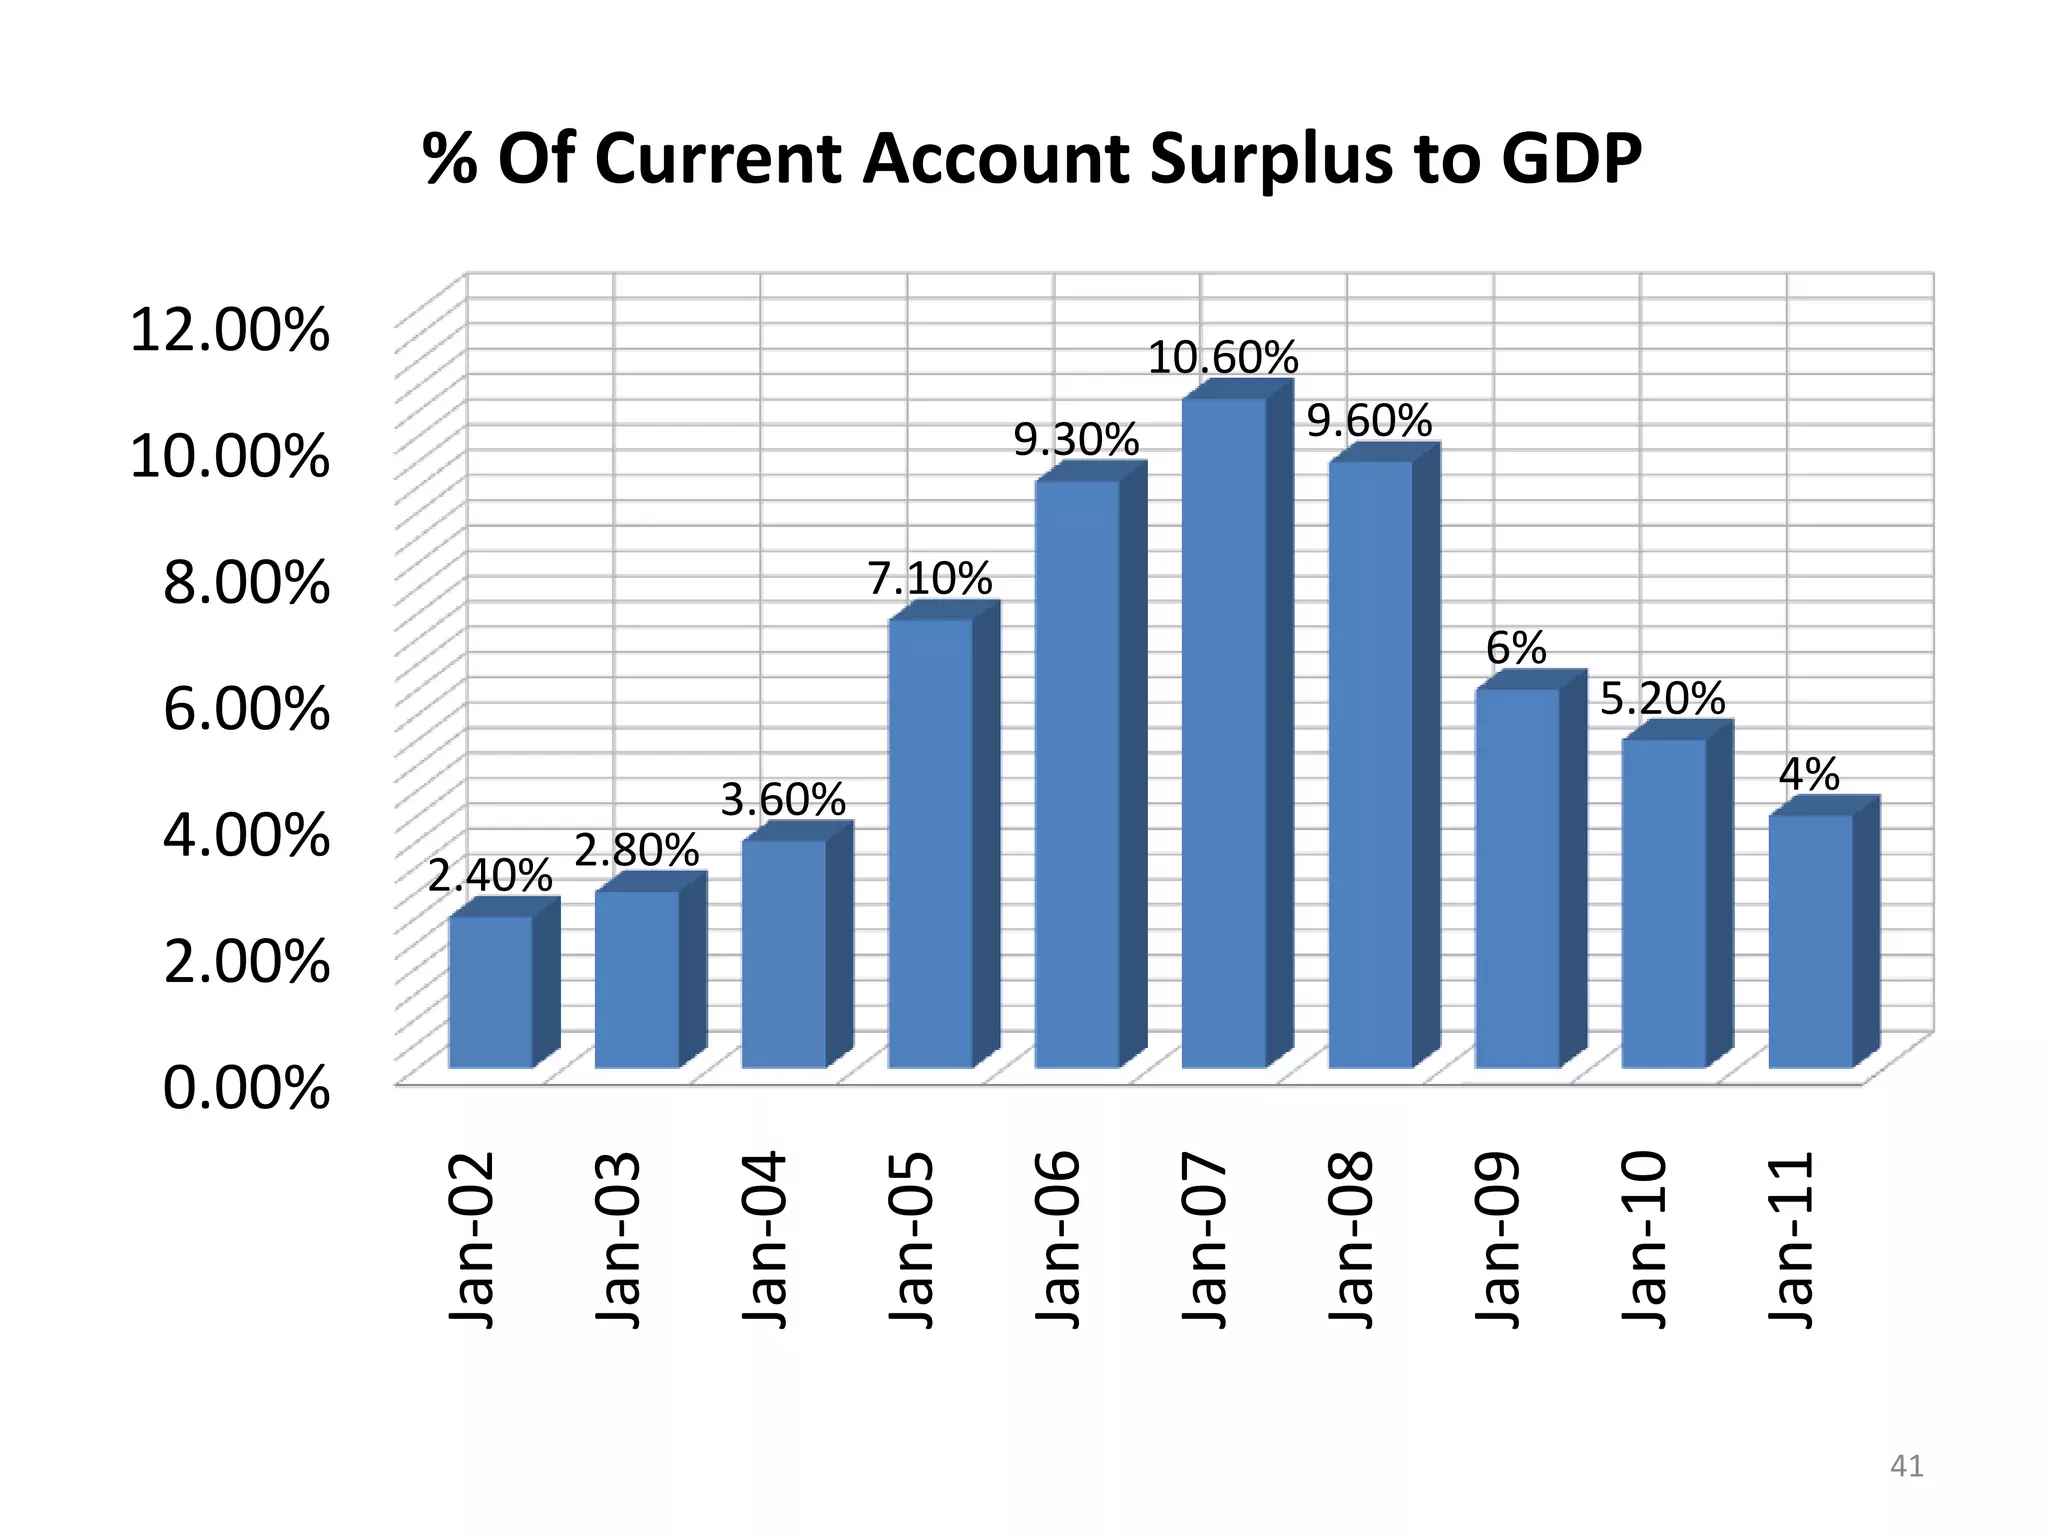
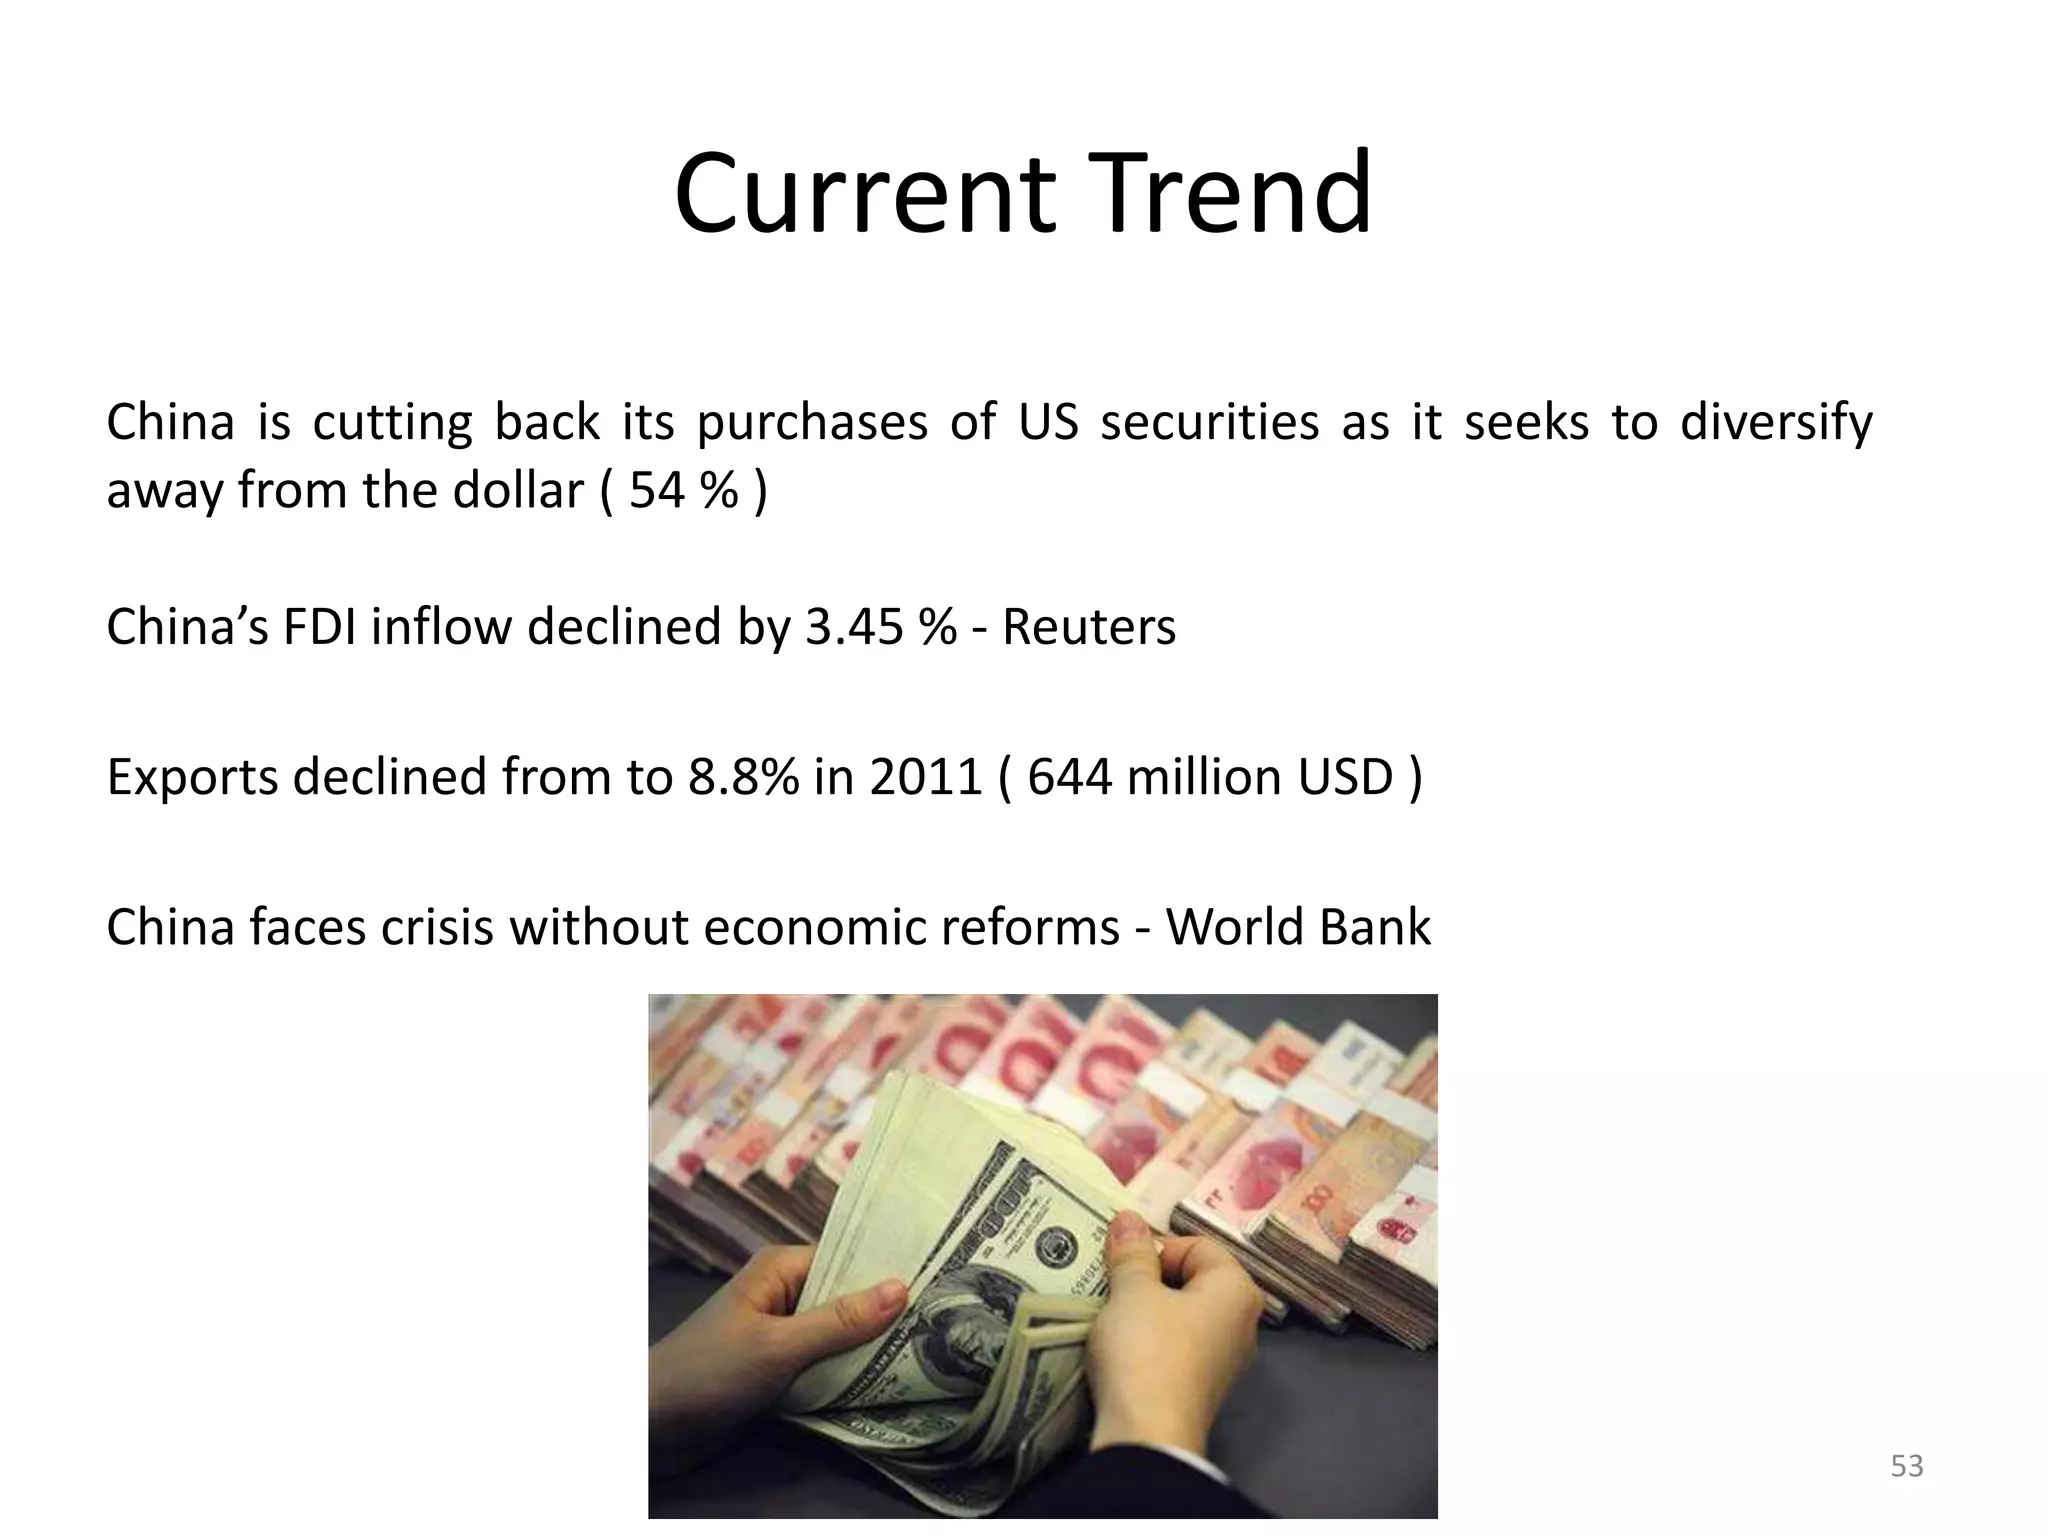
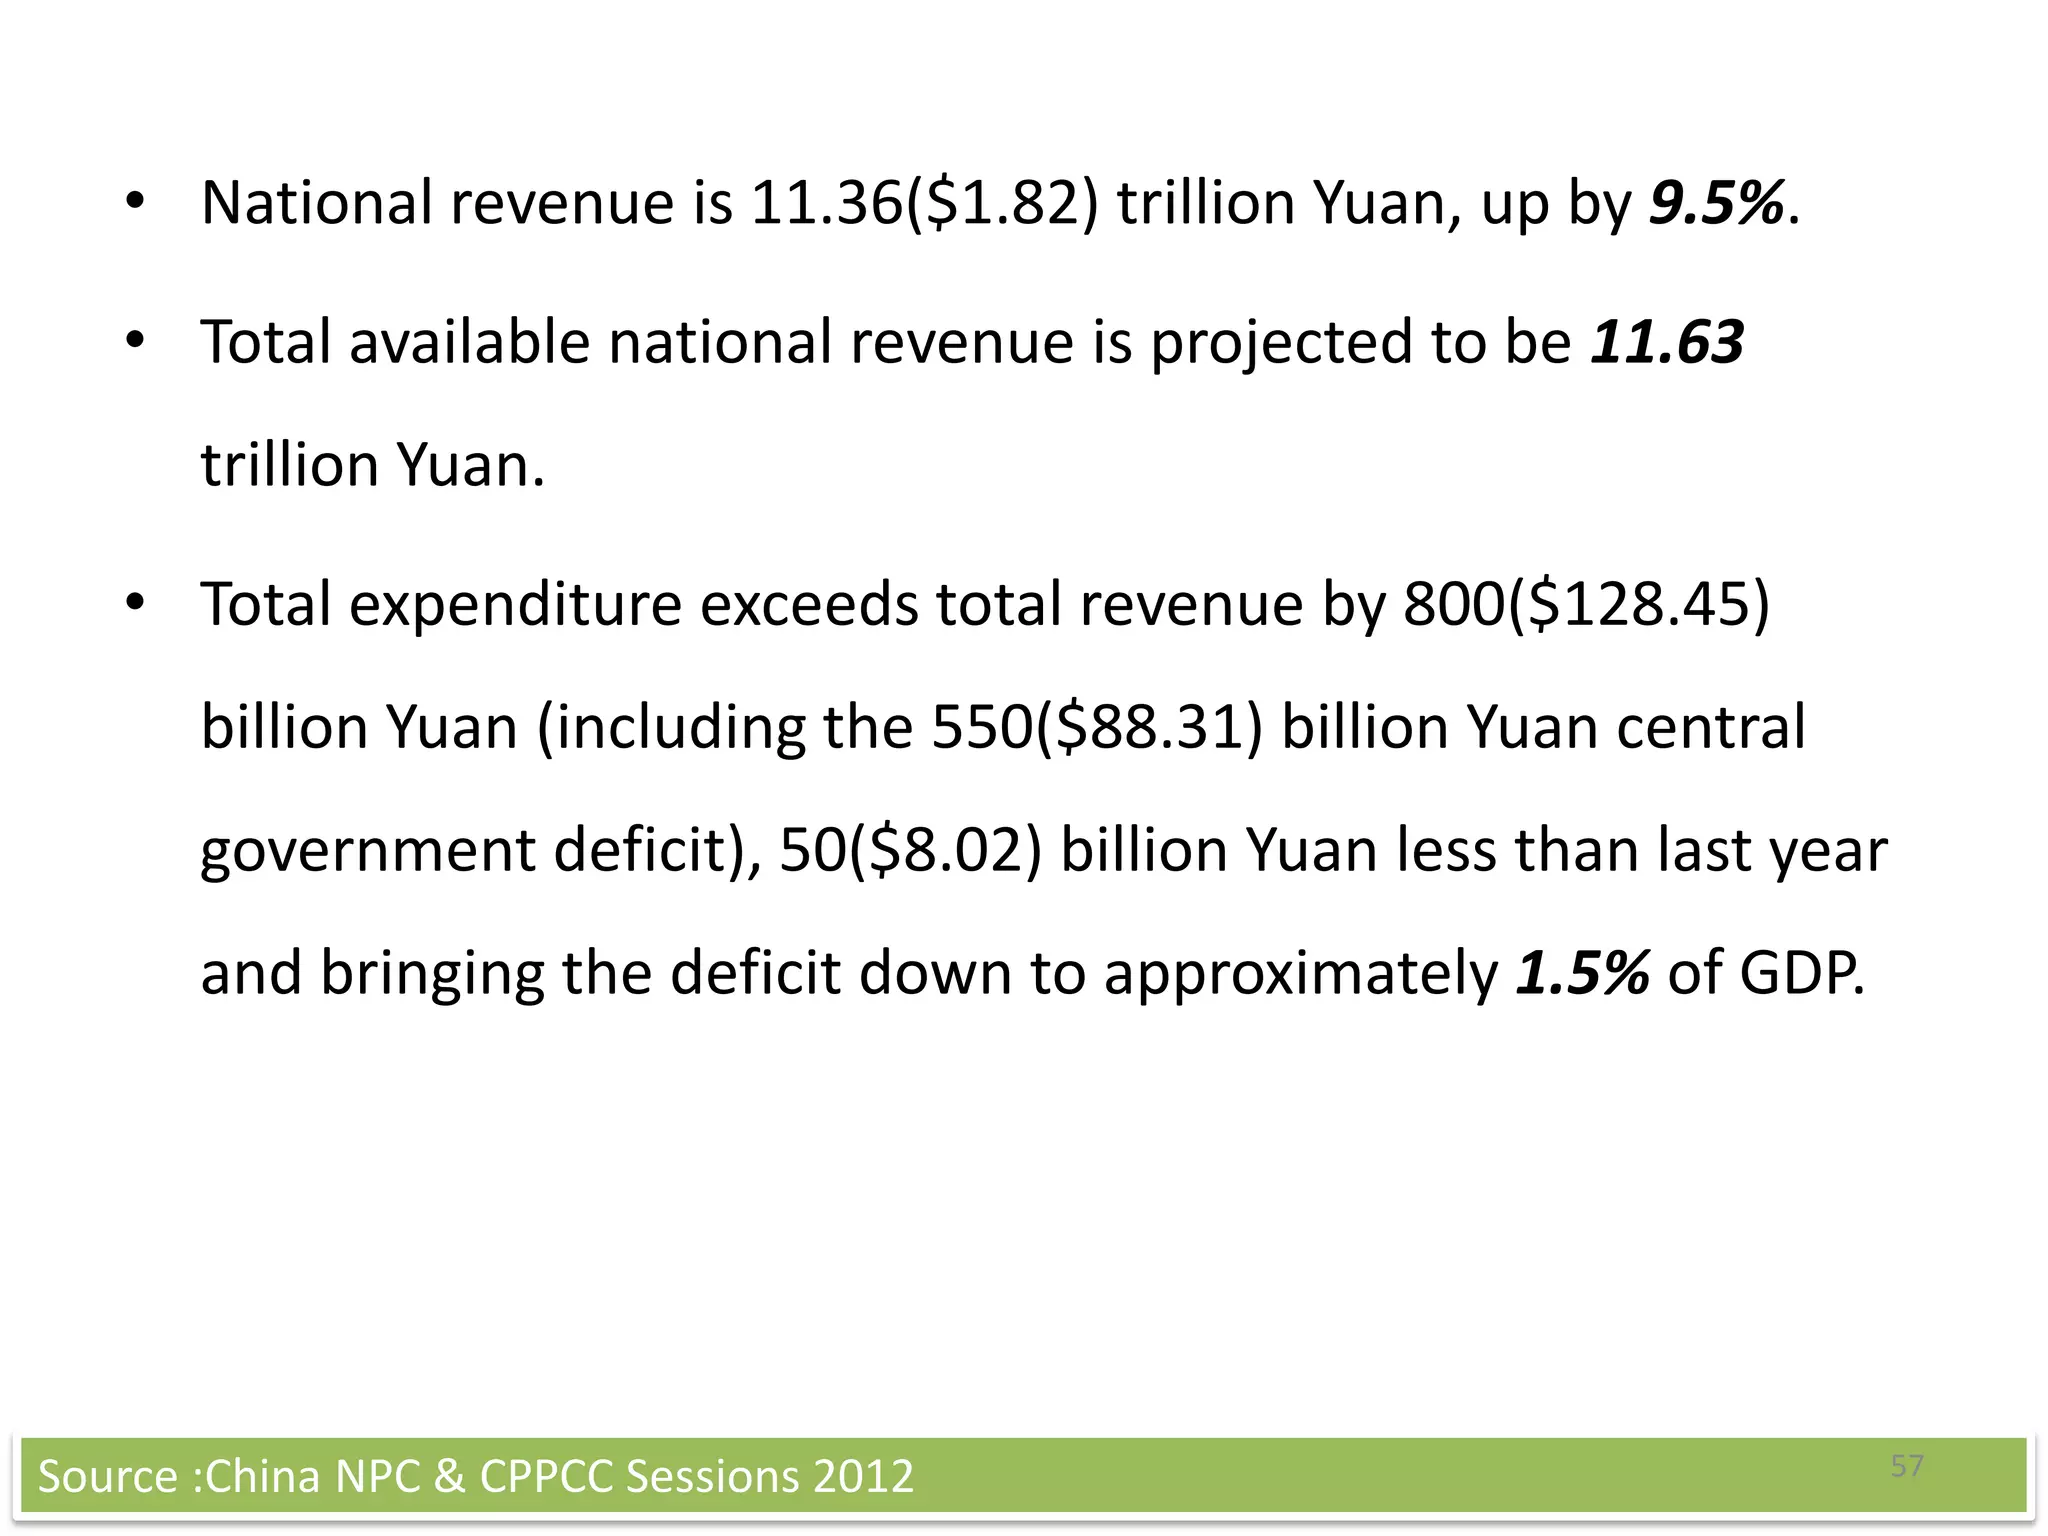
CHINA

MACRO ECONOMICS
                    GROUP 1
                    I MBA A
         MBA A G1             1
Prepared By:
•Aarathy Jayakrishnan
•Agil V Joseph
•Amrita Banerjee
•Anantha Kumar G M R
•Anuroop
•Arun S
•Ashis Kumar Nayak
•Avinnash B Premanand
•Babish Kumar P M
•Venkatraman S
•Pooja Chhotray
                        2
ABOUT CHINA


              3
People's Republic of China.

World's most Populous country

Single-party state governed by the Communist Party of China


                                                              4
Introduction of economic reforms in 1978

World's fastest-growing major economy

It is the world's second-largest economy

United Nations member since 1971


                                           5
CHINA

GROSS DOMESTIC PRODUCT


                         6
7298.10 billion US dollars in 2011
     Equivalent to 11.77 % of the world economy


Source: http://www.tradingeconomics.com/china/gdp   7
8
CHINA

GDP GROWTH RATE


                  9
Chinese GDP grew by 7.4% in quarter 3 down from 7.6% in
quarter 2
It represents A sharp slowdown for china, where GDP grew
9.2 % in 2011 and has averaged an annual rate of around 10 %
for three decades.
Growth is lower than the 9%-10% range from 2008 to 2011


                                                          10
CHINA GDP GROWTH RATE


                        11
CHINA

REASONS FOR LOW GROWTH RATE


                              12
13
Fall in Exports and Imports
           Exports grew 2.7 % year-on-year, less than the 3 % forecast
           reflecting global financial crisis
           Threats from India, Vietnam and Pakistan offering similar goods
           at lower prices
            Imports fell 2.6 % against expectations of 3.5 increase due to
           weaker domestic demand
           Fall in Purchasing Managers Index
              The PMI index is based on five major indicators: new
              orders, inventory levels, production, supplier deliveries and
              the employment environment
              PMI fell to 47.8 the lowest since March 2009 caused by
              inventories climbing up and export orders falling


                      National Bureau of Statistics
Source:http://www.ibtimes.co.uk/articles/382407/20120910/china-economy-exports-imports.htm   14
15
Fall in Industrial output
Industrial output growth slowed to 8.9% below market
forecasts of a 9.1 % due to slowing new orders
Surveys suggest that manufacturers will run inventories
down further before they can begin to turn production up
again
The growth rate in industrial electricity production, after
spiking early this year, has fallen back sharply to near zero
growth due to decelerating industrial activity


                                                           16
17
Real    estate               investment
collapse
Real estate investment, which is a large part of
fixed asset investment, is not picking up due to
changing Government policies
  Low average                  household
  consumption
  Rise in household savings
  Young families aspiring for home ownership
  Poor access to insurance claims and loans
                                               18
GDP PER CAPITA

GDP per capita rose from $1135 in
2002 to $5432 in 2011 with an
average annual growth of 16.7%

The GDP per Capita in China is
equivalent to 21 % of the world's
average
                                    20
CHINA

Consumption And Consumer
Market

                           23
China’s consumers spending more than previously believed-
according to the latest revisions to the country’s economic data.

Household spending increased by
about $126 billion spread over eight
years.

 NBS found that household
expenditure was revised up to 11.06
trillion Yuan, an increase of 220.23
billion Yuan.

 China will be the world’s second
largest consumer market by 2015
(currently number three behind the
U.S. and Japan)
                                                                    24
CHINA

OTHER ASPECTS OF CHINESE CONSUMPTION


                                  25
China is trying to diversify its reserve holdings
Buying more Japanese yen and Korean won.
Diversify PBC holdings has had no disruptive affect on the US
Treasury market.
There is more income inequality.


                                                                26
CHINA

INVESTMENT


             27
 According to the statistics of news release of foreign investment, from
January to August 2012, the actual use of foreign investment reached
US$ 74.994 billion, down by 3.4% year on year.


According to statistics by MOFCOM, in January – August 2012, Chinese
investors made direct investment overseas in 2708 enterprises in 119
countries and regions, with total non-financial direct investment
overseas amounted to US$ 47.68 billion, up by 39.4% year-on-year.


                                                                    28
China’s investments are growing in frequency and in diversity across
sectors.


2012 has brought a variety of transactions, from Shandong Heavy
Industry’s buyout of Italian yacht maker Ferretti, to Shanghai Bright
Food Group’s investment in England’s Weetabix breakfast
brand, and most notably, here in the U.S., where Dalian Wanda
purchased the AMC movie theater chain.


                                                                  29
According to the Rhodium Group, a policy think
tank, Chinese investment in the European Union
reached $10 billion in 2011.

Chinese investment increase dramatically
  from a total of $3 billion in all of 2011 to $8 billion later
  part of 2012


                                                                  30
CHINA

       GOVERNMENT SPENDING


                                                   31
Source: The National Bureau of Statistics, China
CHINA

GOVERNMENT REVENUE


                     32
GOVERNMENT REVENUE


                     33
GDP is worth $7298 US billion dollars.

GDP Annual Growth is around 7.4% as on Oct 2012.

Sources of China’s Revenue comes from taxes through
consumption, corporate income, personal income and
imports.


                                                      34
CHINA

CHINA’S EXPENDITURE


                      35
CHINA’S EXPENDITURE

                     Society,Culture and
      20%            Education
               27%   Economy
                     Development
                     National Defence

19%
                     Administrative
                     Expenses
             27%
        7%           Others


                                      36
China’s Government Spending is around 23% of its GDP.

Main Expenditure spent on
society, culture, education, National defense and other
administrative expenses.

national defense is comparably decreased slightly from 10%
in 2000 to 7% in 2011.

The reason behind is, it started spending more in building
infrastructure and in Education.
                                                             37
CHINA

EXPORTS VS IMPORTS


                     38
China has Net Exports constitutes 5.4 % of its GDP

The balance trade (Net Exports – Net Imports) has worth
about $325 Billion US dollars.

China exports to countries like U.S., Japan, U.K and South
Korea and imports from U.S., EU, Hong Kong, Japan, ASEAN.

The reason is china wants to grow its economy faster and
wants to appreciate its Currency Yuan in the Global Economy.


                                                             39
CHINA

% CURRENT ACCOUNT


                    40
% Of Current Account Surplus to GDP

12.00%                                                10.60%
                                             9.30%              9.60%
10.00%
 8.00%                              7.10%
                                                                          6%
 6.00%                                                                            5.20%
                           3.60%                                                            4%
 4.00%
         2.40% 2.80%
 2.00%
 0.00%
         Jan-02

                  Jan-03

                           Jan-04

                                    Jan-05

                                             Jan-06

                                                       Jan-07

                                                                Jan-08

                                                                         Jan-09

                                                                                  Jan-10

                                                                                           Jan-11
                                                                                                    41
Current Account is the sum of balance trade, factor income
and cash transfers.

China has Current Account as 4% of its GDP.

China has Current Account Surplus of 59.70 Billion US
dollars.

The Current Account represents the level of China’s
International competitiveness.


                                                         42
CHINA

INFLATION


            43
The inflation rate in China was recorded at 1.7 % in 2012.


                                                             44
Inflation Rates 2012

The prices grew by 1.8 % in cities and 1.5 % in rural areas.

The food prices went up by 1.8 %, while the non-food prices
increased by 1.7 %.

The prices of consumer goods went up by 1.5 % and the
prices of services grew by 2.3 %.

The overall consumer prices were up by 2.7 % over the same
period of the previous year.


                                                               45
Reasons For Lower Rates

China's economy has been hurt by falling demand for its
exports and a slowdown in investment in the country.

Demand for its exports has been hit by continuing economic
problems in key markets such as the US and Europe.

China has been keen to boost its domestic consumption in a
bid to rebalance its economy and sustain growth.


                                                             46
CHINA

UNEMPLOYMENT


               47
Unemployment rate is 4.1% in 2012


        4.3                                 4.3
 4.3

4.25          4.2   4.2
 4.2

4.15                      4.1   4.1   4.1         4.1   4.1   4.1   4.1   4.1
 4.1

4.05

  4


                                                                                48
Why lower unemployment rate??

China has created 6.94million new job in first six month of
2012
2.94million laid off workers are reemployed in first six month
of 2012
Expansion of labor intensive industries towards central &
western region
Lower tax rate for small industries
Government has taken supportive measure for small & mid
size enterprises


                                                                 49
CHINA

FOREIGN EXCHANGE RESERVES


                            50
Current Reserves – 3.24 trillion USD

Average Foreign Exchange Reserves – 525258.41 Million USD

Highest Value – 3.3 trillion USD ( Feb 2012)

Lowest Value - 2262.0 million USD (Dec 1980)

Status – Continuously Growing since 1980


                                                        51
Reasons for Continuous Growth of Forex

Increase in capital items

FDI
 -185.1 Billion USD (2010)
 - 3.1% of GDP (2010)

Foreign Debt
 - 25% of US Foreign Debts
Exports
 - 31.4 % of GDP in 2010 ( 1.86 Trillion USD)


                                                52
Current Trend
China is cutting back its purchases of US securities as it seeks to diversify
away from the dollar ( 54 % )

China’s FDI inflow declined by 3.45 % - Reuters

Exports declined from to 8.8% in 2011 ( 644 million USD )

China faces crisis without economic reforms - World Bank


                                                                                53
CHINA

FISCAL POLICY 2012


                     56
• National revenue is 11.36($1.82) trillion Yuan, up by 9.5%.

   • Total available national revenue is projected to be 11.63
       trillion Yuan.

   • Total expenditure exceeds total revenue by 800($128.45)
       billion Yuan (including the 550($88.31) billion Yuan central
       government deficit), 50($8.02) billion Yuan less than last year
       and bringing the deficit down to approximately 1.5% of GDP.


Source :China NPC & CPPCC Sessions 2012                                  57
CHINA

FOCUS AREAS OF FISCAL POLICY


                               58
Improve structural tax cut policies to
reduce the burden on businesses and
consumers.
  By reducing tax and implementing new VAT policies to help
  out small and low profit businesses.


                                                          59
Increase people's incomes to boost
their purchasing power.
 By put into effect a more proactive employment
 policy, and implement the minimum wage system and by
 increasing government subsidies to raise the incomes of
 urban and rural residents.


                                                           60
Optimize the structure of government
       spending to maintain and improve
       living standards.
               Direct more funds toward the primary level, rural and
            remote areas, and groups with financial difficulties; and
            more quickly develop education, medical and health
            care, social security, employment, low-income
            housing, public culture, and other social programs.


Source: National Bureau of Statistics of China                          61
CHINA

POLICIES IN ACTION


                     62
Investors who hold publicly listed shares for more than one
year will only be liable to pay a 5 % tax on any dividends
earned, down by 5 % from the current rate of 10 %.


To discourage speculative trading, individuals who hold
securities for less than one month will face an increased tax
on dividend of 20 %.


                                                                63
The Chinese government is shifting from creating preferential

policies for foreign investors towards instead favouring its

local labor pool due to the country’s widening income gap.

Wage hikes will boost domestic consumption to keep the

country’s economy expanding while overseas markets remain

weak.


                                                               64
China’s Ministry of Human Resources and Social Security
revealed the latest minimum wage levels across China .


Minimum wage levels of more than 1,000 Yuan($160.56).


                                                          65
CHINA

FINANCIAL SYSTEM


                   66
STRUCTURE OF BANKING SECTOR


                              67
68
MARKET SHARE IN BANKING SECTOR


                                 69
REASONS FOR HEALTHY FINANCIAL
           SYSTEM
The assets of the banking sector account for around 95 % of
the total assets of all financial institutions in China.

62 % of the fixed-asset investment in China are funded by
banking Sector.

The big four SOE banks are the major players in the Chinese
financial market, with their assets accounting for 52.7 % of
the total bank assets in China.


                                                               70
REASONS FOR HEALTHY FINANCIAL
           SYSTEM
 The entire financial system has a high proportion
 of savings and investments of the population.
   The total value of deposits at the end of 2011, it has
   approached to 160% of GDP while the share of these
   deposits used by banks to extend credit in the economy
   of the country was greater than 100% of GDP.


                                                            71
CHINA

COMPARISON WITH INDIA


                        72
India has a “mixed economy” with large private sector .

“capitalist market economy” with the associated tendency to
involuntary unemployment.


China was mostly a command economy, which until recently
had a very small private sector, there is still substantial state
control over macroeconomic processes in forms that have
differed from more conventional capitalist macroeconomic
policy.


                                                                    73
TREND OF DEVELOPMENT
The trend of transformation from divided operation to
integrated operation has emerged. Eg: CITIC Group, BOC
Group, Ping An Insurance Group


                                                         74
Support Stable And Fairly Rapid Growth


CHINA

MONETARY POLICY


                                    75
Challenges
Inflationary pressure
  Due to local governments’ crave for growth and strong demand for the
  expansion of investment as well as the supply of money and credit.

Agricultural Sector
Development of Rural Areas
Stabilize Employment Situation
Internal Drivers Are Yet To Be Strengthened
Slowing Real Estate Sector

                                                                    76
Flexible Open Market Operations
        This Enabled the PBC to moderate the fluctuations in liquidity
        supply and demand caused by seasonal factors and market
        developments, ensuring that liquidity in the banking system
        remained stable.

   Reserve Requirement Ratio
        Raised reserve requirement ratio 6 times by a total of 3 %
        points in 2011


                                                                 77
Source: China Financial Stability Report 2012
Dynamic                Adjustment              Of    Differentiated
       Reserve Requirement Ratios
            Counter-cyclical tool               enhance coordination between
            credit policy and industrial policy.
            Encourage financial institutions to optimize the credit
            structure, and to boost credit support to SME.
            The Agricultural sector, farmers, rural areas, and on-
            going and follow-up key national projects.
            Promoted innovation in rural financial products.


                                                                          78
Source: China Financial Stability Report 2012
Leveraging Role Of Interest Rate
            Raised deposit and lending rates of financial
            institutions 3 consecutive times.


                                                        79
Source: China Financial Stability Report 2012
Exchange Rate Regime
            Enhanced exchange rate flexibility,
            Equilibrium level based on market supply and demand in
            reference to a basket of currencies
            Increased the floating band from .5% to 1% both direction


       Total Financing
            Introduced to the real economy was as an intermediate
            variable for monitoring.


                                                                    80
Source: China Financial Stability Report 2012
CHINA

KEY IMPLICATIONS


                   82
The declining growth of the labour force year
after year
Stronger resource and environmental
Constraints


                                                83
84

China irg

  • 1.
    CHINA MACRO ECONOMICS GROUP 1 I MBA A MBA A G1 1
  • 2.
    Prepared By: •Aarathy Jayakrishnan •AgilV Joseph •Amrita Banerjee •Anantha Kumar G M R •Anuroop •Arun S •Ashis Kumar Nayak •Avinnash B Premanand •Babish Kumar P M •Venkatraman S •Pooja Chhotray 2
  • 3.
  • 4.
    People's Republic ofChina. World's most Populous country Single-party state governed by the Communist Party of China 4
  • 5.
    Introduction of economicreforms in 1978 World's fastest-growing major economy It is the world's second-largest economy United Nations member since 1971 5
  • 6.
  • 7.
    7298.10 billion USdollars in 2011 Equivalent to 11.77 % of the world economy Source: http://www.tradingeconomics.com/china/gdp 7
  • 8.
  • 9.
  • 10.
    Chinese GDP grewby 7.4% in quarter 3 down from 7.6% in quarter 2 It represents A sharp slowdown for china, where GDP grew 9.2 % in 2011 and has averaged an annual rate of around 10 % for three decades. Growth is lower than the 9%-10% range from 2008 to 2011 10
  • 11.
  • 12.
    CHINA REASONS FOR LOWGROWTH RATE 12
  • 13.
  • 14.
    Fall in Exportsand Imports Exports grew 2.7 % year-on-year, less than the 3 % forecast reflecting global financial crisis Threats from India, Vietnam and Pakistan offering similar goods at lower prices Imports fell 2.6 % against expectations of 3.5 increase due to weaker domestic demand Fall in Purchasing Managers Index The PMI index is based on five major indicators: new orders, inventory levels, production, supplier deliveries and the employment environment PMI fell to 47.8 the lowest since March 2009 caused by inventories climbing up and export orders falling National Bureau of Statistics Source:http://www.ibtimes.co.uk/articles/382407/20120910/china-economy-exports-imports.htm 14
  • 15.
  • 16.
    Fall in Industrialoutput Industrial output growth slowed to 8.9% below market forecasts of a 9.1 % due to slowing new orders Surveys suggest that manufacturers will run inventories down further before they can begin to turn production up again The growth rate in industrial electricity production, after spiking early this year, has fallen back sharply to near zero growth due to decelerating industrial activity 16
  • 17.
  • 18.
    Real estate investment collapse Real estate investment, which is a large part of fixed asset investment, is not picking up due to changing Government policies Low average household consumption Rise in household savings Young families aspiring for home ownership Poor access to insurance claims and loans 18
  • 19.
    GDP PER CAPITA GDPper capita rose from $1135 in 2002 to $5432 in 2011 with an average annual growth of 16.7% The GDP per Capita in China is equivalent to 21 % of the world's average 20
  • 20.
  • 21.
    China’s consumers spendingmore than previously believed- according to the latest revisions to the country’s economic data. Household spending increased by about $126 billion spread over eight years.  NBS found that household expenditure was revised up to 11.06 trillion Yuan, an increase of 220.23 billion Yuan.  China will be the world’s second largest consumer market by 2015 (currently number three behind the U.S. and Japan) 24
  • 22.
    CHINA OTHER ASPECTS OFCHINESE CONSUMPTION 25
  • 23.
    China is tryingto diversify its reserve holdings Buying more Japanese yen and Korean won. Diversify PBC holdings has had no disruptive affect on the US Treasury market. There is more income inequality. 26
  • 24.
  • 25.
     According tothe statistics of news release of foreign investment, from January to August 2012, the actual use of foreign investment reached US$ 74.994 billion, down by 3.4% year on year. According to statistics by MOFCOM, in January – August 2012, Chinese investors made direct investment overseas in 2708 enterprises in 119 countries and regions, with total non-financial direct investment overseas amounted to US$ 47.68 billion, up by 39.4% year-on-year. 28
  • 26.
    China’s investments aregrowing in frequency and in diversity across sectors. 2012 has brought a variety of transactions, from Shandong Heavy Industry’s buyout of Italian yacht maker Ferretti, to Shanghai Bright Food Group’s investment in England’s Weetabix breakfast brand, and most notably, here in the U.S., where Dalian Wanda purchased the AMC movie theater chain. 29
  • 27.
    According to theRhodium Group, a policy think tank, Chinese investment in the European Union reached $10 billion in 2011. Chinese investment increase dramatically from a total of $3 billion in all of 2011 to $8 billion later part of 2012 30
  • 28.
    CHINA GOVERNMENT SPENDING 31 Source: The National Bureau of Statistics, China
  • 29.
  • 30.
  • 31.
    GDP is worth$7298 US billion dollars. GDP Annual Growth is around 7.4% as on Oct 2012. Sources of China’s Revenue comes from taxes through consumption, corporate income, personal income and imports. 34
  • 32.
  • 33.
    CHINA’S EXPENDITURE Society,Culture and 20% Education 27% Economy Development National Defence 19% Administrative Expenses 27% 7% Others 36
  • 34.
    China’s Government Spendingis around 23% of its GDP. Main Expenditure spent on society, culture, education, National defense and other administrative expenses. national defense is comparably decreased slightly from 10% in 2000 to 7% in 2011. The reason behind is, it started spending more in building infrastructure and in Education. 37
  • 35.
  • 36.
    China has NetExports constitutes 5.4 % of its GDP The balance trade (Net Exports – Net Imports) has worth about $325 Billion US dollars. China exports to countries like U.S., Japan, U.K and South Korea and imports from U.S., EU, Hong Kong, Japan, ASEAN. The reason is china wants to grow its economy faster and wants to appreciate its Currency Yuan in the Global Economy. 39
  • 37.
  • 38.
    % Of CurrentAccount Surplus to GDP 12.00% 10.60% 9.30% 9.60% 10.00% 8.00% 7.10% 6% 6.00% 5.20% 3.60% 4% 4.00% 2.40% 2.80% 2.00% 0.00% Jan-02 Jan-03 Jan-04 Jan-05 Jan-06 Jan-07 Jan-08 Jan-09 Jan-10 Jan-11 41
  • 39.
    Current Account isthe sum of balance trade, factor income and cash transfers. China has Current Account as 4% of its GDP. China has Current Account Surplus of 59.70 Billion US dollars. The Current Account represents the level of China’s International competitiveness. 42
  • 40.
  • 41.
    The inflation ratein China was recorded at 1.7 % in 2012. 44
  • 42.
    Inflation Rates 2012 Theprices grew by 1.8 % in cities and 1.5 % in rural areas. The food prices went up by 1.8 %, while the non-food prices increased by 1.7 %. The prices of consumer goods went up by 1.5 % and the prices of services grew by 2.3 %. The overall consumer prices were up by 2.7 % over the same period of the previous year. 45
  • 43.
    Reasons For LowerRates China's economy has been hurt by falling demand for its exports and a slowdown in investment in the country. Demand for its exports has been hit by continuing economic problems in key markets such as the US and Europe. China has been keen to boost its domestic consumption in a bid to rebalance its economy and sustain growth. 46
  • 44.
  • 45.
    Unemployment rate is4.1% in 2012 4.3 4.3 4.3 4.25 4.2 4.2 4.2 4.15 4.1 4.1 4.1 4.1 4.1 4.1 4.1 4.1 4.1 4.05 4 48
  • 46.
    Why lower unemploymentrate?? China has created 6.94million new job in first six month of 2012 2.94million laid off workers are reemployed in first six month of 2012 Expansion of labor intensive industries towards central & western region Lower tax rate for small industries Government has taken supportive measure for small & mid size enterprises 49
  • 47.
  • 48.
    Current Reserves –3.24 trillion USD Average Foreign Exchange Reserves – 525258.41 Million USD Highest Value – 3.3 trillion USD ( Feb 2012) Lowest Value - 2262.0 million USD (Dec 1980) Status – Continuously Growing since 1980 51
  • 49.
    Reasons for ContinuousGrowth of Forex Increase in capital items FDI -185.1 Billion USD (2010) - 3.1% of GDP (2010) Foreign Debt - 25% of US Foreign Debts Exports - 31.4 % of GDP in 2010 ( 1.86 Trillion USD) 52
  • 50.
    Current Trend China iscutting back its purchases of US securities as it seeks to diversify away from the dollar ( 54 % ) China’s FDI inflow declined by 3.45 % - Reuters Exports declined from to 8.8% in 2011 ( 644 million USD ) China faces crisis without economic reforms - World Bank 53
  • 51.
  • 52.
    • National revenueis 11.36($1.82) trillion Yuan, up by 9.5%. • Total available national revenue is projected to be 11.63 trillion Yuan. • Total expenditure exceeds total revenue by 800($128.45) billion Yuan (including the 550($88.31) billion Yuan central government deficit), 50($8.02) billion Yuan less than last year and bringing the deficit down to approximately 1.5% of GDP. Source :China NPC & CPPCC Sessions 2012 57
  • 53.
    CHINA FOCUS AREAS OFFISCAL POLICY 58
  • 54.
    Improve structural taxcut policies to reduce the burden on businesses and consumers. By reducing tax and implementing new VAT policies to help out small and low profit businesses. 59
  • 55.
    Increase people's incomesto boost their purchasing power. By put into effect a more proactive employment policy, and implement the minimum wage system and by increasing government subsidies to raise the incomes of urban and rural residents. 60
  • 56.
    Optimize the structureof government spending to maintain and improve living standards. Direct more funds toward the primary level, rural and remote areas, and groups with financial difficulties; and more quickly develop education, medical and health care, social security, employment, low-income housing, public culture, and other social programs. Source: National Bureau of Statistics of China 61
  • 57.
  • 58.
    Investors who holdpublicly listed shares for more than one year will only be liable to pay a 5 % tax on any dividends earned, down by 5 % from the current rate of 10 %. To discourage speculative trading, individuals who hold securities for less than one month will face an increased tax on dividend of 20 %. 63
  • 59.
    The Chinese governmentis shifting from creating preferential policies for foreign investors towards instead favouring its local labor pool due to the country’s widening income gap. Wage hikes will boost domestic consumption to keep the country’s economy expanding while overseas markets remain weak. 64
  • 60.
    China’s Ministry ofHuman Resources and Social Security revealed the latest minimum wage levels across China . Minimum wage levels of more than 1,000 Yuan($160.56). 65
  • 61.
  • 62.
  • 63.
  • 64.
    MARKET SHARE INBANKING SECTOR 69
  • 65.
    REASONS FOR HEALTHYFINANCIAL SYSTEM The assets of the banking sector account for around 95 % of the total assets of all financial institutions in China. 62 % of the fixed-asset investment in China are funded by banking Sector. The big four SOE banks are the major players in the Chinese financial market, with their assets accounting for 52.7 % of the total bank assets in China. 70
  • 66.
    REASONS FOR HEALTHYFINANCIAL SYSTEM The entire financial system has a high proportion of savings and investments of the population. The total value of deposits at the end of 2011, it has approached to 160% of GDP while the share of these deposits used by banks to extend credit in the economy of the country was greater than 100% of GDP. 71
  • 67.
  • 68.
    India has a“mixed economy” with large private sector . “capitalist market economy” with the associated tendency to involuntary unemployment. China was mostly a command economy, which until recently had a very small private sector, there is still substantial state control over macroeconomic processes in forms that have differed from more conventional capitalist macroeconomic policy. 73
  • 69.
    TREND OF DEVELOPMENT Thetrend of transformation from divided operation to integrated operation has emerged. Eg: CITIC Group, BOC Group, Ping An Insurance Group 74
  • 70.
    Support Stable AndFairly Rapid Growth CHINA MONETARY POLICY 75
  • 71.
    Challenges Inflationary pressure Due to local governments’ crave for growth and strong demand for the expansion of investment as well as the supply of money and credit. Agricultural Sector Development of Rural Areas Stabilize Employment Situation Internal Drivers Are Yet To Be Strengthened Slowing Real Estate Sector 76
  • 72.
    Flexible Open MarketOperations This Enabled the PBC to moderate the fluctuations in liquidity supply and demand caused by seasonal factors and market developments, ensuring that liquidity in the banking system remained stable. Reserve Requirement Ratio Raised reserve requirement ratio 6 times by a total of 3 % points in 2011 77 Source: China Financial Stability Report 2012
  • 73.
    Dynamic Adjustment Of Differentiated Reserve Requirement Ratios Counter-cyclical tool enhance coordination between credit policy and industrial policy. Encourage financial institutions to optimize the credit structure, and to boost credit support to SME. The Agricultural sector, farmers, rural areas, and on- going and follow-up key national projects. Promoted innovation in rural financial products. 78 Source: China Financial Stability Report 2012
  • 74.
    Leveraging Role OfInterest Rate Raised deposit and lending rates of financial institutions 3 consecutive times. 79 Source: China Financial Stability Report 2012
  • 75.
    Exchange Rate Regime Enhanced exchange rate flexibility, Equilibrium level based on market supply and demand in reference to a basket of currencies Increased the floating band from .5% to 1% both direction Total Financing Introduced to the real economy was as an intermediate variable for monitoring. 80 Source: China Financial Stability Report 2012
  • 76.
  • 77.
    The declining growthof the labour force year after year Stronger resource and environmental Constraints 83
  • 78.