Download to read offline


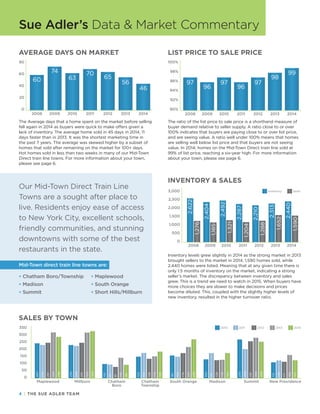
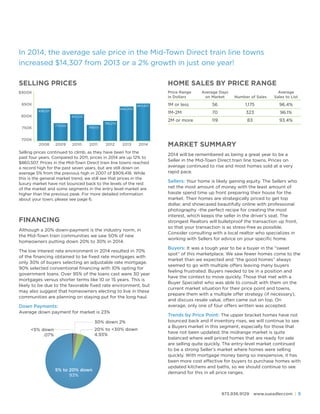


The document provides a real estate market review for Mid-Town Direct Train Line towns in New Jersey. It summarizes 2014 housing market trends, including a 2% rise in average home sale price to $860,507. Homes sold faster in 2014 than in previous years, averaging 46 days on the market. The report also provides more detailed statistics on home sales broken down by individual towns and price brackets.


![[plan politika] Youth movement nowadays](https://cdn.slidesharecdn.com/ss_thumbnails/youthmovementnowadaysfinale-110512001953-phpapp01-110714003107-phpapp02-thumbnail.jpg?width=640&height=640&fit=bounds)


![[plan politika] Indonesian Youth and Politics : Serial Slide Bakal Calon Gube...](https://cdn.slidesharecdn.com/ss_thumbnails/mengenalahokdaridekat-2-111027205203-phpapp01-thumbnail.jpg?width=640&height=640&fit=bounds)


