SlideShare a Scribd company logo
CHAPTER 4
Estimating Costs
Introduction to managerial accounting
Cost classifications
Fixed versus variable
Direct versus indirect (overhead)
Cost behavior
Cost allocation
Activity-based costing
Copyright 2009 Health Administration Press
4 - ‹#›
Managerial Accounting
There are two main areas of accounting:
Financial
Managerial
Financial accounting involves creating financial statements to
report the financial status of the overall business. These
statements are used primarily by outsiders.
Managerial accounting involves creating information for
internal use in managerial decision making. This chapter
focuses on managerial accounting.
Copyright 2009 Health Administration Press
4 - ‹#›
Cost Classifications
Cost measurement is a critical part of managerial accounting.
Unfortunately, there is no single definition of the term cost.
Different costs are used for different purposes.
Costs are classified in two major ways:
By their relationship to volume
By their relationship to the sub-unit being analyzed
Copyright 2009 Health Administration Press
4 - ‹#›
Is there a difference between a cost and an expense?
Discussion Item
Copyright 2009 Health Administration Press
4 - ‹#›
Cost Behavior
The relationship between costs and the volume of services
provided is called cost behavior or underlying cost structure.
If the underlying cost structure is known, managers can forecast
costs at different levels of patient volume.
In this context, costs may be
fixed (independent of volume), or
variable (dependent on volume).
Copyright 2009 Health Administration Press
4 - ‹#›
Cost Behavior (cont.)
In the long-run, all costs are variable; hence, the fixed versus
variable classification can hold only in the short-run—say, for
one year.
Also, no costs are fixed throughout an infinite range of
volumes. Thus, the concept of cost classifications according to
volume must be applied within some relevant range of patient
volume.
Copyright 2009 Health Administration Press
4 - ‹#›
What are some examples of fixed and variable costs for a
hospital’s clinical laboratory?
Discussion Item
Copyright 2009 Health Administration Press
4 - ‹#›
Cost Behavior Example: Walk-In Clinic
Variable Costs Per Visit Fixed Costs Per Year
Clinical supplies $20 Facilities $30,000
Other supplies 5 Salaries 190,000
Variable cost rate $25 Overhead 80,000
$300,000
Total Fixed Variable Total Average
Volume Costs Costs Costs Cost
1 $300,000 $ 25 $300,025 $300,025
100 300,000 2,500 302,500 3,025
200 300,000 5,000 305,000 1,525
1,000 300,000 25,000 325,000 325
5,000 300,000 125,000 425,000 85
10,000 300,000 250,000 550,000 55
25,000 300,000 625,000 925,000 37
Note: The relevant range is this example is unrealistic.
Copyright 2009 Health Administration Press
4 - ‹#›
Cost Behavior Example (cont.)
Consider a volume of 5,000:
Fixed costs = $300,000.
Variable cost rate = $25.
Total variable costs = $125,000.
Total costs = $425,000.
Average cost per visit = $85.
Now consider a volume of 10,000:
Fixed costs = $300,000.
Variable cost rate = $25.
Total variable costs = $250,000.
Total costs = $550,000.
Average cost per visit = $55.
Copyright 2009 Health Administration Press
4 - ‹#›
The average cost per visit decreases as volume increases.
In economics, what is this relationship called?
What characteristic of a business’s cost structure makes this
relationship possible?
Discussion Items
Copyright 2009 Health Administration Press
4 - ‹#›
Graph of Cost Behavior
Costs
($)
Volume
(number of visits)
Total costs
Fixed costs
Total variable costs
Copyright 2009 Health Administration Press
4 - ‹#›
The Second Cost Classification
In addition to their relationship to volume, costs can be
classified by their relationship to the unit of activity:
Direct: costs unique and exclusive to a sub-unit
Indirect, or overhead: costs associated with shared resources
used by the entire organization
Copyright 2009 Health Administration Press
6 - ‹#›
What are some examples of direct and indirect (overhead)
costs for a hospital’s clinical laboratory?
Discussion Item
Copyright 2009 Health Administration Press
6 - ‹#›
Cost Allocation
The purpose of cost allocation is to assign all overhead costs to
the departments that create the need for such costs, typically the
patient service departments.
To begin, we must define two terms used in cost allocation:
Cost pool
Cost driver
Copyright 2009 Health Administration Press
6 - ‹#›
Cost Pool
A cost pool is the overhead amount to be allocated.
In general, a cost pool consists of the direct costs of one
overhead department.
However, if the costs of a single overhead department differ
substantially in nature and are used in different proportions,
multiple cost pools should be used. For example, financial
services overhead might be divided as follows:
Billing and collections cost pool
Budgeting cost pool
Copyright 2009 Health Administration Press
6 - ‹#›
Cost Driver
A cost driver is the basis on which the cost pool will be
allocated.
For example, the cost driver for facilities overhead (building
space depreciation, maintenance, utilities, and so on) might be
the amount of space used by each patient service department.
Copyright 2009 Health Administration Press
6 - ‹#›
Cost Drivers (cont.)
The selection of cost drivers is critical to the cost allocation
process.
Cost drivers should create an allocation that is highly correlated
with the actual amount of overhead services consumed.
Good cost drivers will have two important attributes:
They are perceived as fair.
They promote organizational cost reduction.
Copyright 2009 Health Administration Press
6 - ‹#›
Discussion Items
Overhead cost allocation is a “pain.” Why is it necessary?
Suppose a hospital uses amount of space occupied (square
footage) as the cost driver for the allocation of housekeeping
services. Does this measure have the attributes of a good driver?
Copyright 2009 Health Administration Press
6 - ‹#›
Traditional Allocation Process
1. Identify the cost pool.
The cost pool is the dollar cost of the overhead activity to
be allocated.
To illustrate, assume that a hospital’s housekeeping
department has direct costs of $100,000.
Copyright 2009 Health Administration Press
6 - ‹#›
Traditional Allocation Process (cont.)
2. Determine the cost driver.
The cost driver is the basis on which the overhead costs
will be allocated.
Assume that the cost driver for housekeeping services is
the amount of space occupied. User departments in total occupy
200,000 square feet of space.
Copyright 2009 Health Administration Press
6 - ‹#›
Traditional Allocation Process (cont.)
3. Calculate the allocation rate.
Here, the allocation rate is $100,000 ÷ 200,000 = $.50 per
square foot of space occupied.
Allocation rate = .
Dollars in cost pool
Total volume of cost driver
The allocation rate is the numerical value used to make the
allocation:
Copyright 2009 Health Administration Press
6 - ‹#›
Traditional Allocation Process (cont.)
4. Determine the allocation amount.
Each user department is then allocated some portion of
housekeeping overhead costs.
Assume the critical care department occupies 10,000
square feet of space. Its allocation would be $.50 × 10,000 =
$5,000.
Copyright 2009 Health Administration Press
6 - ‹#›
Allocation Methods
Mechanically, cost allocation can be accomplished in a variety
of ways.
Regardless of the method, all overhead costs must ultimately be
allocated to the departments that create the need for such
costs—the patient service departments.
There are several allocation methods:
Direct method
Step-down method
Reciprocal method
Copyright 2009 Health Administration Press
6 - ‹#›
Allocation Methods (cont.)
In the direct method, the costs of each support department are
allocated directly to, and only to, the patient services
departments.
In the step-down method, some (but not all) of the intra-support
department relationships are recognized. This method is more
complex than the direct method but still manageable.
Copyright 2009 Health Administration Press
6 - ‹#›
Allocation Methods (cont.)
The reciprocal method recognizes all of the support department
interrelationships, but it requires a system of simultaneous
equations or a complex set of iterative calculations.
Which method is used most commonly in practice?
Copyright 2009 Health Administration Press
6 - ‹#›
Direct Method (DM) Illustration (Situation)
Consider the direct cost allocation system used at Mercy
Hospital.
To simplify the illustration, we have reduced the number of
departments to four:
Support (overhead) departments
Facilities services
General administration
Patient services departments
Routine care
Critical care
Copyright 2009 Health Administration Press
6 - ‹#›
DM Illustration
(Situation cont.)
Mercy uses the following cost drivers:
The cost driver for the facilities services cost pool is the
amount of space used by each patient services department.
The cost driver for the general administration cost pool is the
amount of revenue generated by each patient services
department.
Copyright 2009 Health Administration Press
6 - ‹#›
DM Illustration (Data)
Projected Revenues by Patient Services Department
Routine care $22,000,000
Critical care 5,000,000
Total revenues $27,000,000
Projected Costs for All Departments:
Patient Service Departments (Direct Costs)
Routine care $ 8,300,000
Critical care 3,300,000
Total direct costs $11,600,000
Copyright 2009 Health Administration Press
6 - ‹#›
DM Illustration (Data)
Projected Costs for All Departments (cont.):
Support Departments (Direct Costs)*
Facilities services $ 8,600,000
General administration 5,250,000
Total overhead costs $13,850,000
Total costs of both patient
and support services $25,450,000
Projected overall profit $ 1,550,000
*Note: The direct costs of the support departments will become
the overhead costs of the patient services departments.
Copyright 2009 Health Administration Press
6 - ‹#›
DM Illustration (Data)
Selected Patient Services Department Data
Square Feet Revenue
Routine care 261,000 $22,000,000
Critical care 39,600 5,000,000
Total 300,600 $27,000,000
Why aren’t the support departments listed here?
Copyright 2009 Health Administration Press
6 - ‹#›
DM Illustration (Allocation Rates)
Facilities Services
$8,600,000 in overhead costs to be allocated across
quare
foot. This is the allocation rate.
General Administration
$5,250,000 in overhead costs to be allocated across
$.194 per revenue dollar.
Copyright 2009 Health Administration Press
6 - ‹#›
DM Illustration (Allocation Amounts)
From facilities services:
To routine care
$28.61 × 261,000 = $7,467,066
To critical care
$28.61 × 39,600 = $1,132,934
$8,600,000
Copyright 2009 Health Administration Press
6 - ‹#›
32
DM Illustration (Allocation Amounts)
From general administration:
To routine care
$.194 × 22,000,000 = $4,277,778
To critical care
$.194 × 5,000,000 = $ 972,222
$5,250,000
Copyright 2009 Health Administration Press
6 - ‹#›
DM Illustration (P&L Statements)
Routine Care Margin
Revenues $22,000,000
Direct costs 8,300,000
Profit on direct costs $13,700,000 62.3%
Indirect costs:
Facilities services 7,467,066
General administration 4,277,778
Profit on total (full) costs $ 1,955,156 8.8%
Critical Care
Revenues $ 5,000,000
Direct costs 3,300,000
Profit on direct costs $ 1,700,000 34.0%
Indirect costs:
Facilities services 1,132,934
General administration 972,222
Profit on total (full) costs −$ 405,156 −8.1%
Copyright 2009 Health Administration Press
6 - ‹#›
Discussion Items
Suppose you are the critical care department head at Mercy
Hospital. Your bonus depends on good financial performance.
What would be your reaction to the allocation results?
What would be your first line of defense?
Copyright 2009 Health Administration Press
6 - ‹#›
Activity-Based Costing (ABC)
Unlike traditional cost allocation, which is a top-down system,
activity-based costing (ABC) begins with the individual
activities that compose the services provided.
Although it is useful for costing individual services, it requires
more information and is more complex than traditional costing.
Copyright 2009 Health Administration Press
6 - ‹#›
ABC Illustration
Assume a physician practice does only executive physicals,
which (ignoring lab tests) consist of three separate activities:
Patient check-in
Physical examination (minor or major)
Report and consultation
The following slide contains the ABC analysis for the practice.
Copyright 2009 Health Administration Press
6 - ‹#›
ABC Illustration (cont.)
Annual Activity Data
Allocation
Costs Driver Minor Major Total Rate
Check-in $ 25,000 Exams 1,500 500 2,000
$12.50
Physical exam 300,000 Minutes 60 120 150,000
2.00
Report/consult 75,000 Minutes 30 60 75,000
1.00
$400,000
Minor Exam Major
Exam
Rate Consumption Cost Consumption
Cost
Check-in $12.50 1 $ 12.50 1
$ 12.50
Physical exam 2.00 60 120.00 120
240.00
Report/consult 1.00 30 30.00 60
60.00
Cost per exam $162.50
$312.50
Allocation Rate Calculation
Service Cost Calculation (Per Exam)
Copyright 2009 Health Administration Press
6 - ‹#›
This concludes our discussion of Chapter 4 (Estimating Costs).
Although not all concepts were discussed, you are responsible
for all of the material in the text.
Do you have any questions?
Conclusion
Copyright 2009 Health Administration Press
4 - ‹#›
CHAPTER 4 Estimating CostsIntroduction to managerial account.docx

More Related Content

Similar to CHAPTER 4 Estimating CostsIntroduction to managerial account.docx

Operating BudgetBUDGET SAMPLECurrent YearNew Budget DifferenceCom.docx
Operating BudgetBUDGET SAMPLECurrent YearNew Budget DifferenceCom.docxOperating BudgetBUDGET SAMPLECurrent YearNew Budget DifferenceCom.docx
Operating BudgetBUDGET SAMPLECurrent YearNew Budget DifferenceCom.docx
vannagoforth
 
Cost-Volume-Profit Analysis6©Getty ImagesComstock .docx
Cost-Volume-Profit  Analysis6©Getty ImagesComstock .docxCost-Volume-Profit  Analysis6©Getty ImagesComstock .docx
Cost-Volume-Profit Analysis6©Getty ImagesComstock .docx
faithxdunce63732
 
Cost, volume, profit Analysis. for decision making
Cost, volume, profit Analysis. for decision makingCost, volume, profit Analysis. for decision making
Cost, volume, profit Analysis. for decision making
HAFIDHISAIDI1
 
Assignment Exercise 17–1 Variance AnalysisGreenview Hospital op.docx
Assignment Exercise 17–1 Variance AnalysisGreenview Hospital op.docxAssignment Exercise 17–1 Variance AnalysisGreenview Hospital op.docx
Assignment Exercise 17–1 Variance AnalysisGreenview Hospital op.docx
ssuser562afc1
 
Chapter 10Cost Estimation and Cost- Volume-Profit Relati.docx
Chapter 10Cost Estimation and Cost- Volume-Profit Relati.docxChapter 10Cost Estimation and Cost- Volume-Profit Relati.docx
Chapter 10Cost Estimation and Cost- Volume-Profit Relati.docx
keturahhazelhurst
 
Required ResourceTextSchneider, A. (2017). Managerial Accounti.docx
Required ResourceTextSchneider, A. (2017). Managerial Accounti.docxRequired ResourceTextSchneider, A. (2017). Managerial Accounti.docx
Required ResourceTextSchneider, A. (2017). Managerial Accounti.docx
audeleypearl
 
cost analysis of a hospital
cost analysis of a hospitalcost analysis of a hospital
cost analysis of a hospital
Mahesh Dahal
 
Assignment Exercise 13–2 Trend AnalysisRefer to the Metropolis H.docx
Assignment Exercise 13–2 Trend AnalysisRefer to the Metropolis H.docxAssignment Exercise 13–2 Trend AnalysisRefer to the Metropolis H.docx
Assignment Exercise 13–2 Trend AnalysisRefer to the Metropolis H.docx
faithxdunce63732
 

Similar to CHAPTER 4 Estimating CostsIntroduction to managerial account.docx (18)

Cost allocation
Cost allocationCost allocation
Cost allocation
 
Operating BudgetBUDGET SAMPLECurrent YearNew Budget DifferenceCom.docx
Operating BudgetBUDGET SAMPLECurrent YearNew Budget DifferenceCom.docxOperating BudgetBUDGET SAMPLECurrent YearNew Budget DifferenceCom.docx
Operating BudgetBUDGET SAMPLECurrent YearNew Budget DifferenceCom.docx
 
2.Chapter two.pptx
2.Chapter two.pptx2.Chapter two.pptx
2.Chapter two.pptx
 
Cost-Volume-Profit Analysis6©Getty ImagesComstock .docx
Cost-Volume-Profit  Analysis6©Getty ImagesComstock .docxCost-Volume-Profit  Analysis6©Getty ImagesComstock .docx
Cost-Volume-Profit Analysis6©Getty ImagesComstock .docx
 
Chapter 7
Chapter 7Chapter 7
Chapter 7
 
Cost, volume, profit Analysis. for decision making
Cost, volume, profit Analysis. for decision makingCost, volume, profit Analysis. for decision making
Cost, volume, profit Analysis. for decision making
 
Assignment Exercise 17–1 Variance AnalysisGreenview Hospital op.docx
Assignment Exercise 17–1 Variance AnalysisGreenview Hospital op.docxAssignment Exercise 17–1 Variance AnalysisGreenview Hospital op.docx
Assignment Exercise 17–1 Variance AnalysisGreenview Hospital op.docx
 
Chapter 10Cost Estimation and Cost- Volume-Profit Relati.docx
Chapter 10Cost Estimation and Cost- Volume-Profit Relati.docxChapter 10Cost Estimation and Cost- Volume-Profit Relati.docx
Chapter 10Cost Estimation and Cost- Volume-Profit Relati.docx
 
The Business of Facilities Management Benchmarking
The Business of Facilities Management BenchmarkingThe Business of Facilities Management Benchmarking
The Business of Facilities Management Benchmarking
 
Required ResourceTextSchneider, A. (2017). Managerial Accounti.docx
Required ResourceTextSchneider, A. (2017). Managerial Accounti.docxRequired ResourceTextSchneider, A. (2017). Managerial Accounti.docx
Required ResourceTextSchneider, A. (2017). Managerial Accounti.docx
 
cost analysis of a hospital
cost analysis of a hospitalcost analysis of a hospital
cost analysis of a hospital
 
Overhead
OverheadOverhead
Overhead
 
Joint costing
Joint costingJoint costing
Joint costing
 
cost accounting complete
cost accounting completecost accounting complete
cost accounting complete
 
Bus 7800 week 5 cost allocations
Bus 7800 week 5 cost allocationsBus 7800 week 5 cost allocations
Bus 7800 week 5 cost allocations
 
Cost Accounting presentation
Cost Accounting presentationCost Accounting presentation
Cost Accounting presentation
 
Assignment Exercise 13–2 Trend AnalysisRefer to the Metropolis H.docx
Assignment Exercise 13–2 Trend AnalysisRefer to the Metropolis H.docxAssignment Exercise 13–2 Trend AnalysisRefer to the Metropolis H.docx
Assignment Exercise 13–2 Trend AnalysisRefer to the Metropolis H.docx
 
Cost theory
Cost theoryCost theory
Cost theory
 

More from robertad6

Chapter 8 Religion and the Restoration of Health in Afric.docx
Chapter 8  Religion and the Restoration of Health in Afric.docxChapter 8  Religion and the Restoration of Health in Afric.docx
Chapter 8 Religion and the Restoration of Health in Afric.docx
robertad6
 
Chapter 7Victimology and Patterns of VictimizationThe a.docx
Chapter 7Victimology and Patterns of VictimizationThe a.docxChapter 7Victimology and Patterns of VictimizationThe a.docx
Chapter 7Victimology and Patterns of VictimizationThe a.docx
robertad6
 
Chapter 7Thinking and IntelligenceFigure 7.1 Thinking .docx
Chapter 7Thinking and IntelligenceFigure 7.1 Thinking .docxChapter 7Thinking and IntelligenceFigure 7.1 Thinking .docx
Chapter 7Thinking and IntelligenceFigure 7.1 Thinking .docx
robertad6
 
Chapter 7The Problem of EvilOf all the objections to theism pr.docx
Chapter 7The Problem of EvilOf all the objections to theism pr.docxChapter 7The Problem of EvilOf all the objections to theism pr.docx
Chapter 7The Problem of EvilOf all the objections to theism pr.docx
robertad6
 
Chapter 7Social Networking,Engagement, andSocial Metrics.docx
Chapter 7Social Networking,Engagement, andSocial Metrics.docxChapter 7Social Networking,Engagement, andSocial Metrics.docx
Chapter 7Social Networking,Engagement, andSocial Metrics.docx
robertad6
 
CHAPTER 7The CPU and MemoryThe Architecture of Comp.docx
CHAPTER 7The CPU and MemoryThe Architecture of Comp.docxCHAPTER 7The CPU and MemoryThe Architecture of Comp.docx
CHAPTER 7The CPU and MemoryThe Architecture of Comp.docx
robertad6
 
Chapter 7QUESTION 1. Which of the following is defin.docx
Chapter 7QUESTION 1. Which of the following is defin.docxChapter 7QUESTION 1. Which of the following is defin.docx
Chapter 7QUESTION 1. Which of the following is defin.docx
robertad6
 
CHAPTER 7Managing Financial OperationsRevenue cycle (bil.docx
CHAPTER 7Managing Financial OperationsRevenue cycle (bil.docxCHAPTER 7Managing Financial OperationsRevenue cycle (bil.docx
CHAPTER 7Managing Financial OperationsRevenue cycle (bil.docx
robertad6
 
CHAPTER 7Primate BehaviorWhat is Meant By Behavior.docx
CHAPTER 7Primate BehaviorWhat is Meant By Behavior.docxCHAPTER 7Primate BehaviorWhat is Meant By Behavior.docx
CHAPTER 7Primate BehaviorWhat is Meant By Behavior.docx
robertad6
 
Chapter 7Medical Care Production and Costs(c) 2012 Cengage.docx
Chapter 7Medical Care Production and Costs(c) 2012 Cengage.docxChapter 7Medical Care Production and Costs(c) 2012 Cengage.docx
Chapter 7Medical Care Production and Costs(c) 2012 Cengage.docx
robertad6
 
Chapter 7Evaluating HRD ProgramsWerner© 2017 Cengage Learn.docx
Chapter 7Evaluating HRD ProgramsWerner© 2017 Cengage Learn.docxChapter 7Evaluating HRD ProgramsWerner© 2017 Cengage Learn.docx
Chapter 7Evaluating HRD ProgramsWerner© 2017 Cengage Learn.docx
robertad6
 
CHAPTER 7INTEREST RATES AND BOND VALUATIONCopyright © 2019 M.docx
CHAPTER 7INTEREST RATES AND BOND VALUATIONCopyright © 2019 M.docxCHAPTER 7INTEREST RATES AND BOND VALUATIONCopyright © 2019 M.docx
CHAPTER 7INTEREST RATES AND BOND VALUATIONCopyright © 2019 M.docx
robertad6
 
CHAPTER 7FriendshipTHE NATURE OF FRIENDSHIPFRIENDSHIP ACROSS T.docx
CHAPTER 7FriendshipTHE NATURE OF FRIENDSHIPFRIENDSHIP ACROSS T.docxCHAPTER 7FriendshipTHE NATURE OF FRIENDSHIPFRIENDSHIP ACROSS T.docx
CHAPTER 7FriendshipTHE NATURE OF FRIENDSHIPFRIENDSHIP ACROSS T.docx
robertad6
 
Chapter 7Lean Thinking and Lean SystemsMcGraw-Hill Ed.docx
Chapter 7Lean Thinking and Lean SystemsMcGraw-Hill Ed.docxChapter 7Lean Thinking and Lean SystemsMcGraw-Hill Ed.docx
Chapter 7Lean Thinking and Lean SystemsMcGraw-Hill Ed.docx
robertad6
 
Chapter 7Food, Nutrition & Obesity PolicyEyler, Chriqui, M.docx
Chapter 7Food, Nutrition & Obesity PolicyEyler, Chriqui, M.docxChapter 7Food, Nutrition & Obesity PolicyEyler, Chriqui, M.docx
Chapter 7Food, Nutrition & Obesity PolicyEyler, Chriqui, M.docx
robertad6
 

More from robertad6 (20)

Chapter 8 Religion and the Restoration of Health in Afric.docx
Chapter 8  Religion and the Restoration of Health in Afric.docxChapter 8  Religion and the Restoration of Health in Afric.docx
Chapter 8 Religion and the Restoration of Health in Afric.docx
 
Chapter 8 - Children of alcoholics often display characteristic tr.docx
Chapter 8 - Children of alcoholics often display characteristic tr.docxChapter 8 - Children of alcoholics often display characteristic tr.docx
Chapter 8 - Children of alcoholics often display characteristic tr.docx
 
Chapter 8 - Review the Siemens AG case study.  Note the importan.docx
Chapter 8 - Review the Siemens AG case study.  Note the importan.docxChapter 8 - Review the Siemens AG case study.  Note the importan.docx
Chapter 8 - Review the Siemens AG case study.  Note the importan.docx
 
Chapter 7Victimology and Patterns of VictimizationThe a.docx
Chapter 7Victimology and Patterns of VictimizationThe a.docxChapter 7Victimology and Patterns of VictimizationThe a.docx
Chapter 7Victimology and Patterns of VictimizationThe a.docx
 
Chapter 7Thinking and IntelligenceFigure 7.1 Thinking .docx
Chapter 7Thinking and IntelligenceFigure 7.1 Thinking .docxChapter 7Thinking and IntelligenceFigure 7.1 Thinking .docx
Chapter 7Thinking and IntelligenceFigure 7.1 Thinking .docx
 
Chapter 7 2. How does a false positive alarm differ from a f.docx
Chapter 7 2. How does a false positive alarm differ from a f.docxChapter 7 2. How does a false positive alarm differ from a f.docx
Chapter 7 2. How does a false positive alarm differ from a f.docx
 
Chapter 7 covers Corporate Information Security and Privacy Regu.docx
Chapter 7 covers Corporate Information Security and Privacy Regu.docxChapter 7 covers Corporate Information Security and Privacy Regu.docx
Chapter 7 covers Corporate Information Security and Privacy Regu.docx
 
Chapter 7The Problem of EvilOf all the objections to theism pr.docx
Chapter 7The Problem of EvilOf all the objections to theism pr.docxChapter 7The Problem of EvilOf all the objections to theism pr.docx
Chapter 7The Problem of EvilOf all the objections to theism pr.docx
 
Chapter 7Social Networking,Engagement, andSocial Metrics.docx
Chapter 7Social Networking,Engagement, andSocial Metrics.docxChapter 7Social Networking,Engagement, andSocial Metrics.docx
Chapter 7Social Networking,Engagement, andSocial Metrics.docx
 
CHAPTER 7The CPU and MemoryThe Architecture of Comp.docx
CHAPTER 7The CPU and MemoryThe Architecture of Comp.docxCHAPTER 7The CPU and MemoryThe Architecture of Comp.docx
CHAPTER 7The CPU and MemoryThe Architecture of Comp.docx
 
Chapter 7QUESTION 1. Which of the following is defin.docx
Chapter 7QUESTION 1. Which of the following is defin.docxChapter 7QUESTION 1. Which of the following is defin.docx
Chapter 7QUESTION 1. Which of the following is defin.docx
 
Chapter 7One pageAPA stylePlease comment on the followin.docx
Chapter 7One pageAPA stylePlease comment on the followin.docxChapter 7One pageAPA stylePlease comment on the followin.docx
Chapter 7One pageAPA stylePlease comment on the followin.docx
 
CHAPTER 7Managing Financial OperationsRevenue cycle (bil.docx
CHAPTER 7Managing Financial OperationsRevenue cycle (bil.docxCHAPTER 7Managing Financial OperationsRevenue cycle (bil.docx
CHAPTER 7Managing Financial OperationsRevenue cycle (bil.docx
 
CHAPTER 7Primate BehaviorWhat is Meant By Behavior.docx
CHAPTER 7Primate BehaviorWhat is Meant By Behavior.docxCHAPTER 7Primate BehaviorWhat is Meant By Behavior.docx
CHAPTER 7Primate BehaviorWhat is Meant By Behavior.docx
 
Chapter 7Medical Care Production and Costs(c) 2012 Cengage.docx
Chapter 7Medical Care Production and Costs(c) 2012 Cengage.docxChapter 7Medical Care Production and Costs(c) 2012 Cengage.docx
Chapter 7Medical Care Production and Costs(c) 2012 Cengage.docx
 
Chapter 7Evaluating HRD ProgramsWerner© 2017 Cengage Learn.docx
Chapter 7Evaluating HRD ProgramsWerner© 2017 Cengage Learn.docxChapter 7Evaluating HRD ProgramsWerner© 2017 Cengage Learn.docx
Chapter 7Evaluating HRD ProgramsWerner© 2017 Cengage Learn.docx
 
CHAPTER 7INTEREST RATES AND BOND VALUATIONCopyright © 2019 M.docx
CHAPTER 7INTEREST RATES AND BOND VALUATIONCopyright © 2019 M.docxCHAPTER 7INTEREST RATES AND BOND VALUATIONCopyright © 2019 M.docx
CHAPTER 7INTEREST RATES AND BOND VALUATIONCopyright © 2019 M.docx
 
CHAPTER 7FriendshipTHE NATURE OF FRIENDSHIPFRIENDSHIP ACROSS T.docx
CHAPTER 7FriendshipTHE NATURE OF FRIENDSHIPFRIENDSHIP ACROSS T.docxCHAPTER 7FriendshipTHE NATURE OF FRIENDSHIPFRIENDSHIP ACROSS T.docx
CHAPTER 7FriendshipTHE NATURE OF FRIENDSHIPFRIENDSHIP ACROSS T.docx
 
Chapter 7Lean Thinking and Lean SystemsMcGraw-Hill Ed.docx
Chapter 7Lean Thinking and Lean SystemsMcGraw-Hill Ed.docxChapter 7Lean Thinking and Lean SystemsMcGraw-Hill Ed.docx
Chapter 7Lean Thinking and Lean SystemsMcGraw-Hill Ed.docx
 
Chapter 7Food, Nutrition & Obesity PolicyEyler, Chriqui, M.docx
Chapter 7Food, Nutrition & Obesity PolicyEyler, Chriqui, M.docxChapter 7Food, Nutrition & Obesity PolicyEyler, Chriqui, M.docx
Chapter 7Food, Nutrition & Obesity PolicyEyler, Chriqui, M.docx
 

Recently uploaded

plant breeding methods in asexually or clonally propagated crops
plant breeding methods in asexually or clonally propagated cropsplant breeding methods in asexually or clonally propagated crops
plant breeding methods in asexually or clonally propagated crops
parmarsneha2
 
Industrial Training Report- AKTU Industrial Training Report
Industrial Training Report- AKTU Industrial Training ReportIndustrial Training Report- AKTU Industrial Training Report
Industrial Training Report- AKTU Industrial Training Report
Avinash Rai
 
678020731-Sumas-y-Restas-Para-Colorear.pdf
678020731-Sumas-y-Restas-Para-Colorear.pdf678020731-Sumas-y-Restas-Para-Colorear.pdf
678020731-Sumas-y-Restas-Para-Colorear.pdf
CarlosHernanMontoyab2
 
Additional Benefits for Employee Website.pdf
Additional Benefits for Employee Website.pdfAdditional Benefits for Employee Website.pdf
Additional Benefits for Employee Website.pdf
joachimlavalley1
 

Recently uploaded (20)

plant breeding methods in asexually or clonally propagated crops
plant breeding methods in asexually or clonally propagated cropsplant breeding methods in asexually or clonally propagated crops
plant breeding methods in asexually or clonally propagated crops
 
PART A. Introduction to Costumer Service
PART A. Introduction to Costumer ServicePART A. Introduction to Costumer Service
PART A. Introduction to Costumer Service
 
Industrial Training Report- AKTU Industrial Training Report
Industrial Training Report- AKTU Industrial Training ReportIndustrial Training Report- AKTU Industrial Training Report
Industrial Training Report- AKTU Industrial Training Report
 
Benefits and Challenges of Using Open Educational Resources
Benefits and Challenges of Using Open Educational ResourcesBenefits and Challenges of Using Open Educational Resources
Benefits and Challenges of Using Open Educational Resources
 
Sectors of the Indian Economy - Class 10 Study Notes pdf
Sectors of the Indian Economy - Class 10 Study Notes pdfSectors of the Indian Economy - Class 10 Study Notes pdf
Sectors of the Indian Economy - Class 10 Study Notes pdf
 
Overview on Edible Vaccine: Pros & Cons with Mechanism
Overview on Edible Vaccine: Pros & Cons with MechanismOverview on Edible Vaccine: Pros & Cons with Mechanism
Overview on Edible Vaccine: Pros & Cons with Mechanism
 
NLC-2024-Orientation-for-RO-SDO (1).pptx
NLC-2024-Orientation-for-RO-SDO (1).pptxNLC-2024-Orientation-for-RO-SDO (1).pptx
NLC-2024-Orientation-for-RO-SDO (1).pptx
 
678020731-Sumas-y-Restas-Para-Colorear.pdf
678020731-Sumas-y-Restas-Para-Colorear.pdf678020731-Sumas-y-Restas-Para-Colorear.pdf
678020731-Sumas-y-Restas-Para-Colorear.pdf
 
aaaaaaaaaaaaaaaaaaaaaaaaaaaaaaaaaaaaaaaaa
aaaaaaaaaaaaaaaaaaaaaaaaaaaaaaaaaaaaaaaaaaaaaaaaaaaaaaaaaaaaaaaaaaaaaaaaaaaaaaaaaa
aaaaaaaaaaaaaaaaaaaaaaaaaaaaaaaaaaaaaaaaa
 
Palestine last event orientationfvgnh .pptx
Palestine last event orientationfvgnh .pptxPalestine last event orientationfvgnh .pptx
Palestine last event orientationfvgnh .pptx
 
How to Split Bills in the Odoo 17 POS Module
How to Split Bills in the Odoo 17 POS ModuleHow to Split Bills in the Odoo 17 POS Module
How to Split Bills in the Odoo 17 POS Module
 
Welcome to TechSoup New Member Orientation and Q&A (May 2024).pdf
Welcome to TechSoup   New Member Orientation and Q&A (May 2024).pdfWelcome to TechSoup   New Member Orientation and Q&A (May 2024).pdf
Welcome to TechSoup New Member Orientation and Q&A (May 2024).pdf
 
Instructions for Submissions thorugh G- Classroom.pptx
Instructions for Submissions thorugh G- Classroom.pptxInstructions for Submissions thorugh G- Classroom.pptx
Instructions for Submissions thorugh G- Classroom.pptx
 
MARUTI SUZUKI- A Successful Joint Venture in India.pptx
MARUTI SUZUKI- A Successful Joint Venture in India.pptxMARUTI SUZUKI- A Successful Joint Venture in India.pptx
MARUTI SUZUKI- A Successful Joint Venture in India.pptx
 
Synthetic Fiber Construction in lab .pptx
Synthetic Fiber Construction in lab .pptxSynthetic Fiber Construction in lab .pptx
Synthetic Fiber Construction in lab .pptx
 
Phrasal Verbs.XXXXXXXXXXXXXXXXXXXXXXXXXX
Phrasal Verbs.XXXXXXXXXXXXXXXXXXXXXXXXXXPhrasal Verbs.XXXXXXXXXXXXXXXXXXXXXXXXXX
Phrasal Verbs.XXXXXXXXXXXXXXXXXXXXXXXXXX
 
Basic_QTL_Marker-assisted_Selection_Sourabh.ppt
Basic_QTL_Marker-assisted_Selection_Sourabh.pptBasic_QTL_Marker-assisted_Selection_Sourabh.ppt
Basic_QTL_Marker-assisted_Selection_Sourabh.ppt
 
Basic phrases for greeting and assisting costumers
Basic phrases for greeting and assisting costumersBasic phrases for greeting and assisting costumers
Basic phrases for greeting and assisting costumers
 
Introduction to Quality Improvement Essentials
Introduction to Quality Improvement EssentialsIntroduction to Quality Improvement Essentials
Introduction to Quality Improvement Essentials
 
Additional Benefits for Employee Website.pdf
Additional Benefits for Employee Website.pdfAdditional Benefits for Employee Website.pdf
Additional Benefits for Employee Website.pdf
 

CHAPTER 4 Estimating CostsIntroduction to managerial account.docx

  • 1. CHAPTER 4 Estimating Costs Introduction to managerial accounting Cost classifications Fixed versus variable Direct versus indirect (overhead) Cost behavior Cost allocation Activity-based costing Copyright 2009 Health Administration Press 4 - ‹#› Managerial Accounting There are two main areas of accounting: Financial Managerial Financial accounting involves creating financial statements to report the financial status of the overall business. These statements are used primarily by outsiders. Managerial accounting involves creating information for internal use in managerial decision making. This chapter focuses on managerial accounting. Copyright 2009 Health Administration Press 4 - ‹#›
  • 2. Cost Classifications Cost measurement is a critical part of managerial accounting. Unfortunately, there is no single definition of the term cost. Different costs are used for different purposes. Costs are classified in two major ways: By their relationship to volume By their relationship to the sub-unit being analyzed Copyright 2009 Health Administration Press 4 - ‹#› Is there a difference between a cost and an expense? Discussion Item Copyright 2009 Health Administration Press 4 - ‹#› Cost Behavior The relationship between costs and the volume of services provided is called cost behavior or underlying cost structure. If the underlying cost structure is known, managers can forecast costs at different levels of patient volume. In this context, costs may be fixed (independent of volume), or variable (dependent on volume). Copyright 2009 Health Administration Press
  • 3. 4 - ‹#› Cost Behavior (cont.) In the long-run, all costs are variable; hence, the fixed versus variable classification can hold only in the short-run—say, for one year. Also, no costs are fixed throughout an infinite range of volumes. Thus, the concept of cost classifications according to volume must be applied within some relevant range of patient volume. Copyright 2009 Health Administration Press 4 - ‹#› What are some examples of fixed and variable costs for a hospital’s clinical laboratory? Discussion Item Copyright 2009 Health Administration Press 4 - ‹#› Cost Behavior Example: Walk-In Clinic Variable Costs Per Visit Fixed Costs Per Year Clinical supplies $20 Facilities $30,000 Other supplies 5 Salaries 190,000 Variable cost rate $25 Overhead 80,000
  • 4. $300,000 Total Fixed Variable Total Average Volume Costs Costs Costs Cost 1 $300,000 $ 25 $300,025 $300,025 100 300,000 2,500 302,500 3,025 200 300,000 5,000 305,000 1,525 1,000 300,000 25,000 325,000 325 5,000 300,000 125,000 425,000 85 10,000 300,000 250,000 550,000 55 25,000 300,000 625,000 925,000 37 Note: The relevant range is this example is unrealistic. Copyright 2009 Health Administration Press 4 - ‹#› Cost Behavior Example (cont.) Consider a volume of 5,000: Fixed costs = $300,000. Variable cost rate = $25. Total variable costs = $125,000. Total costs = $425,000. Average cost per visit = $85. Now consider a volume of 10,000: Fixed costs = $300,000. Variable cost rate = $25. Total variable costs = $250,000. Total costs = $550,000.
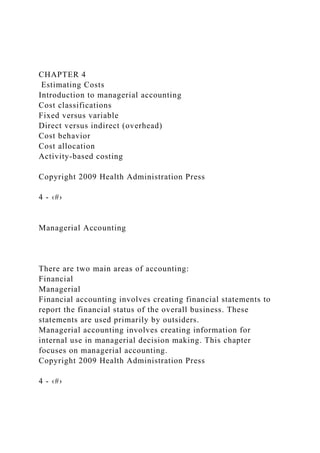
  • 5. Average cost per visit = $55. Copyright 2009 Health Administration Press 4 - ‹#› The average cost per visit decreases as volume increases. In economics, what is this relationship called? What characteristic of a business’s cost structure makes this relationship possible? Discussion Items Copyright 2009 Health Administration Press 4 - ‹#› Graph of Cost Behavior Costs ($) Volume (number of visits) Total costs Fixed costs Total variable costs Copyright 2009 Health Administration Press 4 - ‹#›
  • 6. The Second Cost Classification In addition to their relationship to volume, costs can be classified by their relationship to the unit of activity: Direct: costs unique and exclusive to a sub-unit Indirect, or overhead: costs associated with shared resources used by the entire organization Copyright 2009 Health Administration Press 6 - ‹#› What are some examples of direct and indirect (overhead) costs for a hospital’s clinical laboratory? Discussion Item Copyright 2009 Health Administration Press 6 - ‹#› Cost Allocation The purpose of cost allocation is to assign all overhead costs to the departments that create the need for such costs, typically the patient service departments. To begin, we must define two terms used in cost allocation: Cost pool Cost driver Copyright 2009 Health Administration Press
  • 7. 6 - ‹#› Cost Pool A cost pool is the overhead amount to be allocated. In general, a cost pool consists of the direct costs of one overhead department. However, if the costs of a single overhead department differ substantially in nature and are used in different proportions, multiple cost pools should be used. For example, financial services overhead might be divided as follows: Billing and collections cost pool Budgeting cost pool Copyright 2009 Health Administration Press 6 - ‹#› Cost Driver A cost driver is the basis on which the cost pool will be allocated. For example, the cost driver for facilities overhead (building space depreciation, maintenance, utilities, and so on) might be the amount of space used by each patient service department. Copyright 2009 Health Administration Press 6 - ‹#›
  • 8. Cost Drivers (cont.) The selection of cost drivers is critical to the cost allocation process. Cost drivers should create an allocation that is highly correlated with the actual amount of overhead services consumed. Good cost drivers will have two important attributes: They are perceived as fair. They promote organizational cost reduction. Copyright 2009 Health Administration Press 6 - ‹#› Discussion Items Overhead cost allocation is a “pain.” Why is it necessary? Suppose a hospital uses amount of space occupied (square footage) as the cost driver for the allocation of housekeeping services. Does this measure have the attributes of a good driver? Copyright 2009 Health Administration Press 6 - ‹#› Traditional Allocation Process 1. Identify the cost pool. The cost pool is the dollar cost of the overhead activity to be allocated.
  • 9. To illustrate, assume that a hospital’s housekeeping department has direct costs of $100,000. Copyright 2009 Health Administration Press 6 - ‹#› Traditional Allocation Process (cont.) 2. Determine the cost driver. The cost driver is the basis on which the overhead costs will be allocated. Assume that the cost driver for housekeeping services is the amount of space occupied. User departments in total occupy 200,000 square feet of space. Copyright 2009 Health Administration Press 6 - ‹#› Traditional Allocation Process (cont.) 3. Calculate the allocation rate. Here, the allocation rate is $100,000 ÷ 200,000 = $.50 per square foot of space occupied. Allocation rate = . Dollars in cost pool
  • 10. Total volume of cost driver The allocation rate is the numerical value used to make the allocation: Copyright 2009 Health Administration Press 6 - ‹#› Traditional Allocation Process (cont.) 4. Determine the allocation amount. Each user department is then allocated some portion of housekeeping overhead costs. Assume the critical care department occupies 10,000 square feet of space. Its allocation would be $.50 × 10,000 = $5,000. Copyright 2009 Health Administration Press 6 - ‹#› Allocation Methods Mechanically, cost allocation can be accomplished in a variety of ways. Regardless of the method, all overhead costs must ultimately be allocated to the departments that create the need for such costs—the patient service departments. There are several allocation methods: Direct method Step-down method
  • 11. Reciprocal method Copyright 2009 Health Administration Press 6 - ‹#› Allocation Methods (cont.) In the direct method, the costs of each support department are allocated directly to, and only to, the patient services departments. In the step-down method, some (but not all) of the intra-support department relationships are recognized. This method is more complex than the direct method but still manageable. Copyright 2009 Health Administration Press 6 - ‹#› Allocation Methods (cont.) The reciprocal method recognizes all of the support department interrelationships, but it requires a system of simultaneous equations or a complex set of iterative calculations. Which method is used most commonly in practice? Copyright 2009 Health Administration Press 6 - ‹#› Direct Method (DM) Illustration (Situation)
  • 12. Consider the direct cost allocation system used at Mercy Hospital. To simplify the illustration, we have reduced the number of departments to four: Support (overhead) departments Facilities services General administration Patient services departments Routine care Critical care Copyright 2009 Health Administration Press 6 - ‹#› DM Illustration (Situation cont.) Mercy uses the following cost drivers: The cost driver for the facilities services cost pool is the amount of space used by each patient services department. The cost driver for the general administration cost pool is the amount of revenue generated by each patient services department. Copyright 2009 Health Administration Press 6 - ‹#› DM Illustration (Data)
  • 13. Projected Revenues by Patient Services Department Routine care $22,000,000 Critical care 5,000,000 Total revenues $27,000,000 Projected Costs for All Departments: Patient Service Departments (Direct Costs) Routine care $ 8,300,000 Critical care 3,300,000 Total direct costs $11,600,000 Copyright 2009 Health Administration Press 6 - ‹#› DM Illustration (Data) Projected Costs for All Departments (cont.): Support Departments (Direct Costs)* Facilities services $ 8,600,000 General administration 5,250,000 Total overhead costs $13,850,000 Total costs of both patient and support services $25,450,000
  • 14. Projected overall profit $ 1,550,000 *Note: The direct costs of the support departments will become the overhead costs of the patient services departments. Copyright 2009 Health Administration Press 6 - ‹#› DM Illustration (Data) Selected Patient Services Department Data Square Feet Revenue Routine care 261,000 $22,000,000 Critical care 39,600 5,000,000 Total 300,600 $27,000,000 Why aren’t the support departments listed here? Copyright 2009 Health Administration Press 6 - ‹#› DM Illustration (Allocation Rates) Facilities Services
  • 15. $8,600,000 in overhead costs to be allocated across quare foot. This is the allocation rate. General Administration $5,250,000 in overhead costs to be allocated across $.194 per revenue dollar. Copyright 2009 Health Administration Press 6 - ‹#› DM Illustration (Allocation Amounts) From facilities services: To routine care $28.61 × 261,000 = $7,467,066 To critical care $28.61 × 39,600 = $1,132,934 $8,600,000 Copyright 2009 Health Administration Press 6 - ‹#› 32 DM Illustration (Allocation Amounts)
  • 16. From general administration: To routine care $.194 × 22,000,000 = $4,277,778 To critical care $.194 × 5,000,000 = $ 972,222 $5,250,000 Copyright 2009 Health Administration Press 6 - ‹#› DM Illustration (P&L Statements) Routine Care Margin Revenues $22,000,000 Direct costs 8,300,000 Profit on direct costs $13,700,000 62.3% Indirect costs: Facilities services 7,467,066 General administration 4,277,778 Profit on total (full) costs $ 1,955,156 8.8% Critical Care Revenues $ 5,000,000 Direct costs 3,300,000 Profit on direct costs $ 1,700,000 34.0% Indirect costs: Facilities services 1,132,934 General administration 972,222 Profit on total (full) costs −$ 405,156 −8.1%
  • 17. Copyright 2009 Health Administration Press 6 - ‹#› Discussion Items Suppose you are the critical care department head at Mercy Hospital. Your bonus depends on good financial performance. What would be your reaction to the allocation results? What would be your first line of defense? Copyright 2009 Health Administration Press 6 - ‹#› Activity-Based Costing (ABC) Unlike traditional cost allocation, which is a top-down system, activity-based costing (ABC) begins with the individual activities that compose the services provided. Although it is useful for costing individual services, it requires more information and is more complex than traditional costing. Copyright 2009 Health Administration Press 6 - ‹#› ABC Illustration
  • 18. Assume a physician practice does only executive physicals, which (ignoring lab tests) consist of three separate activities: Patient check-in Physical examination (minor or major) Report and consultation The following slide contains the ABC analysis for the practice. Copyright 2009 Health Administration Press 6 - ‹#› ABC Illustration (cont.) Annual Activity Data Allocation Costs Driver Minor Major Total Rate Check-in $ 25,000 Exams 1,500 500 2,000 $12.50 Physical exam 300,000 Minutes 60 120 150,000 2.00 Report/consult 75,000 Minutes 30 60 75,000 1.00 $400,000 Minor Exam Major Exam Rate Consumption Cost Consumption Cost Check-in $12.50 1 $ 12.50 1
  • 19. $ 12.50 Physical exam 2.00 60 120.00 120 240.00 Report/consult 1.00 30 30.00 60 60.00 Cost per exam $162.50 $312.50 Allocation Rate Calculation Service Cost Calculation (Per Exam) Copyright 2009 Health Administration Press 6 - ‹#› This concludes our discussion of Chapter 4 (Estimating Costs). Although not all concepts were discussed, you are responsible for all of the material in the text. Do you have any questions? Conclusion Copyright 2009 Health Administration Press 4 - ‹#›