SlideShare a Scribd company logo
CHAPTER 4
EXISTING INSTITUTIONAL RURAL CREDIT
STRUCTURE AND TRENDS IN RURAL
CREDIT
INSTITUTIONAL credit system for the rural sector started with
the organisation of co-operative credit societies at the beginning of
the century to emphasise thrift and mutual help. The co-operative
credit system was refurbished in the mid-fifties in the wake of the re-
commendations of the AIRCS Report. Following it, the GOI, the
RBI and the state governments made special efforts to foster the growth
of the co-operative movement. However, co-operative credit could
not be developed uniformly in all parts of the country. Pari passu,
the credit needs of the agricultural sector, which were the primary
concern of co-operatives, increased rapidly due principally to the
biological and technological developments in crop and animal hus-
bandry. Commercial banks were, therefore, inducted into the field of
agricultural credit under the policy of 'social control' over banks in
1967. Subsequent nationalisation of the 14 major scheduled com-
mercial banks, in 1969, carried this process further. As the RCRC
report put it in 1969:
"At the same time, effort in the sphere of rural credit should not
be solely concentrated in the co-operative sector. Go-operatives
should be strengthened, but they would be all the better — and
the farmer better served — if other institutions co-existed with
them in healthy competition."
(R 411)
This approach which has come to be known as the 'multi-
agency approach' provides for commercial banks serving as an addi-
tional source of credit to the rural sector. A later innovation (1975)
was the organisation of Regional Rural Banks (RRBs) in select areas
with their focus exclusively on the small/marginal farmers, agricultural
labourers and rural artisans.
I. OVERALL SET-UP
4.2 Under the multi-agency approach to rural credit, both the co-
operative and commercial banking sectors receive active financial
36
37
and non-financial support from the Central and State Governments
and national level institutions such as the Reserve Bank of India,
the Agricultural Refinance and Development Corporation, the
Industrial Development Bank of India (IDBI), the National Co-
operative Development Corporation (NCDC), etc. Chart 4.1 along-
side presents the existing institutional channels for rural credit. The
field level institutions which provide credit to individual borrowers
consist of (z) primary agricultural co-operative credit societies pro-
viding both short-term and medium-term credit to their members,
{ii) primary co-operative land development banks or branches of
state co-operative land development banks (SLDBs) dispensing long-
term credit to their members, (m) branches of commercial banks and
(iv) branches of regional rural banks. While the institutions at (m)
provide multi-purpose and multi-term credit to all categories of
persons engaged in agriculture and other rural economic activities,
those at {iv) serve, at present, a restricted clientele, as a deliberate
policy.
4.3 As explained in Chapter 1, the Committee reviewed, in the first
instance, the national level credit institutions and made its recommen-
dations which are reproduced in Part III of this Report. In this
chapter, the Committee reviews the working of the existing rural
credit institutions in the context of the integrated rural development
approach described in Chapter 3.
II. OVERALL PROGRESS
4.4 At the outset, it is necessary to note that complete data on the
total institutional credit advanced in the rural sector for all years on
a comprehensive basis are not available. We shall therefore confine
our review to credit for agriculture for which the data are available.
Loans outstanding increased from Rs. 1,075 crores in June 1969 to
Rs. 6,325 crores in June 1980 (Statement 4.1). Of the total agri-
cultural credit outstanding at the end of June 1980, co-operatives
accounted for 59.4 per cent, commercial banks for 38.8 per cent and
RRBs for 1.8 per cent (Chart 4.2). Investment credit, which
amounted to Rs. 499 crores or 46 per cent of the total outstanding in
1969 increased to Rs. 3,563 crores or 56.3 per cent in 1980. The
sizeable increase in the quantum of investment credit as also its share
in the total credit is attributable to the efforts of the ARDC. Both
co-operatives and commercial banks contributed to this increase. In
the total investment credit outstanding at the end of June 1980, the
share of co-operatives was 59 per cent, that of commercial banks 39
per cent and RRBs 2 per cent.
38
EXISTING INSTITUTIONAL SET-UP FOR RURAL FINANCE
jonol 
£1/
Notional
UlMtl
Stole
Level
District
Level
Primary
Level
GOVERNMENT OF" INDIA
IAFC
RESERVE BANK OF IWDJA
1
NCDC
i__r
ARDC
AAAAA/I^AAAAAAAAAAAAAAAAAAAAAAAAA PiAAAAAi AAA
» » H K II » *
z z z z z z z z :
SLDBs (19)
» y X * *••• » ?
Cofnnnerck((
Banks C58)
PLDBs(889)
and
SLD8 Branches
( 9 9 9 )
I K HtK * *
y-r-, , - i l » « p . . « p . | ™ .
zz Izizztzzzzzzz'zi iznzzzzzzi^z' !;Jzi zMzzzzzI
• ! • • I I ? A 3 4 I Z :
A :
; • z
t i l '• z
i
• • z
I *.
IDBI
State
Governments
J
. . I .
J_
S C B s ( 2 6 )
RRBs{84)
Comm»rciaf
Bank
Branches
(14,669)
r-p^
Small
farmers
• < v
Stote/Centrol
Industrial Co-ope«3tive
Banks (10), Branches(64)
CCBs(330>
RRB
Branches
(2059)
PACS/FSS/
LAMPS
(1.16,125)
Industrial
Co-operatives
Other
farmers rRural
Artisans
: I
+ - - { — r + ;-»
Agricul-
tural
Labourers
.J_
Other
Rural
Enterprises
tlOther
Rural
HousehoJds
ivIOTE : (1) Figures tn brackets indicate the lotest ovailoble number.
(2) Some functional societies olso advance loans to their respective groups.
•• Aflriculturdl Finance Corporation provides coSultoncy asjistance to other rurol financing ogencle$ and Gdveriunents
• In the smaller States/Union Terj-ifories the SCBs directly finance ihe PACS
DIRECTINSTITUTIONALFINANCEFORAGRICULTURE
(CRORESOFRUPEES)
2133
LOANSOUTSTANDING
(ASATTHEENDOFJUNE30.1980)
i
SHORT-TERM
•TERM-LOANS
Ie%
REGIONAL
RURALBANKS
4963
CO-OPERATIVESSCHEDULED
COMMERCIAL
BANKS
REGIONAL
RURAL
BANKS
I
LOAN'SDISBURSED
(DURINGTHEYEARENDEDJUNE30.1989)
•SHORT-TEAM
-TERM-LOANS
34%,
REGIONAL
RURALBANKS
OPERATIVES:OPERATIVES:OPERATIVES:
362%>:^
SCHEDULED^
COf^EHCIAL
BANKS
4456
CO-OPERATIVESSCh«OUCEO
COMMERCIAL
BANKS
REdlONAL
RURAL
BANKS
40
4.5 The data on loans issued during the year are presented in State-
ment 4.1. In the case of commercial banks, these data are available
only from 1974-75. Loans issued by co-operatives during the year,
for short-term and term purposes, which amounted to Rs. 1,039
crores in 1974-75 increased to Rs. 1,744 crores in 1979-80. The
annual average increase was Rs. 141 crores or 10.8 per cent. In
the case of commercial banks, total loans issued increased, over the
same period, from Rs. 274 crores to Rs. 1,045 crores, yielding an
annual average increase of Rs. 154 crores or 31.3 per cent. The
share of commercial banks in the total loans issued by co-operatives
and commercial banks which was 21 per cent in 1974-75 increased
to 36 per cent in 1979-80. In terms of the type of credit, the share of
commercial banks in term credit increased from 31 per cent in 1974-75
to 50 per cent in 1979-80. Go-operatives, on the other hand, conti-
nued to dominate the short-term credit scene, although, their share
declined from 84 per cent in 1974-75 to 70 per cent in 1979-80. The
third type of credit institution viz-, RRB is of recent origin ; their
share of the total in 1979-80 amounted to 3 per cent in short-term
loans and 5 per cent in term loans.
4.6 The National Commission on Agriculture (1976) had estimated
the credit requirement for full programme coverage by 1985 a,,
Rs. 16,549 crores. The more comprehensive integrated rural credit
approach and the accelerated rural development visualised in the
Sixth Plan are bound to create additional demand for credit and
therefore, the total demand for credit would be of a far higher order
than that estimated by the NCA. As against this expected large
need of rural credit, an attempt has been made below to project the
likely supply of credit based on the present trends and the likely per-
formance of rural credit institutions in the current decade.
4.7 Between 1975 and 1980, short-term loans issued by co-opera-
tives increased at an average annual rate of Rs. 94 crores or about
10 per cent. In the case of commercial banks, the increase was of the
order of Rs. 65 crores or about 27 per cent. In respect of investment
credit, the average annual rate of growth of advances, over the same
period worked out to Rs. 47 crores or 13 per cent in the case of co-
operatives and Rs. 89 crores or 36 per cent in the case of commercial
banks. As regards RRBs, though separate data for loans issued during
each year are not uniformly available, we have to note that during the
short period of their working, they have made considerable progress.
As a good number of RRBs are expected to be set up during the next
few years, this agency may be able to increase its lending sizeably
in the next decade.
41
4.8 The aggregate loans issued by all these agencies in 1979-80
amounted to Rs. 2,889 crores. Based on the rate of increase in credit
disbursal during the last five years, an attempt has been made to
project the level of credit likely to be reached by co-operatives and
commercial banks in 1989-90 on a linear basis. In regard to RRBs,
however, the estimate is based on an informed judgement on the pro-
gress of RRBs that are already in the field, the number likely to be
organised in the next five years and the viability norms evolved for
them.
ESTIMATES OF AGRICULTURAL C R E D I T D I S B U R S A L IN 1 9 8 9 - 9 0
(Rs. crores)
Short- Term Term Total
Institutions 1979-80 1989-90
(Projec-
tion)
1979-80 1989-90
(Projec-
tion)
1979-80 1989-90
(Projec-
tion)
(1) (2) (3) (4) (5) (6) (7)
Co-operatives
Commercial banks ..
RRBs
TOTAL
1,218
470
44
1,732
2,100
1,050
350
3,500
526 960
575 1,370
56 350
1,157 2,680
1,744 3,060
1,045 2,42®
100 700
2,889 6,180
Thus the disbursement of credit by the rural credit institutions
is expected to reach the level of about Rs. 6,180 crores in 1989-90.
While these rough projections indicate the progress likely to be made
by institutional lending agencies by 1989-90, the real problem is to
meet the credit requirements of integrated rural development with
special attention to vulnerable groups and backward areas.
Regional Variations in Credit Disbursal
4.9 Some idea of the spatial distribution of credit for agriculture can
be had by working out the quantum of loans per hectare of gross
cropped area by all credit institutions in each state. Though subject
to limitations arising from the wide diversity in regard to natural
endowments, input supplies and the need for credit, this, nonetheless,
provides a rough indicator of the disparities in credit distribution.
4.10 In Statement 4.2, the states are ranked in a descending order
of total agricultural loans issued per hectare of gross cropped area in
1977-78. Alongside, per hectare data on loans issued during 1974-75
and 1977-78 and outstanding at the end of 1974-75 and 1977-78 are
given. Loans issued by all credit institutions in the whole of India
42
increased from Rs. 112 per hectare in 1974-75 to Rs. 134 per hectare
in 1977-78. Similarly, outstanding credit also increased from Rs. 158
per hectare at end 1974-75 to Rs. 255 per hectare at end 1977-78.
4.11 In the ranking of states according to loans isucd in 1977-78,
Kerala came first with Rs. 343 per hectare of gross cropped area
followed by Tamil Nadu (Rs. 341), Punjab (Rs. 273) and Haryana
(Rs. 234). In Andhra Pradesh, Gujarat, Karnataka, Maharashtra,
Uttar Pradesh and West Bengal, credit per hectare ranged between
Rs. 110 and Rs. 178. In the other states, credit per hectare was less
than Rs. 75, the lowest being in Assam at Rs. 6 (Charts 4.3 and 4.4).
4.12 In four states viz., Himachal Pradesh, Jammu and Kashmir,
Maharashtra and Gujarat, loans issued per hectare in 1977-78 re-
presented a decline compared to 1974-75, but the fact that credit
outstanding per hectare had increased during this period implied that
the overdues have risen.
4.13 In Statement 4.3, the major states are ranked according to
percentage distribution of agricultural loans issued by co-operatives
(including LDBs) and commercial banks separately during 1974-75
and 1977-78. These data reveal that in terms of percentage, agri-
cultural loans issued by the two credit agencies in both the years
broadly correspond in many of the states. The significant exceptions
are Maharashtra and Gujarat where co-operatives have a larger share
compared to commercial banks. In Kerala, the proportion of agri-
cultural credit issued by commercial banks is larger than that of co-
operatives. The same position emerges even when states are ranked
on the basis of loans outstanding at the end of each of the two years.
4.14 To indicate the degree of association between these two series
of data, the method of rank correlation was employed. The* coeffi-
cient of correlation worked out to -j- 0.8. This broadly confirms the
observation that the percentage share of loans by co-operatives and
commercial banks in different states was more or less the same. Thus,
as the Dantwala Committee on RRBs concluded, commercial banks'
agricultural credit has been additive and has not helped to fill the
geographical gaps in the availability of credit not covered by co-opera-
tives.*
*Page 32 of the Report.
43
PER HECTARE CREDIT ISSUED
ALL INDIA
KERALA
TAMIL NADU
PUNJAB - •
HARYANA
UJARAT
MAHARASHTRA • • • • • • •
KARNATAKA
ANDHRA PRADESH-
UTTAR PRADESH
WEST BENGAL
ORISSA-
RAJASTHAN
JAMMU AND KASHMIR
MADHYA PRADESH
BIHAR
HIMACHAL PRADESH-
ASSAM ••••••*•••••»«
<I2
lllllllllllllllllllllllllll 134
3 0 0
MliMMmilMIHIIIINIIIIIIIIillllllllllllllllllllllll
3 4 3
341
177
2 7 3
ffimiwitMftmiiiiiiiiiiiiiiiiiiiir^^
140
fttiniiiiiiiiiHiiiiiim^m- 178
lllllillHIIIilllllHIIIHM
144
164
:J 107
iiiiiJiiiiiiiHiiiiinim^'"^
iiiiiiiiiiNiiniHiir^-*
3 7
no
[unniwrn^^
3 4
60
5 7
7777777773 5 2
1 5 2
3 2
47
T56
3 8
260
226
m
:J3
O
H
>
m
>
o
o
c
c
>
o
- - g o
c H >
m (/) ^
O
O
C
•z.
o
(5
-^
-(^
I
--J
>
o
CO
- J
I
00
44
PER HECTARE CREDIT OUTSTANDING
ALL-IMDIA'
(KERALA
^ ^
TAMIL NADU'
PUNJAB
HARYANA
GUJARAT
MAHARASHTRA'
158
255
3 3 4
3 9 0
rn 237
173
s
I 354
347
q 3 6 7
KARNATAKA'
ANDHRA PRADESH"
WTTAR PRADESH-
WEST BENGAL'
ORISSA . . « . « » . . « . - .
RAJASTHAN
JAMMU AND KASHM4R
MADHYA PRADESH-
BIHAR
HIMACHAL PRADESH
ASSAM -V
2 3 0
3 0 6
^ ^
9 0
3 3 0
168
S 3 6 3
iiTi'iyfi'Mii^^^
. . ; . . . | 69
7 8
133
4 9
101
riri'mi'-^^
88
78
3 0
I 151
148
H 219
Tl ^^
FH 43
580
6 73
^
m
3>
m
o
H
>
m
>
o
o
c
^
c:
:xi
3>
r-
o
JO
m
o
O
c
H
C/)
H
>
m o H
"^> 1
m
o
"n
m
-<
m
S
to
>
z
o
I
00
•!l.^i>3^[J«J^•>«XiK rjirir-iyiarnri'Tir-'^ i? M-a-je*
45
Coverage of Weaker Sections
4.15 Loans to small farmers (less than two acres) and other weaker
sections accounted for 31.5 per cent of the outstanding credit as at the
end of June 1978 and 38.5 per cent of the loans issued in 1977-78 by
scheduled commercial banks and co-operatives (Chart 4.5). In
the case of both these types of institutions, credit purveyed to this class
of borrowers recorded an increase over the period. Thus, in the case
of co-operatives, loans to this class formed 30 per cent of credit extended
in 1974-75 and the proportion increased to 39.3 per cent in 1977-78.
In the case of commercial banks, the corresponding proportions were
36 per cent and 39 per cent respectively. Go-operative credit to
scheduled castes and tribes formed about 10 per cent of the total
credit in 1977-78.
4.16 Against this overall background, the performance of these
three credit institutions in the field of rural credit is reviewed and
their major problems identified, in the following sections.
III. CO-OPERATIVE CREDIT
4.17 The primary agricultural credit societies functioning at the
base of the co-operative credit system constitute the major retail out-
let of short and medium-term credit to the rural sector. Attempts
have been made to strengthen them through structural reorganiza-
tion and rationalisation of their operations, particularly in respect of
financing seasonal farm activities, through a production-oriented
system of lending called the crop loan system.
4.18 The structural reform has been in the direction of determining
the optimum size and nature of functions of the society so as to make
it economically viable and managerially efficient.
ofVocStils''" The official policy as to the size of the society cry-
stallized around the mid-sixties. At the Conference
of the State Ministers for Co-operation held in 1964 at Hyderabad,
it was decided, inter-alia, that, for attaining the minimum criteria of
viability such as ability to appoint a full-time paid secretary, to set
up a regular office, to contribute to reserves and to pay dividend,
areawise standards of the quantum of business necessary for the society
should be worked out and that a survey should be carried out for the
purpose of drawing up programmes of reorganization through amal-
gamation of non-viable units and liquidation of defunct ones. Re-
organization on this basis was expected to be completed by
CHART43
LOANSTOSMALL/MARGINALANDOTHERFARMERS1977-78
LOANSOUTSTANDING-ENDOF1977-78
35-6%
'A
^64-4%^A
260%
Y
PACSLOSS
HBas«donHmitedinformoltonavatlobia
NOtg:RR6»odyanc«loonsonlyto
small/inor9inalfarrpersandwsqkfr$$ctI4n|-
3l-6««;
m.'V,684%y^
SCHEDULED
COMMERCIAL
BANKS
SMALL
MAfiQINAL
FARMERS,ETC
LOANSISSUEDDURING1977^78
ffvBWERS3s.^
39-6%
%
370%
z.
z//61'3%%:
SCHEDULED
COMMERCIAL
BANKS
47
1966-67, resulting in a reduction of the total number of societies to
1.20 lakhs. However, even at the end of 1-967-68, the number of
societies remained at 1.75 lakhs. In 1973, the Working Group on
Co-operation for the Fifth Five Year Plan recommended that a PACS
might be treated as viable only when it reached a minimum short-
term agricultural credit business of Rs. 2 lakhs. Again, at a meeting
of the Registrars of Co-operative Societies convened by the RBI in
May 1976, it was decided that, for the purpose of viability, a normal
cropped area of 2,000 hectares might be considered adequate to
provide a minimum short-term credit potential of Rs. 2 lakhs. Fur-
ther, in order to remove the existing lacunae in legal procedures
which were responsible to some extent for the delays in implementing
the reorganization programme, it was suggested to amend the State
Co-operative Societies Acts to provide for compulsory amalgamation
of societies.
4.19 Thanks to continuous efforts for more than a decade to push
through the reorganization programme, the number of PACS declined
to 1,16,125 in 1977-78 and further to 94,503 at the
Reo?gln%aJion ^""^ of June 1979* as against 90,000 estimated to
remain ultimately in the field. Out of 1,16,125
societies as on 30 June 1978, only 49,453 societies were considered as
viable as per the business norm mentioned above. According to
information available, the process of reorganization is either complete
or in progress in all the states except Jammu & Kashmir, Gujarat
and Maharashtra. In Gujarat, the Co-operative Societies Act needs
to be amended to provide for compulsory amalgamation of societies.
In Maharashtra, the State Government has reservations about the
prescribed norms of viability. As a result, the number of societies in
Maharashtra continues to be more than 18,000 as against 10,000
viable units that the state government had decided upon at one stage
in September 1975.
Performance of PACS
4.20 The latest published data on the performance of PACS relate
to 1977-78. Statement 4.4 shows the salient features of the societies
in 1970-71 and 1977-78. In Statement 4.5, provisional data relating
to their operations during 1978-79 are presented. Excluding 8,994
dormant societies which were to be liquidated or merged in the process
of reorganization, there were 1.07 lakhs active societies at the end of
*Data on co-operative credit for 1978-79 used in this chapter are provisional.
48
June 1978 which covered 5.28 lakhs villages or 90.9 per cent of the
total number of villages in the country, the average coverage per
active society being about 5 villages. The population of the villages
covered accounted for 88.6 per cent of the total rural population in
the country.
4.21 The total membership of PACS increased from 31 million in
1970-71 to 47.9 million in 1977-78 and further to 51.8 million in
1978-79 registering an increase of 67.1 per cent over
anTMemtoSiip 1970-71. Of the 47.9 milUon members, as on 30
June 1978j 36.8 million were cultivators, 4.3 million
were agricultural labourers and 0.8 million were rural artisans. The
membership of weaker sections comprising small farmers (having
operational holdings of not more than 2 hectares each), agricultural
labourers and rural artisans totalled 26.3 million, constituting 54.9
per cent of the aggregate membership as on 30 June 1978.
4.22 Notwithstanding the increase in membership and in also
those borrowing amongst them, the borrowing membership, expressed
as a percentage to total membership, declined from
wTe^mb^rehip 36.0 per cent in 1970-71 to 34.4 per cent in 1977-78.
According to the provisional data for 1978-79, the
proportion of borrowing members to total membership has recorded
only a marginal increase to 36.5 per cent. In 1977-78, borrowing
membership as a proportion of total membership was below the all-
India percentage of 34.4 in several states as may be seen from the
following :
STATES WHERE THE PERCENTAGE OF BORROWING MEMBERSHIP WAS BELOW THE ALL-INDIA
PERCENTAGE
State Percentage of
borrowing
membership to
total membership
in 1977-78
State Percentage of
borrowing
membership to
total membership
in 1977-78
(1) (2) (1) (2)
1. Andhra Pradesh .. 28-1
2. Assam .. .. 0-7
3. Bihar .. 26-2
4. Himachal Pradesh .. 31-2
5. Jammu & Kashmir 24-7
6. Kamataka .. .. 24-5
7. Madhya Pradesh 30-2
8. Maharashtra 27-0
9. Manipur .. .. 5*7
10. Meghalaya .. .. 28-8
11. Nagaland .. .. 15-4
12. Orissa .. .. 21-8
13. Tripura .. .. 11-8
Source
1977-78.
Statistical Statements Relating to the Co-operative Movement in India,
49
The indebted membership (22.8 million) of societies at the end of
1977-78 formed 47.6 per cent of the total membership.
4.23 The position of borrowing membership of weaker sections and
others as on 30 June 1978 was as shown below :
Group No. of Percentage of No. of Percentage of
members membership borrowers borrowing
(in million) to total
households
in the gproup
(in million) membership
in the group
(1) (2) (3) (4) (5)
1. Small Farmers (i. e.
those whose holdings
do not exceed
2 hectares) 21-2 43 7-7 36-3
2. Other farmers 15-6 68 8-0 51-3
3. Tenants, agricultural
labourers and others I M 52 0-8 7-2
47-9
52
16-5
52
Sources : (i) Statistical Statements Relating to the Co-operative Movement in India.
(ii) For groups 1 and 2 :—^Agricultural Census 1971.
(in) For group 3 :—^All India Debt and Investment Survey,
1971-72.
Scheduled castes and scheduled tribes together accounted for
21.3 per cent of the total membership ; amongst them, those borrow-
ed in 1977-78 and those indebted at the end of the year were 30.4
per cent and 42.1 per cent, respectively, of their total membership.
4.24 The paid-up share capital of societies increased from Rs. 205.74
crores in 1970-71 to Rs. 420.69 crores in 1977-78 and further to
Rs. 455.47 crores in 1978-79, raising the average
Financial share capital per society to Rs. 48 thousands in
Position 1978-79 from Rs. 13 thousands in 1970-71. In the
matter of deposit mobilisation, the deposits held
byallthePAGS were only Rs. 211.44 crores as on 30 June 1979,
as against Rs. 69.46 crores as at end June 1971. Deposits accounted
for 7.1 per cent of their working capital at end June 1979. The
societies in Kerala and Punjab held sizeable deposits, the former with
Rs. 92 crores and the latter with Rs. 25 crores as on 30 June 1979.
Both these States together accounted for 55.4 per cent of the deposits
mobilised by all PACS in the country as on that date. Borrowings
50
from higher financing agencies increased from Rs. 675 crores at end-
June 1971 to Rs. 1,727 crores at end-June 1979, accounting for 58.4
per cent of the working funds of societies and signifying their conti-
nued heavy dependence on borrowed funds.
4.25 The proportion of societies which issued loans to their members
increased from 73 per cent in 1970-71 to 77 per cent of total during
1977-78. The loans issued increased from Rs. 578
Loan Business crores in 1970-71 to Rs. 1,270 crores in 1977-78 and
further to Rs. 1,409 crores in 1978-79. Of the total
short-term loans and advances of Rs. 1,111 crores in 1977-78, crop
production finance amounted to Rs. 1,033 crores, consisting of Rs. 581
crores in cash and Rs. 452 crores in kind by way of seeds, fertilisers
and pesticides. Credit disbursed in kind formed 43.8 per cent of the
crop loans issued in 1977-78 as against only 11.1 per cent in 1973-74.*
Out of medium-term (excluding conversions) advances of Rs. 98
crores in 1977-78 (as against Rs. 58.54 crores of such advances in
1970-71), those for minor irrigation programmes were Rs. 23 crores
followed by those for dairying activities amounting to Rs. 22 crores.
The volume of short and medium-term loans issued during 1978-79
by the societies in 5 states viz., Gujarat, Kerala, Maharashtra, Punjab
and Tamil Nadu adding to Rs. 673 crores, accounted for 47.8 per
cent of the total advances of PACS in the country. On the other
hand, the loan business of societies in states like Assam, Bihar, Hima-
chal Pradesh, Jammu & Kashmir, Manipur, Meghalaya, Nagaland
and Tripura was relatively low. The total outstanding loans of PACS
increased from Rs. 784.48 crores at end June 1971 to Rs. 1,798.07
crores as on 30 June 1978 and further to about Rs. 2,008 crores at end
June 1979, comprising Rs. 1,513 crores of short-term loans and
Rs. 494 crores of medium-term loans.
4.26 Over the period 1970-71 to 1977-78, the average share capital
and deposit held per member increased from Rs. 61 and Rs. 15 to
Rs. 76 and Rs. 24, respectively, (Statement 4.4).
Performance ^^^ average loan amount per borrowing member
rose to Rs. 772 from Rs. 514 during the same period.
The average amount of loans outstanding per society at Rs. 0.49
lakh as at end June 1971, had moved upto Rs. 1.55 lakhs by June
1978 and further to Rs. 2.12 lakhs by June 1979. However, in terms
of outstanding short-term agricultural loans, the average per society
was only Rs. 1.16 lakhs on 30 June 1978 and Rs. 1.60 lakhs as on
•Information relating to years prior to 1973-74 is not available
51
30 June 1979. This was below the prescribed viability standard of
Rs. 2 lakhs. While the total advances of societies increased by 119.7
per cent between 1970-71 and 1977-78, the number of borrowing
members increased by only 46.7 per cent. It will be seen from
Statement 4.6 that in Bihar, Himachal Pradesh, Jammu & Kashmir,
Madhya Pradesh and Punjab the number of borrowing members
had decreased over the period 1970-71 to 1977-78 ; but the loans
issued had recorded an increase. In Andhra Pradesh, Haryana,
Orissa, Rajasthan, and West Bengal, both the magnitude of lendings
and the borrowing membership increased ; but the percentage in-
crease of the former was sharper than the latter. It has, therefore,
to be inferred that the increased credit had not benefited a larger
number of members in these states.
4.27 The state-wise position of PACS considered as viable, those
working at profit/loss as on 30 June 1978, etc., is indicated in State-
ment 4.7. Statement 4.8 presents the averages per society in respect
of membership, borrowing membership, share capital, working
capital, deposits, loans, etc., in each state for 1970-71 and 1977-78.
It is observed from these data that in the matter of increasing effective
coverage, deposits and loan business, Kerala has done relatively
better.
Co-operative Credit to the Rural Poor
4.28 Since the beginning of this decade, a significant shift has been
effected in the loan policies of co-operatives for meeting the credit
needs of the small/marginal farmers and other weaker sections of the
rural community. The Reserve Bank stipulated in 1970-71, that
10 per cent of the drawals on its short-term credit Hmits granted to
Central Co-operative Banks (CCBs) should be for financing small and
marginal farmers defined for this purpose as those having operational
holdings of 1.2 hectares ( 3 acres) or less. This percentage was
raised to 20 from 1971-72. In 1975-76, this norm was finked to the
loans issued to small farmers during the year instead of loans out-
standing (which was the norm till then). In 1976-77, the parameters
for identification of small farmers for this purpose were revised so as
to range from 1 hectare to 3.2 hectares (2.5 acres to 8 acres), taking
note of the geo-physical and agro-climatic conditions of each district
in the country. To ensure compliance with this condition, drawals
on the RBI's short-term credit Umits in excess of 70 per cent are per-
mitted only if 20 per cent of the loans advanced in the year have gone
to small farmers. Thus, the flow of credit to the weaker sections
52
increased from Rs. 213 crores in 1973-74 to about Rs, 490 crores in
1977-78. Of the total advances of the societies during 1977-78, loans
to members holding land upto 1 hectare amounted to Rs. 198 crores
and to those having more than one hectare but not exceeding 2 hec-
tares, Rs. 246 crores, i.e. 15.5 per cent and 19.3per cent,respectively,
of the total advances. The share of tenant-cultivators was Rs. 30.90
crores or 2.4 per cent of the total and of agricultural labourers, a little
over one per cent. The landless labourers, rural artisans and marginal
farmers holding lands of not more than 0.2 hectare (0.5 acre) each,
numbering 2.91 lakhs in all, were assisted with consumption credit
by 10,326 PACS (out of the total of 1.16 lakh PAGS) to the extent
of Rs. 8.47 crores in 1977-78.
4.29 In regard to long-term credit for which fragmentary data are
available in respect of 13 states and one Union Territory for 1977-78,
disbursements to 3.70 lakh farmers amounted to Rs. 179 crores; of
this, Rs.67 crores or 37.4 per cent had gone to 1.71 lakh cultivators
with land holdings upto 2 hectares each.
4.30 The weaker sections were also given the benefit of a lower rate
of interest on loans. Besides, they are to contribute at a concessional
rate of 5 per cent of the loans to be advanced to them as share capital
as against the usual 10 per cent of the loan amount to be held as shares
by other members. With a view to enabling even the relatively weak
PACS to serve as channels of credit, particularly in the special scheme
areas or co-operatively underdeveloped or weak states, the Reserve
Bank has liberalised its norms of eligibility of credit institutions in
regard to overdues percentage for purpose of share capital contribution
by state governments from loans out of its Long Term Operations
Fund. The SFDAs and also some of the state governments provide,
wherever necessary, loans to small farmers*/agricultural labourers
to enable them to contribute the initial share capital required for
enrolment in co-operatives. The ARDG has committed itself to
ensuring that at least 60 per cent of its disbursements are utilised for
meeting the investment needs of small farmers. Small farmers, for
this purpose, are defined as those cultivating land, providing a pre-
development net return to family resources to such farmers, not
exceeding Rs. 2,000 per annum at 1972 prices. They are also entitled
to other concessional terms like 5 per cent down payment as com-
pared to 10 to 15 per cent stipulated for medium and large farmers
*Small farmers for this purpose are generally defined as those having operational
holding of not more than 1 hectare of irrigated land and 2 hectares of dry land.
53
besides longer repayment schedule, running upto 15 years, especially
for minor irrigation investments.
4.31 Although the provision of outright grants to the Special Bad
Debt Reserve of PACS and CCBs under a Central Sector Plan Scheme
to serve as an incentive for financing small and economically weak
farmers ceased with the Third Five Year Plan, the SFDAs have been
contributing to the "Risk Fund" of the lending agencies for encourag-
ing them to finance the identified small farmers, in an increasing
measure. Such contributions in respect of short-term loans are made
at the rate of 4 per cent and 2 per cent of the additional quantum of
advances made in a year by PACS and CCBs, respectively. In the
case of medium-term credit, the rate of contribution is 4 per cent and
2 per cent to PACS and CCBs, respectively, on the total quantum of
loans advanced to the identified small farmers. Primary land deve-
lopment banks are given "risk fund contribution" at 2 per cent of the
total long-term advances made to the identified farmers. As on 30
June 1978, the risk funds (including the special bad debt reserve
created earlier) to the credit of both PACS and CCBs aggregated
Rs. 61.88 crores. Complete and precise information regarding the
utilisation of these Funds for writing off irrecoverable dues of small
and marginal farmers is not available. A sample study of the utilisa-
tion of risk fund by PACS, conducted during November 1980 by the
Co-operative Department of the Government of Kerala, in 4 SFDA
districts i.e., Trivandrum, Quilon, Trichur and Cannanore, revealed
that many of the societies had invested the risk fund in term deposits
with the CCB. This was because of the absence of specific instructions
from the Registrar of Co-operative Societies and the SFDAs concerned
regarding the manner of utilisation of the fund for write off purposes.
In terms of SFDA's instructions, the Registrar of Co-operative Socie-
ties is vested with the power to accord sanction to write off irrecoverable
dues. However, there seems to have been no attempt so far to make
an assessment of the irrecoverable dues of small and marginal farmer-
borrowers. Thus the non-utilisation of the fund, for the purpose for
which it was intended, was due to the lethargy of the bureaucracy
in the matter of issuing suitable guidelines, spelling out the
modalities of assessment of bad debts and their write off. PACS
were afraid of opening the issue on their own. In fact, they have
been shying off from the issue. The procedure laid down for this
purpose also seems to be cumbersome. All this needs to be looked
into.
4.32 To ensure that non-wilful, small farmer-defaulters to the co-
operatives are not handicapped for want of credit to carry on their
54
production and investment programmes, co-operatives were advised
by the Reserve Bank, in pursuance of the decision taken by its Agri-
cultural Credit Board in December 1979, that cultivators holding 1
hectare of irrigated land or 2 hectares of dry land and whose defaults
involve small amounts, not exceeding 10 per cent of their eligibility
under short-term agricultural loans, could be given fresh finance by
the concerned society at its own discretion out of its own funds by re-
scheduling the old default for a period upto 5 years, provided this
facility is treated as a one-shot operation. Such category of defaulters
are also eligible for fresh investment credit (long-term loan) if the
amount of default together with the fresh long-term credit are well
within their assessed repaying capacity.
4.33 As regards financing of rural artisans and village craftsmen,
the RBI recognised, as far back as in 1968, the industrial co-operatives
formed by such categories engaged in 22 broad groups of cottage and
small-scale industries as eligible for its concessionary refinance assis-
tance for working capital purposes. As the progress in the formation
of industrial co-operatives was not encouraging, the NGA suggested
that credit requirements of rural artisans, and craftsmen should be
met by Farmers Service Societies (FSS) envisaged by it. In August
1977, the Reserve Bank extended its refinance facilities through
PACS to individual artisans and craftsmen who, being scattered, are
not able to form their own co-operatives. Recently, some of the
State Co-operative Banks (SCBs) have initiated steps to provide credit
facilities to the artisans through PACS. For instance, the Haryana
and Orissa SCBs had secured credit limits amounting to Rs. 23.27
lakhs and Rs. 31.91 lakhs from the RBI for this purpose in 1979-80.
4.34 As regards term credit, since there is a legal constraint on
the RBI in providing refinance to CCBs for this purpose, it advised
them in February 1980 that they could provide, from out of their own
resources, loans for periods not exceeding 10 years to PACS for meet-
ing such credit needs of rural artisans provided that the aggregate
of such credit does not go beyond 15 per cent of their long-term dis-
posable resources or 5 per cent of their total deposits whichever is
more. We have been informed that the IDBI is exploring the possi-
bility of extending its refinance assistance to selected CCBs for meeting
the term credit needs of this sector. Meanwhile, governmental
agencies such as Khadi and Village Industries Boards meet to some
extent the term credit needs of rural artisans.
55
Recovery of Loans
4.35 Over the period 1970-71 to 1978-79, the recovery performance
of PACS showed a deteriorating trend. As on 30 June 1978, there
were 12 million defaulting members accounting for 53 per cent of the
indebted membership. The overdues increased from Rs. 322.40
crores in 1970-71 to Rs. 809.62 crores in 1977-78 (Statement 4.9),
constituting 43.3 per cent and 45 per cent of the demand and out-
standing loans, respectively, at end June 1978. The overdues further
rose to Rs. 908 crores at end June 1979, forming 45.2 per cent of the
total loans outstanding.
4.36 Overdues under short-term loans increased from Rs. 283 crores
on 30 June 1971 to Rs. 660 crores at end June 1978 and further to
Rs. 733 crores on 30 June 1979. Of the total overdues of Rs. 809.62
crores at end June 1978, those for over 3 years amounted to Rs. 170
crores or 21 per cent of the total. State-wise, recoveries during 1977-78
in relation to the demand for the year were below the all-India average
in Assam, Bihar, Himachal Pradesh, Jammu & Kashmir, Karnataka,
Madhya Pradesh, Maharashtra, Manipur, Meghalaya, Tripura,
Orissa and West Bengal. In a few states, viz-^ Haryana and Kerala,
the recovery efforts had shown signs of improvement. It will be seen
from Statement 4.5 that as on 30 June 1979, the position of overdues
was particularly disquieting in Bihar, Karnataka, Maharashtra,
Madhya Pradesh, West Bengal and Tamil Nadu. The prevalence of
large-scale overdues constitute a major obstacle to uninterrupted
flow of co-operative credit to the needy rural households.
4.37 The RBI's Study Team on Overdues of Go-operative Credit
Institutions (1974) had come to the conclusion that defaults were, by
and large, wilful and that lack of will and discipline among cultivators
to repay and the unhelpful attitude of state governments in creating
a favourable climate for recovery were the primary factors responsible
for the prevalence of overdues. It had further observed that there
was no positive relationship between the level of overdues and the
extent and frequency of natural calamities. It, therefore, recommen-
ded that state governments should not condone wilful non-repayment
and that coercive steps should be instituted for recovery of overdues.
Some of its major recommendations were : automatic supersession of
managing committees/Boards of Directors if and when the overdues
exceeded a specified level, denial of fresh credit and voting rights to
defaulters and their sureties, amendments to the Go-operative Societies
Acts empowering the Registrar of Go-operative Societies to issue
56
orders suo moto for recovery of co-operative dues as arrears of land
revenue and strengthening of the government machinery concerned
with the recovery of dues. Yet another important recommendation
was in regard to grant of relief to small farmer-defaulters (whose gross
agricultural income did not exceed Rs. 5,000 per annum) affected by
successive or frequent natural calamities. The various types of relief
suggested by it in this regard were :
(?) For two successive failures of crops, the aggregate of two short-
term conversion loans should be rescheduled as a five year
loan;
{ii) For three successive failures, write off of the short-term
(conversion) loan and the interest thereon and spreading
over of the other loans as a rescheduled loan for five years;
{Hi) If, in addition to the short-term loans, the borrower has to
repay a normal medium-term loan, the repayment period of
the rescheduled loan might be spread over six years in the
case of one crop failure; for two successive failures, one short-
term (conversion) loan and interest thereon might be written
off, spreading over of the remaining loans as a rescheduled
loan for seven years; for three successive failureSj, two short-
term (conversion) loans might be written off spreading over
of the remaining loans as a rescheduled loan for seven years.
The Study Team had also recommended that all non-wilful small
defaulters with cultivated holdings in villages affected by natural
calamities in one or more years during the period 1970-71 to 1972-73
should be rehabilitated by converting their short-term loan overdues
into medium-term or even long-term (7 years) loans and that state
governments might extend financial assistance to CGBs for enabUng
the latter to grant such rehabilitation loans to the primaries. These
recommendations have, by and large, remained unimplemented in
most of the states. On the other hand, some of the state governments
viz-i Andhra Pradesh, Karnataka, Maharashtra, Madhya Pradesh,
Rajasthan and Tamil Nadu have issued, from time to time, blanket stay
orders on or banned coercive action for recovery of co-operative dues.
4.38 According to the RBFs study reports and our own observations
in the field, the principal reasons for overdues are : {}) failure to
tie-up lending with development programmes,
Overdues*"^ (^0 defective loaning policies, including untimely
loan disbursements, under-financing/over-financing
and unrealistic scheduling of loan repayment, [Hi) neglect of/or
57
absence of efforts for marketing arrangements and linkage of credit
recovery with sale of produce, (iv) ineffective supervision, (v) mis-
application of loans, [vi) apathy and indifference of management of
societies to taking coercive measures for recovery and (vii) foremost
of all, want of a sense of discipline and resj>onsibility among the loanees
in regard to prompt repayment of debts. While unforseeen natural
calamities such as drought, floods, etc., have contributed in some
measure to non-payment of dues, steps taken by state governments in
the name of these calamities have adversely affected the climate for
recovery and accelerated the accumulation of overdues.
Credit Stabilisation Arrangements
4.39 It should be ovserved that the rise in overdues has been quite
steep despite large conversion facilities channelised through the co-
operative credit system. Conversion facilities were resorted to fre-
quently and on a large scale in recent years as may be seen from the
details given below :
Year
(July-June)
Drawals from the National Agricailtural Credit
(Stabilisation) Fund
1970-71
1971-72
1972-73
1973-74
1974-75
1975-76
1976-77
1977-78
1978-79
1979-80
(Rs. Crores)
14
24
68
41
55
41
78
103
32
88
Source : Report on Currency and Finance, RBI.
At the level of PACS, the amount of medium-term conversion loans
outstanding against members was as high as Rs. 200 crores at end-June
1978. Of this, as much as Rs. 184 crores or 92 per cent were accounted
for by six states viz., Andhra Pradesh (Rs. 25 crores), Gujarat (Rs. 60
crores), Karnataka (Rs. 16 crores), Madhya Pradesh (Rs. 10 crores),
Maharashtra (Rs. 28 crores) and Tamil Nadu (Rs. 45 crores). The
studies conducted from time to time by the Reserve Bank into the
actual utilisasion of conversion facilities have, inter alia, revealed that
conversions were allowed uniformly to all the borrowers in the affected
areas irrespective of their need therefor and that, v6ry often, even
58
overdues of short-term loans relating to crops not damaged by natural
calamity were also converted.
4.40 In Gujarat, Maharashtra and Tamil Nadu which accounted
for over 85 per cent of the total drawals from the National Agricultural
Credit (Stabilisation) Fund during the three years ended 1975-76,
own^wan was found to have been declared not crop-wise, but on the
basis of average yield of all the crops taken together. Under this
system, the yield of one or two principal crops tilts the aggregate
annewari of ajl the crops* In Maharashtra, for example, the normal
yield is arrived at by averaging the yield over a period of 10 years and
this is valued at 9 annas instead of 12 annas as envisaged under the
stabilisation arrangements. It was found that the figures of annewari
did not bear any logical relation to those of foodgrain production for the
State as could be seen from the following table :
Total No. of
villages
No. of villages
having annewari
below 6 annas
Foodgraini
(In lakh
> production
tonnes)
Year Total No. of
villages
No. of villages
having annewari
below 6 annas
Ten year moving
average of
production
Actual estimat-
ed production
(1) (2) (3) (4) (5)
1973-74
1974-75
1975-76
1976-77
38,832
38,839
38,870
38,870
10,672
5,972
17,483
9,834
57-67
58-82
63-25
67-00
70-45
79-00
91-19
96-98
Source: Report of the Crpp Loan Evaluation Committee of the Gk>vernment of Maha-
rashtra, 1978.
In Tamil Nadu, dual standards were adopted for declaration of
annewari—-QBG for obtaining stabilisation assistance from the RBI and
another for grant of relief by the State Government itself, by way of
suspension or remission of land revenue.
4.41 The Study Team on Overdues had recommended that certi-
fication oi annewari by the District Collector should be considered ade-
quate for the use of stablisation arrangements, provided the annewari
was determined on a scientific basis, by undertaking crop cutting
experiments in plots selected on a random sampling basis, preferably
by the Statistics Department of the state government. While the
Reserve Bank has accepted the certification o{annewari by the Collector,
state governments have not taken action to introduce scientific methods
for determination of annewari.
59
4.42 Quite a large number of PACS continue to remain only as
credit-disbursing agencies without providing complementary services
to members. The number of societies distributing
Functi'ons* farm inputs was less than 10 per cent of the total
number of societies in Andhra Pradesh, Assam and
Bihar. The aggregate value of farm requisites supplied by 43,605
societies (38 per cent of the total) in 1977-78 was about Rs. 488 crores,
of which the major component was fertilisers worth Rs. 425 crores.
About a third of the societies (37,704) sold essential consumer articles
like foodgrains, kerosene, sugar, etc., of the value of about Rs. 278 crores,
during 1977-78. In 1977-78, 18,449 societies (16 per cent of the total)
spread over 12 states, recovered from 2.7 million borrowers, a sum of
Rs. 127 crores from out of the sale proceeds of produce. This was
roughly 12 per cent of the total recoveries effected during this year.
A much smaller number of societies (1j309) undertook sale of members'
produce during 1977-78. 39 societies in Andhra Pradesh, Bihar,
Gujarat, Kerala, Maharashtra and West Bengal had made a beginn-
ing with processing activities.
Farmers Service Societies [FSS)
4 A3 The Farmers Service Society was conceived by the NGA in
1971 with the following basic objectives :
(f) To provide all types of credit and a full package of services
and technical guidance to farmers, particularly small farmers,
for enhancing production, and for diversification of activities
on the farm in an integrated manner and at one contact
point;
{ii) To cover effectively a large area of operation, say a block or
population of 10,000, so that it can maintain technical
experts and well-trained managerial staff and simultaneously
function as a viable unit; and
(iii) To enable the weaker sections to control the society while
servicing all categories of farmers, for which purpose, its
constitution should provide for a two-third representation to
such class of people on its elected board of management.
Such type of societies could be sponsored by and affiliated to
commercial banks or could form part of the co-operative credit system.
It was envisaged that there would be two types, viz., (a) at block
level—with jurisdiction over the entire block and with 20 branches
60
(miiiimum) and loan business of Rs. 1 crore within a period of five
years and (b) a smaller model covering a gross cropped area of 10,000
hectares to command a loan business of Rs. 10 lakhs within 5 years.
Except in Bihar, Jammu & Kashmir, Goa, Manipur, Nagaland,
Tripura and the tribal area of Gujarat, the FSS registered are generally
of the smaller type.
4.44 Starting with 30 FSS in 1973-74 in SFDA areas, the number of
FSS in the country increased to 1,577 (inclusive of 665 gtam-panchayat
societies in Assam and 113 Sericulturists-cum-Farmers Service Societies
in Karhataka) by the end ofJune 1978j as against 2,520 envisa;ged by
the NCA to be set up over a period of 6 years. Assam had the largest
number of FSS (665) followed by Uttar Pradesh (381), Karnataka
(215), Madhya Pradesh (92) and Pondicherry (62). Haryana, Jammu
and Kashmir, Nagaland, Orissa, Rajasthan, Maharashtra and Tamil
Nadu had only a few FSS. No FSS had been organised in Arunachal
Pradesh, Meghalaya and Mizoram in the North-east region and in
Punjab and Himachal Pradesh in the northern region. The ^ogress
made by FSS in 1977-78 can be seen from the following data :
All FSS Averrge per FSS
(Rs. crores) (Rs. lakhs)
1. Niimbcr of Societies (including Sericulturists-
cum-FSS)
2. Membership ('000)
3. Borrowing membership (*000)
4. Paid-up capital (Rs.) ..
5. Deposits (.. )
6. Other borrowings (>, )
7. Loans issued (>> ^
8. Loans Oustanding (,> )
9. Overducs (,, )
Source: Statistical Statements Relating to the Co-operative Movement in India.
Sixty per cent of FSS membership comprised of small farmers
with holdings upto 2 hectares. Effective coverage in terms of borrow-
ing members was only 19 per cent in 1977-78. In the outstanding
advances at Rs. 69.03 crores, medium-term loans at Rs. 14.70 crores
worked out to 21.3 per cent. Recovery performance did not materially
differ from that of the PACS inasmuch as the percentage of overdues to
outstanding loans on 30 June 1978 was about 38. The value of farm
requisites distributed by the FSS during 1977-78 was Rs. 30.88 crores
and the marketing operations undertaken were of the order of Rs.
4.44 crores. Nearly 34 per cent of the FSS (533 societies) had in-
curred losses in 1977-78.
1,577
3.276 2-10
611 0-40
17-30 1-10
6-86 0-40
59-34 3-76
55-91 3-55
69-03 4-38
26-19 1-66
61
4.45 A study of the working of 788 FSS, which were in business for
more than one year as on 1 January 1979, (excluding the gram-pan,'
chayat societies in Assam and the sericulturists-cum-FSS in Karnataka)
undertaken by the RBI in January-March 1980, revealed the follow-
ing position :
{i) A number of PACS co-existed in the jurisdiction of FSS in
Gujarat, Bihar, Maharashtra and Andhra Pradesh and they con-
tinued to disburse credit resulting in overlap of jurisdiction.
[ii) Large cultivators continued to wield influence over FSS
management. In Jammu and Kashmir and Uttar Pradesh, the
bylaws of FSS provided for only 50 per cent representation to
weaker sections on the managing committee as against two-thirds
representation envisaged in the model bylaws.
(m) The nominees ofstate governments and sponsor banks hardly
evinced adequate interest in the working of FSS.
{iv) The Managing Directors of a number of FSS, sponsored by
co-operative banks, were not well quaUfied and experienced to handle
efficiently the complex functions of these societies. In Andhra Pradesh,
Goa and Tamil Nadu the Managing Directors of FSS, being employees
of the state government/financing bank, on deputation, were frequently
transferred, depriving the societies of continuity of their service.
{v) Some of the FSS in Gujarat, Maharashtra, Orissa and Rajas-
than functioned without technical staff. In Andhra Pradesh and
Karnataka the technical personnel deputed by the State Governmen-
were withdrawn after sometime.
{vi) Only 39 out of 531 FSS, for which data were received, achie-
ved a loan business of more than Rs. 10 lakhs each by 1978-79. Long-
term credit disbursal was still negligible, being limited to a small
number of 19 FSS.
{mi) In Gujarat, Jammu and Kashmir, Madhya Pradesh and
Tamil Nadu, the share of weaker sections in short-term loans advanced
by FSS was relatively small, as indicated below :
(Rs. lakhs)
State
Total loans
disbursed
in 1978-79
Of which to
weaker
sections
Percentage
of (3) to
(2)
(1) (2) (3) (4)
Gujarat
Jammu & Kashmir
Madhya Pradeidi ..
Tami) Nadu
87-53
19-59
72-58
153-83
29-56
5-44
6-32
41-72
34
28
9
27
62
(viii) Except in Gujarat and Kerala, where the overdues in FSS
ranged between 20 and 40 per cent and 20 to 30 per cent of demand
respectively, the level of overdues in other states was quite high, at
about 50 to 60 per cent of demand as on 30 June 1979.
{ix) The limited range of non-credit functions related to supply
of farm inputs as also distribution of consumer goods.
{x) Marketing of farm produce was not arranged by many of
the FSS except a few in Andhra Pradesh and Kerala. Some FSS
in Maharashtra, Karnataka and Andhra Pradesh, however, collected
milk produced by their loanees and supplied it to government dairies.
(xi) Only in Kerala, FSS had sizeable deposits; 10 out of 13
FSS studied had deposits of more than Rs. 10 lakhs each. In Tamil
Nadu, 10 FSS had deposits of more than Rs. 3 lakhs each. A number
of FSS in Andhra Pradeshj Orissa and Maharashtra held no deposits.
In Haryana, the average deposit per FSS ranged around Rs. 0.60
lakh, while in Rajasthan, it was about Rs. 10,000.
4.46 The above findings point to the lack of enthusiasm on the part
of state governments and sponsor banks in giving the scheme of FSS
a fair trial. The commercial banks which sponsored them hardly
made use of them for deposit mop-up and lendings under the Differen-
tial Rates of Interest (DRI) Scheme; instead, they preferred to operate
through their own branches. It was observed during our field visits
that, more often than not, the operations of these societies failed to take
oif for want of a minimum infrastructure and a higher degree of mana-
gerial skill and competence. Illustratively, we cite the case of a FSS
in West Bengal, sponsored by one of the nationalised banks. This
society which started functioning from May 1975 had issued loans to
the tune of Rs. 14 lakhs over a period of 4 years, undertaken input
supplies and provided storage facilities to members. But, beyond
these, it colild not perform well owing to {a) absence of a compact and
contiguous area coverage, {b) non-availability of technical staff from
government for animal husbandry activities, (c) non-supply by the
Marketing Federation of hybrid seeds, {d) inadequacy of margin in
fertiliser supplies which landed the society in loss and {e) delay in
ground water survey to assess the potential for term lending for minor
irrigation programmes. On the other hand, the example of FSS
(including sericulturists-cum-FSS) in Karnataka amply demonstrates
that^ given proper assistance and infrastructural facilities, these socie-
ties can certainly render a good account of themselves. The average
lendings of FSS in this State worked out to Rs, 8.5 lakhs per society
in 1978-79, although the advances of some of the societies in Bangalore
63
district had touched the level of Rs. 30 to 40 lakhs. The sericulturists-
cum-FSS in this state had formulated 88 schematic lending pro-
jects, of which 42 had been cleared by the ARDC for its refinance
assistance. Of the 113 societies, 82 had lent nearly Rs. 8 crores during
1978-79; of this, the amount advanced for sericultural programme
alone was of the order of Rs. 2.32 crores. The societies, however,
reportedly faced stiff competition from their own sponsoring commer-
cial banks in increasing their loaning, because, the latter were directly
lending to individuals in their area of operations. All aspects consi-
dered, it is too premature to hazard any judgement on the performance
of FSS; but, one thing is clear, that, although, they are structurally
sound, they have not been given the requisite aid and opportunities
to work on the lines desired.
Large-sized Adivasi Multi-Purpose Co-operative Societies {LAMPS)
4.47 In pursuance of the recommendations of the Study (Bawa)
Team appointed by the Glovernment of India in December 1971,
LAMPS were organised in tribal areas with the objects of (?) providing
under a single roof, all types of credit including those for meeting
social obligations and consumer requisites, {ii) technical guidance
in the intensification and modernization of agriculture, and {Hi)
arranging for the marketing of agricultural and minor forest produce
besides the products of other subsidiary occupations of the tribals.
Like the FSS, these societies were expected to cover larger areas of
operation than the PAGS. At the end ofJune 1978, there were 1,424
LAMPS, largely concentrated in the tribal areas of Madhya Pradesh,
Maharashtra and Orissa. The progress of these societies in 1977-78
is indicated as under:
All LAMPS Average per
(Rs Crores) LAMP
(Rs. lakhs)
1. Number of LAMPS 14.24
2. Membership ('000) .. 15.42 M
3. Borrowing membership ('000) 3-92 0-3
4. Paid-up share capital (Rs.) 15.68 M
5. Deposits ( ,, ) 2-52 0-2
6. Other borrowings ( ,, ) 42-39 2-9
7. Loans issued ( ,. ) 25-21 1-8
8. Loans outstanding ( ,, ) 43-66 3-1
9. Overdues ( >. ) 23-23 1-6
Source: Statistical Statements Relating to the Co-operative Movement in India.
64
4.48 Of their total membership at 15.42 lakhs, 56.9 per cent were
scheduled tribes and the rest were scheduled castes and others inhabi-
ting the tribal areas. Members who borrowed during 1977-78 formed
25.4 per cent of the total membership. The average membership
and effective coverage in terms of borrowing membership per society
were 1,082 and 275 respectively. The working capital of the societies
amounted to Rs. 80.09 crores as on 30June 1978 giving an average of
Rs. 5.6 lakhs per society. Loans issued per society were Rs. 1.8
lakhs, preponderantly £is short-term credit while medium-term and
long-term loai3B formed only 27 per cent. Recoveries were poor and
overdues were mounting up alarmingly. At end June 1978, the
quantum of overdues was as high as Rs. 23.23 crores, constituting
53.2 per cent of the outstandings. As many as 519 societies, forming
36.4per cent ofthe total number of societies incurred losses in 1977-78.
4.49 Several problems seem to endanger the financial viability of
LAMPS. During our visit to Kunduli and Nandapur LAMPS in
Koraput district of Orissa and our subsequent discussions with the
concerned authorities ofthe State Government in December 1979, the
following problems were raised in regard to the viable functioning of
LAMPS:
(i) Only 10 out of 56 LAMPS in the district had taken the
initiative for collection of forest produce. The other LAMPS in the
area acted as agents of the lessee LAMPS. The agency commission
paid to them was insufficient to cover storage losses, damages and cost
of staff employed for the work.
{ii) Transportation charges were not being provided by the
Government in respect of consumer goods moved to outstations under
the scheme for distribution of controlled commodities. Added to this
was the absence of a realistic pricing policy for sale of old stock.
(m) The monopoly enjoyed by LAMPS for collection of all
minor forest produce was not enforced effectively. The sahukars
purchased some trees at low price and smuggled out the produce of
other trees as well. The Government was slack in enforcing the
monopoly.
{iv) The societies had not taken up long-term investment lending
aggressively. Financing of programmes of horticulture, sericulture,
cashew and coffee plantations, was yet to be actively pursued. The
Village Level Workers (VLWs) were not attending to agricultural
extension work properly.
[v) The LAMPS sustained losses in fertiliser distribution as
transport expenses were not reimbursed to them.
{vi) There was lack of managerial expertise.
65
(vii) The State Government did not provide adequate margins
in distribution arrangements entrusted to them.
4.50 Besides these reasons, due to frequent increases in royalties
payable on forest products, unhealthy competition faced from private
traders, absence of effective marketing organisation and market intelli-
gence service, lack of infrastructural arrangements for storage, trans-
portation and processing of forest products, resulting in underselling
of the collections of these products from members, insistence on landed
security from loanees in areas like Manipur where individual rights
in land do not exist etc., many of the LAMPS are finding it difficult
to show progress.
CREDIT ACTIVITY OF NON-CREDIT SOCIETIES
4.51 Besides PAGS, some of the non-credit co-operatives, such as
those undertaking marketing and processing of agricultural commo-
dities and functional societies which are activity-specific like dairy
co-operatives, poultry farming societies, fisheries' societies, etc., have
also assumed the credit-purveying role (Statement 4.10). Loans
disbursed by the marketing and processing societies were, by and large,
against pledge of agricultural produce and the bulk of such advances
was by the societies in Gujarat, Karnataka and Uttar Pradesh.
4.52 The functional societies which symbolise the group approach
or market-segment approach, are commodity-specific. Their
main aim is to assist their members to improve their bargaining power
vis-a-vis the suppliers of inputs and purchasers of their output. Credit
is only one of the items in their total operations. The available data on
the working of these societies presented in Statement 4.11 reveal that
their operations have significantly expanded over the last seven years,
viZ'i 1970-71 to 1977-78. Even though the general policy has been to
ensure channelling all the credit needs of rural households only through
PACS, some of these societies have continued to advance loans to their
members. Their trump card Ues in meeting the non-credit services
needed by their members without, at the same time, losing sight of
their credit needs.
CENTRAL CO-OPERATIVE BANKS (CCBS)
4.53 At the middle (district) level of the co-operative credit structure,
there were 338* CCBs with 6,835 offices at the end ofJune 1979. The
* Excluding data relating to 6 banks in Assam which were under process of amal-
gamation and later merged with the Assam Co-operative Apex Bank Ltd.
66
following table shows that, out of 338 GGBs as on 30 June 1978, 74
or 22 per cent had loan business of less than Rs. 2 crores each.
Number of banks as on 30 Jiine 1978
Size Deposits Loans and
advances
outstanding
Working
capital
(1) (2) (3) (4)
1. Below Rs. 50 lakhs 23 1
2. Between Rs, 50 lakbs and
Rs, 1 cTQreM .. .. .. 54 16 1
3, Between Rs. 1 crore and
Rs. 2 crores .. 88 57 24
4. Between Rs. 2 crores and
Rs. 3 crores .. 43 62 46
5. Between Rs. 3 crores and
Rs. 4 crores .. 30 37 50
6. Between Rs. 4 crores and
Rs, 5 crores .. .. 19 33 25
7. Above Rs. 5 crores .. 81 132 192
AveTage per bank (Rs. crores) .. 4-0 6-15 8-59
Source: Statistical Statements Relating to the Co-operative Movement in India
4.54 Generally, the jurisdiction of a GCB is confined to a district.
With a view to improve their contacts with and supervision over PACS
and also to mop up the savings of the rural comm-
Expansion unity through deposits, the GGBs have been encour-
aged to open branches in different parts of the district.
As a result, the number of branches increased from 3,434 in 1970-71 to
nearly 6j500 in 1978-79. However, from the point of view of intensive
supervision over the affiliated units, per-branch coverage of societies
was too wide in Assam and Bihar as may be seen from the following
data :
(As on 30 June 1979)
State
No. of
branches
ofCCBs
Coverage of
societies
per branch
State
No. of
branches
ofCGBs
Crf)verage
of societies
per branch
(1) (2) (3) (1) (2) (3)
Andhra Pradesh 292 64
Assam 6 100
Bihar 194 144
Gujarat 699 27
Haryana 160 48
Himachal Pradesh .. 53 42
Jammu and Kashmir 47 54
Karnataka .. 453 27
Kerala ..
Madhya Pradesh
Maharashtra
Orissa
Punjab ..
Rajasthan
Tamil Nadu
Uttar Pradesh
West Bengal
217 19
662 15
1498 23
118 42
511 32
214 47
356 33
863 19
154 62
Source: Reserve Bank of India.
67
4.55 Over the period 1970-71 to 1977-78, the owned funds of CCBs
rose by 2J times from Rs. 199 crores to Rs. 484 crores and further
to Rs. 533 crores at end June 1979. The state govern-
Owned Funds ments' contribution to the share capital of these banks
amounted to Rs. 88 crores or about 30 per cent of the
total as on 30* June 1978. Owned funds as a percentage of working
capital, however, dropped to 16.4 in 1977-78 from 18.4 in 1970-71.
4.56 The deposits held by CGBs increased from Rs. 438 crores at
end June 1971 to Rs. 1,377 crores at end June 1978. The co-operatives
accounted for 37 per cent of the deposits as on 30
Deposits June 1978. Nearly 60 per cent of the deposits amount-
ing to Rs. 825 crores were accounted by the banks in
Maharashtra, Tamil Nadu, Gujarat and Uttar Pradesh. Deposits
increased further to Rs. 1,654 crores at end June 1979. In relation to
working capital, the growth of deposits was steady from 40.6 per cent
in 1970-71 to 46.6 per cent in 1977-78 and to above 50 per cent in
1978-79. The rate of deposit growth was 20.1 per cent (1978-79)
which compared favourably with that of scheduled commercial
banks at 19.5 per cent. The spurt in deposits was largely due to con-
certed and sustained efforts made by CCBs in the wake of the Reserve
Bank*s scheme for linking its refinance assistance to the deposit mobili-
sation efforts of the banks. An extra ^ per cent interest offered by
them (over and above the ceiling rates of interest applicable to com-
mercial banks), as allowed by the RBI, also helped. The benefit of
insurance cover for depjosits of co-operative banks has been availed of
only in 13 states and 3 Union Territories.
4.57 The borrowings of CCBs increased from Rs. 393 crores at the
end of June 1971 to Rs. 928 crores at the end of June 1978 and to
Rs. 947 crores on 30 June 1979; but as a percentage
Borrowings and of working funds, they decreased from 36.4 per cent
in 1970-71 to 28.7 in 1978-79. Loans and advances
issued by the banks rose substantially from Rs. 894 crores in 1970-71
to Rs. 2,116 crores in 1977-78 and further to Rs. 2,407 crores in 1978-79.
Agricultural purposes continued to account for the bulk (73.4 per
cent) of their loan business as shown on the next page.
4.58 The studies on utilisation of medium-term loans conducted
by the Reserve Bank, in 1979-80, brought to light that the loaning in
several cases was not preceded by proper appraisal as to the economic
viability of the investment programme, that there was no verification
of end-use by the lending agency, that there was no arrangement for
68
LOAN BUSINESS OF GGBS
(Rs* crores)
Agricultural piuposes Non-agricultural purposes
Type of Credit
Issued in
1977-78
Outstanding
at end June
1978
Issued in
1977-78
Outstanding
at end June
1978
(1) (2) (3) (4) (5)
Short-term
Medium-term ..
TOTAL
1,349
204
1,553
1,247
454
1,701
517
(90)
46
(1)
563
335
(4)
414
Figures in bracket indicate advances for industrial purposes.
Source: Statistical Statements Relating to the Co-operative Movement in India.
post-disbursement follow-up and that the availability of infrastructural
facilities like assured supply of quality breeds of livestock, marketing
tie-up arrangements etc., was not ensured, as a result of which, the
borrowers tended to divert the loans for other purposes and misutilised
them. This underlines the need for greater vigilance and supervision
on the part of the banks.
4.59 In the matter of industrial financing, the advances of GGBs for
working capital purposes of industrial co-operatives increased from
Rs. 20 crores in 1970-71 to Rs. 90 crores in 1977-78.
Arf "**'^'*' Their lendings for block capital needs were negUgible
vances ^^ ^^^^ j^^ ^ ^^ crores in 1977-78 as against Rs. 0.82
crores in 1970-71. This was partly due to the non-availability of
long-term refinance assistance from the Reserve Bank which is not
legally permitted to provide such assistance to co-operative banks for
the purpose of acquiring block assets such as plant and machinery,
work sheds etc., by cottage and small-scale industrial co-operatives.
However, as stated earlier, GGBs have been permitted to involve
their own disposable long-term resources, to a limited extent, in provid-
ing block capital loan assistance to industrial societies. The more im-
portant reason for the inadequate progress in this regard, is the dormant
condition of a large number of industrial co-operatives. Thus, as on
30 June 1978, out of nearly 25,000 primary industrial co-operatives
(other than weavers' co-operatives) engaged in the groups of industrial
activities approved by the RBI for working capital refinance, as many
as 11,452 or nearly 46 per cent were dormant.
69
4.60 The aggregate credit flow to the industrial sector from CGBs
during 1977-78 formed only 4,3 per cent of their total advances in the
year; bulk of these loans was to co-operative spinning mills and hand-
loom weavers' co-operatives. Financial assistance to the handloom
sector was of two kinds, viz. (i) to the apex/regional weavers' societies
for trading in yarn and marketing of finished cloth and (w) to primary
weavers societies for their production and marketing activities. There
had been a significant rise in the magnitude of credit availed for these
purposes from the RBI as will be observed from the data given below :
April-March Drawals by SGBs OP the RBI's credit
limits for financing apex/primary weavers
societies
(Rs. crores)
1975-76 34
1976-77 36
1977-78 168
1978-79 127
Of the drawals in 1978-79, about Rs. 100 crores were for lending
to the weavers' societies in Tamil Nadu and about Rs. 18 crores in
Andhra Pradesh. As a measure to reduce the cost ofthis credit which is
intended to benefit one of the weakest sections of the community, the
rate of interest on refinance assistance provided by the Reserve Bank
for the purpose has been lowered to 2^ per cent below the Bank Rate
from 1 March 1978. Advances to industrial co-operatives other than
handloom societies are yet to look up, mainly because a large number
of such units in the country continue to be dormant, despite the Reserve
Bank's advice to the state governments, as far back as October 1968,
to conduct surveys for identifying the viable and potentially viable
industrial societies for stepping up credit assistance to them from the
co-operative financing system. The need for reorganization of
industrial societies on viable basis had again been brought home to the
state governments in the Reserve Bank's circular dated 17 May 1979,
issued in the context of the recommendations made by the Working
Group on Small Scale Industries with special reference to District
Industries Centres.
4.61 Overdues at the level of CCBs rose to 38 per cent of the demand
as on 30 June 1978 from 34.5 per cent on 30 June 1971. Statewise,
the overdues of CCBs in Assam and Bihar amounted
Loan Recoveries to more than 70 per cent of the demand for 1977-78
and between 40 and 55 per cent in the case of CGBs
in Andhra Pradesh, Gujarat, Himachal Pradesh, Jammu & Kashmir,
70
Madhya Pradeshj, Maharashtra and Rajasthan. As on 30 June 1979,
Mdbarashtra, Tamil Nadu, Uttar Pradesh and Gujarat together
accounted for 51.1 per cent of the total overdues in the country at
GCB level. The classification of 313 CCBs (for which data on overdues
as on 30 June 1979 are available) was as under :
Percentage of Overdues No, of CCBs
to Demand
Upto 20 . . . . 44
Betweeu 20 and 40 113
„ 40and60 .. . . . . 107
Above 60 49
313
Source: Reserve Bank of India.
Thus, 49 CCBs had overdues exceeding 60 per cent of demand and
hence were primafacie ineligible for credit limits from the Reserve Bank
of India.
4.62 Against the background of the rising overdues and the conse-
quent deterioration in the financial position of many CCBs, a pro-
gramme of rehabilitation was introduced in 1971, in respect of CCBs
whose bad and doubtful debts, accumulated losses and overdues over
3 years exceeded 50 per cent of their owned funds. Initially, accord-
ing to the criteria, 64 CCBs in 12 states were brought under the pro-
gramme of rehabilitation on the basis of their financial position as on
30 June 1970. The number of such banks increased to 180 as on 30
June 1977. The programme envisaged investigation of overdues with
a view to identifying irrecoverable debts and ascertaining the reasons
for overdues, augmenting the bad debts reserve of the concerned banks
to cover the bad debts, coercive steps for recovery of chronic overdues,
rationalisation of loan policies and procedures of CCBs, strengthening
of the supervision machinery, mobilisation of resources, toning up the
management of the banks^ training and professionalization of staff
etc.
4.63 As paucity of resources with some CCBs constituted the main
obstacle in writing off their irrecoverable dues and accumulated losses
and improving their financial position, the GOI introduced in January
1972, a Central Sector Plan Scheme under which Central/State Govern-
ments provided grants-in-aid to 'weak' CCBs for the purpose with
reference to their financial position as on 30 June 1971. Upto 30
71
June 1979, under this scheme, the GOI released assistance of Rs. 781.42
lakhs in respect of 146 CGBs in 15 states and Rs. 14.71 lakhs in respect
of 3 SGBs in the areas served by the two-tier credit structure. As a
result of the above assistance provided under the scheme, a substantial
number of the banks have improved their financial position. The
Central Sector Plan Scheme has been discontinued by the GOI with
effect from April 1980.
4.64 The RBI had been reviewing from time to time the criteria for
considering a CCB as weak so that the banks which have improved
their position could be excluded from the rehabilitation programme.
Accordingly, in November 1979, the RBI laid down revised normis,
for deletion of a CCB from the list of 'weak' banks, viz.,
(i) The bank's financial position is such that its estimated bad
and doubtful debts, accumulated losses and other overdues over 3
years no longer exceeded 50 per cent of its own funds.
( a) The bank has shown an average annual growth rate of
10 per cent in respect of deposits and loans outstanding during the
preceding 3 years.
4.65 On the basis of the above revised norms, 106 CCBs were
retained in the list of 'weak' CCBs with reference to their financial
position as on 30 June 1978 for the purpose of rehabilitation pro-
gramme.
4.66 The implementation of the rehabilitation programme has not
been uniformly satisfactory in all the states, as evidenced by the deter-
ioration in recovery performance referred to earlier. According to
a review, made by the Reserve Bank, of the progress of rehabilitation
programme as on 30 June 1979, many of the banks have not drawn up
the annual plans covering all aspects of the rehabilitation programme.
Certain SCBs have yet to create rehabilitation cells as recommended.
Similarly, in some states, the State and District Level Committees
have not been constituted to monitor the programme of rehabilitation,
while in many states, the committees have not been meeting as fre-
quently as required. Investigation of overdues on a scientific basis
at the level of PACS had not been completed by the banks in many
states viZ'i Andhra Pradesh, Assam, Bihar, Orissa, Punjab and Uttar
Pradesh. As a result, the amount released by the Government of
India under the Central Sector Plan Scheme has not been fully uti-
lised by the banks. Had the assistance been fully utilised, the finan-
cial position of these banks would have improved. Further, it has
72
been observed that the assei^ment and write off of irrecoverable over-
dues has not been done in accordance with the instructions of the GOI,
for example, by some of the CCBs in Karnataka. Also as on 30 June
1979, sizeable amounts have been reported to be involved in arbitra-
tion cases and execution petitions in certain states, viz-, Andhra Pra-
desh and Jammu & Kashmir. The slow pace of disposal of arbitra-
tion cases and execution of awards clearly indicates the lack of serious-
ness on the part of the agencies implementing the programme of re-
habilitation. Again, certain measures essential to complement the
rehabilitation programme such as revitalization of PACS, selection
of^ertain good working societies for intensive development, strengthen-
ing and improving the arrangements for supervision over field staff,
mobilization of resources etc., have not been taken up with the de-
sired degree of earnestness.
STATE CO-OPERATIVE BANKS (SCBS)
4.67 At the apex level of the state co-operative credit structure are
26 State Co-operative Banks* with 360 offices (as on 30 June 1979).
Over the years, their overall financial position has
Resources shown considerable improvement with an expanded
resource base. Between 1970-71 and 1977-78, their
owned funds increased from Rs. 93 crores to Rs. 214 crores. At end-78
June 1979, their owned funds at Rs. 239 crores formed about 12 per
cent of their total working capital. Their deposits also recorded a
fast growth from Rs. 279 crores in 1970-71 to Rs. 1,004 crores in 1977-78
and further to Rs. 1,206 crores in 1978-79. Nearly 56 per cent of
the deposits as on 30 June 1979 were held by four SCBs viz., Mahara-
shtra (27 per cent), Gujarat, Uttar Pradesh (10 per cent each) and
Tamil Nadu (9 per cent). The bulk of the deposits (79 per cent of
the total deposits as on 30 June 1978) had accrued from within the
co-operative sector representing the investment by the central co-
operative banks of their statutory reserve fund, agricultural credit
stabilisation fund, bad debts reserve, gratuity and provident fund of
employees, etc., and deposits eligible to be reckoned towards their
statutorily stipulated liquid assets besides the deposits kept by primary
co-oi>erative banks and non-credit co-operatives like co-operative
marketing societies, co-operative spinning mills, co-operative sugar
factories, etc. This was in tune with the state policy to ensure that
the investible funds of the various types of co-operative organizations
should, as far as possible, be conserved for deployment within the
* Excludes Arunachal Pradesh State Co-operative Bank.
73
co-operative system itself. Deposits gathered by SCBs from outside
the co-operative system, mz^j individuals and institutions, con-
stituted 21 per cent of the total deposits at end June 1978. Owned
funds and deposits together amounted to Rs. 1,445 crores at end June
1979 constituting 72.3 per cent of the working capital of SCBs at
Rs. 2,000 crores.
4.68 As on 30 June 1979, the borrowings of SCBs at Rs. 454 crores
accounted for 22.7 per cent of their working capital, indicating a
decrease of over 20 per cent from the 1970-71 position.
Adva^nTe?^ ^"*' Their outstanding habiUties to the RBI stood at Rs.
360 crores which, as a proportion to their working
capital, formed only 18 per cent as against 35.3 per cent in 1970-71„
It may be noted in this context that although the Reserve Bank has
the capacity and the intention to expand rural credit through the
co-operative organizations by providing funds at low interest rates,
subject to the discipline stipulated by it, the co-operative credit system
is unable to absorb an increasing quantum of such resources year after
year, owing to its inability to comply with the discipline required of it.
This is evident from the fact that, while the short-term agricultural
credit limits of the Reserve Bank had increased from Rs. 390 crores
in 1970-71 to Rs. 748 crores in 1977-78, and further to Rs. 799 crores
in 1978-79, the percentage of utilisation of the limits had declined from
74 to 59 over the same period. In the case of medium-term credit
limits for agricultural purposes, the utilisation of the limits averaged
around 56 per cent during the last six years ended December 1978.
4.69 Between 1970-71 and 1978-79, there was nearly a threefold
increase in the lending operations of SCBs, the quantum of loans issued
having gone upto Rs. 2,237 crores in 1978-79 from Rs. 749 crores in
1970-71. The loans outstanding stood at Rs. 1,396 crores as on 30
June 1979 as against Rs. 534 crores at the end of 1970-71. In deploy-
ment of resources, agriculture received the lion's share, the short-term
credit for production constituting about 88 per cent of the total agri-
cultural loans. Non-agricultural advances have also increased from
20 per cent of the total loans issued in 1970-71 to 33 per cent in 1977-
78 as may be seen from the following table. Non-agricultural ad-
vances were, in the main, meant for financing consumption purposes
and working capital requirements of handloom production-cum-
marketing co-operatives, co-operative spinning mills, co-operative
sugar factories, monopoly cotton procurement, distribution of consu-
mer goods through co-operatives, etc. As a result of deliberate pohcy
pursued by the Reserve Bank, the SCBs have been enabled to invest
74
thtk own r^ources increasingly in non-agricultural sector which ppo-
vidcs a higher interest margin, with a view t^- off-setting the losses
incurred by them in agricultural lending at the pooled rate of in-
terest.
LOAN Bt^mEss OF SCBS
(Rs. crores)
1970-71 1977-78
Purpose Z^aus issued
during the year
Outstanding
at.the.end .
of theye^ =
Loans issued Outstanding
during the year at the end pf
the year
ST. M.T. S.T. M.T. S.T. M.T. S.T. M.T.
(1) (2) (3) (4) (5) (6) (7) (8) (9)
Agricultural 574 31 349 66 1,185 168 745 236
Non-agricultural 129 15 9Q 29 636 33 280 77
TOTAL 703 46 439 95 1,821 201 1,025 313
Source: Statistical Statements relating to the Co-operative Movement in India.
INDUSTRIAL CO-OPERATIVE BANKS
4.70 Besides SCBs and CCBs, some Industrial Co-operative Banks
have been functioning in a few states. They cater to the credit needs
of village/cottage industrial co-operatives (other than co-operative
sugar mills and spinning mills) and in exceptional cases, of individual
craftsmen and self-employed technocrats. In Rajasthan and Tamil-
Nadu, an apex level Industrial Co-operative Bank with state-wide
jurisdiction exists, while in Gujarat, Maharashtra and Karnataka, a
few district-level bajiks are working in some of the districts. The
position of these banks is indicated in Statement 4.12.
4.71 We have noted earlier that the RBI has, as a rule, preferred to
route its financial accommodation for cottage and village industries,
through the regular co-operative credit system, i. e., SCBs and CCBs
and hence, it has been advocating either the conversion of the exist-
ing industrial co-operative banks into urban co-operative banks with
their clientele limited to urban industrial co-operatives, bringing the
rest of their constituents within the CCB's financing orbit or their total
merger with the CCB itself. There is, however, resistance to this idea
from the Industrial Co-operative Banks and also from some of the
concerned state governments. Those who advocate the continuance
of these special banks argue that the established co-operative financing
75
system which is traditionally oriented to agriculture may adopt apa-
thetic and unenlightened attitudes towards the credit needs of indus-
trial co-operatives. One of the reasons cited in support of these banks
is that the industrial co-operatives are the administrative responsibi-
lity of the Industries Department in the state government while SCBs
and CCBs fall within the jurisdiction of the Go-operative Department.
LONG-TERM CO-OPERATIVE CREDIT
4.72 The long-term co-operative credit structure is federal in some
states and unitary in others. Bihar, Gujarat, Jammu and Kashmir,
Maharashtra and Uttar Pradesh have unitary structure
Structure and where the SLDB concerned finances individuals
Progress
directly through a network of its branches. In other
states except Himachal Pradesh and West Bengal which have a mixed
pattern, the structure is federal with PLDBs as affiliates. As at end
June 1978, there were 19 SLDBs, operating through 999 branches
and 889 PLDBs with about 6 million farmers on their roUs^ covering
nearly 11 per cent of the estimated farm households in the country.
4.73 Table below presents a summary of the progress registered by
LDBs over the period 1970-71 to 1977-78.
(Rs. crores)
SLDBs
1970-71 1977-78
~) ST
PLDBs
1970-71 1977-78
(3) (4)
1. Owned Ainds ..
2. Deposits and other borrowings
3. Debentures outstanding
4. Working capital
5. Loans issued ..
6. Loans outstanding
58 213 48 97
24 50 449 719
725 1,690 — —
841 2,082 551 896
168 239 119 160
638 1.305 448 735
Source: Statistical Statements Relating to the Co-operative Movement in India.
4.74 Long-term credit dispensed through PLDBs and branches of
SLDBs in 1977-78 to about 5 lakh borrowers were of the order of
Rs. 239 crores while the amount outstanding at end June 1978 came to
Rs. 1,305 crores. The lending programme of SLDBs in the financial
year 1978-79 was fixed at Rs. 419 crores, comprising Rs. 271 crores
for the ARDC-aided schemes and Rs. 148 crores under ordinary
lending programmes. Against this programme, the actual disbursals
at the level of primary units were of the order of Rs. 244.16 crores
76
maddvup of Rs. 147.23 crores under the ARDC schemes and Rs. 96.93
crords under ordinary pro^ammes.
4.75 Statewise disbursement of long-term credit through PLDBs/
branches of SLDBs during the last five financial years (1974-75 to
1978-79) is given in Statement 4.13. It will be seen therefrom that
the magnitude of lending is showing a declining trend even in some
of the co-operatively well-developed states.
4.76 Purposewise, minor irrigation accounted for 60 per cent of
the total lending in 1977-78, followed by farm mechanization and
land improvement (Statement 4.14). Loans bene-
tion of UJIBS*'*" fiting artisans and landless labourers reported in
Andhra Pradesh, Kerala, Haryana and Punjab were
negligible. Evidently, the main thrust in the lending activities of
LDBs continues to be on financing land-based activities. Even in
the states where LDBs arc legally entitled to lend for non-land based
purposes, {e. g., Kerala, Kamataka, Haryana, Punjab, West Bengal)
financing of such activities which would benefit the rural poof
has not been taken up in a big way, due presumably to lack of expertise
and technical know-how with the LDBs for such lending. The
declining potential for traditional lending avenues such as minor
irrigation investments points to the need for the banks to explore non-
traditional avenues of lending, both land-based and non-land based,
such as sericulture, horticulture, plantations, dairy farming, animal
husbandry, social forestry, etc.
4.77 Mention may be made here of the Committee on Land Develop-
ment Banks appointed by the RBI under the Chairmanship of Shri
K. Madhava Das in 1973. The committee's report,
onToBs** published in 1975, made several recommendations
pertaining to the organisational, structural and
operational aspects of the LDBs. The more important of them were:
{i) co-ordination between LDBs and other institutions including the
short-term structure and the development departments of the state
governments; {ii) concerted action towards improving recovery
performance; (m) changes in legal framework to boost the operational
efiiciency of LDBs in the eastern and north-eastern states; {iv) diversi-
fication of lending operations and linking of lending to specific agri-
cultural and other development programmes; and {v) strengthening
of managerial and supervisory machinery and building up of technical
staff. These recommendations are being pursued by the RBI with
state governments. Admittedly, the progress of implementation is
rather slow.
77
4.78 The operational efficiency and organisational competence of
many of the LDBs leave much to be desired. Bearing testimony
to this, is the rising overdues at the primary level
which increased from Rs. 149.76 crores at end June
Rising Overdues 1977 to Rs. 226.57 crores at end June 1979. Both
in absolute quantum and as percentange of demand,
the overdues at the level of PLDB/branches of SLDBs have increased
in Andhra Pradesh, Assam, Bihar, Gujarat, Jammu & Kashmir,
Karnataka, Madhya Pradesh, Tamil Nadu, Uttar Pradesh and West
Bengal as will be seen from the data given below:
(Amount in Rs. crores)
Overdues as on 30 June
1977 1978 1979
(Provisional)
State Amount % of Amount % of Amount % of
overdue overdues overdue over- overdue overdues
to dues to to
demand demand demand
(1) (2) (3) (4) (5) (6) (7)
Andhra Pradesh .. .. .. 5-11 15-1 11-17 28-8 16-50 33-4
Assam .. 0-11 44-6 O i l 40-6 0-21 51-1
Bihar .. 12-66 41-9 18-93 61-0 22-75 59-5
Gujarat .. 29-09 38-1 39-15 68-7 44-76 74-6
Jammu & Kashmir. .. 0-45 47-1 0-51 43-5 0-68 49-4
Karnataka .. .. 15-53 54-6 N.A. N.A. 19-59 47-9
Madhya Pradesh • .. 9-18 50-0 13-22 47-0 18-76 56-6
Tamil Nadu .. 15-05 51-1 32-38 67-1 52-51 80-8
Uttar Pradesh .. 11-27 23-9 15-09 26-6 1911 27-6
West Bengal .. 0-49 17-5 1-14 25-4 2-35 39-1
Source: Reserve Bank of India.
Statewise position of PLDBs/branches of SLDBs classified accor-
ding to the range of their overdues to demand, as on 30 June of the last
four years (1974-75 to 1977-78), is indicated in Statement 4.15.
As on 30 June 1979, according to available information, 925 PLDB/
branches of SLDBs had overdues not exceeding 25 per cent of demand
for 1978-79, while 360 PLDBs/branches of SLDBs had overdues above
55 per cent. The classification of the units according to the range of
their overdues was as under:
78
iUoge of ov^dues to demand No. of Units
25 per cent or less .. .. .. .. .. 925
Between 26 per cent and 35 per cent ., . . . . 167
,, 36 per cent and 40 per cent . . . . .. 50
,, 41 per cent and 50 per cent . . . . ., 138
,, 51 per cent and 55 per cent .. .. .. 97
Above 55 per cent .. .. .. .. .. 360
Source: Reserve Bank of India.
4.79 Several factors haye contributed to the rising trend of overdues.
The more important of these are: faulty loan proposals and lending
without an integrated programme; laxity in post-credit follow-up
and monitoring of end-use; lack of technical guidance to the loanees;
natural calamities; and above all, wilful default. The observations
we have made earlier regarding the deterioration in recovery cUmate
in the short-term credit structure and the unhelpful attitude of some
of the state governments also apply generally to the long-term credit
structure. Leaving aside such external factors which are outside
the control of LDBs, it is necessary to draw attention to one important
internal factor within the control of LDBs. During our field visits
we have noticed that very little has been done to ensure that the
investment credit borrowers reap the full benefit of their investment
on completion of the project through the application of the needed
production credit. As LDBs did not always furnish a list of their
borrowers to PACS in their jurisdiction, long-term loanees were not
assured of production credit support as a matter of course. The
absence.,of any eiFective operational Hnk between PLDBs/branches
of SLDBs and short-term credit wing has given rise to problems of
inability of the co-operative credit system to assess the credit-worthiness
and credit-servicing capacity of its clientele in a complete manner,
taking note of the totaUty of credit support needed by the borrower,
and the additional income potential expected to be generated by the
investment for servicing the loan.
4.80 As mounting overdues in some states, as stated above, have
virtually thrown out of gear the financing operations of LDBs, attempts
are being made to rehabilitate such of those PLDBs/branches of
SLDBs, the overdues of which exceed 50 per cent of demand and
which are either viable or poentially viable. On the basis of the
overdues position as on 30 June 1977, as many as 505 out of 1881
PLDBs/ branches of SLDBs, were stated to be under rehabilitation
programme.
79
CO-OPERATIVE CREDIT IN THE N E W CONTEXT
4.81 It will be observed from the discussions in earlier paragraphs
that the co-operative credit system has, to its credit, several achieve-
ments and, at the same time, its working has thrown up certain pro-
blems that need immediate attention. No doubt, to build up a
democratic countrywide organisation upto the village level for dis-
pensing rural credit is no easy task. Over the years, the co-operative
movement has evolved different types of co-operative credit insti-
tutions which, despite all their faults and shortcomings, have the
requisite potential to cater to the diverse credit needs of the rural
areas. If suitable changes and improvements are made, they will be
able to meet the new challenges underlying the concept of integrated
rural development.
4.82 About 57 per cent of the total number of PAGS were not viable
as on June 30, 1978. Continued non-viability of a very large number
of PACS is attributable to poor membership coverage and still smaller
number of borrowing members, lack of supervision over the end use of
credit, lack of complementary services, absence of tie-up with develop-
ment plans and programmes and consequently the poor recovery
performance. In our view, these are the factors which have not only
placed serious constraints on the business expansion of PACS but
rendered several of them dormant. The large scale efforts made
through the reorganisation and revitalisation programmes in most of
the states were a step in the right direction. According to available
information, the reorganisation process has now been completed in
many of the states. While this is an important step towards ensuring
viability of the base level organisation, it must be pointed out that
viability is not a static concept, and that, as costs go up along with
service expansion and diversification, viability standards have to be
raised suitably and hence, continuous efforts would be needed to
achieve such higher levels of performance.
4.83 The co-operatives, along with other agencies, have to meet the
credit needs of various target groups in rural areas. This would,
on their part, call for a large-scale coverage of families belonging to
poorer groups, both land-based and non-land-based. This, however,
raises a host of basic issues which have been very succinctly stated by
the Dantwala Committee on RRBs (1977). To quote it:
"This phenomenon needs a deeper analysis than it has received
so far, especially in the context of our endeavour to ensure uni-
to
versal membersliip. Who are these non-borrowmg members?
Do they belong to a class of farmers (and others) who have no
need to borrow because they have enough resources of their
own? Or are they ineligible for borrowing because they are not
'creditworthy' ? Or, worse still, are they eligible but are unable
to borrow because the management of the societies is averse to
accommodating them ? Do the societies suffer from paucity of
funds, as a result of which they can accommodate only less than
40 per cent of its members? Whether the structural and operational
innovations we have introduced and propose to introduce are
meaningful or not for solving the problems of rural credit, will
depend on precise answers to these questions."
(P. 10)
4.84 The underlying objective of the programme of reorganisation
is to ensure that the reorganised societies are developed into viable
ones so as to render them an effective vehicle to
Viability Aspect purvey multipurpose credit and to carry multi-service
to the rural community, paying greater attention to
the needs of the poorer sections. But, the programme, so far, has not
paid sufficient attention to this essential perspective nor focussed on
integrated rural development. The reasons for this need to be
analysed and the measures required to carry the reorganisation
programme to its logical end, spelt out.
4.85 PACS is commended as an ideal credit institution at the grass-
root level for the following reasons: (z) the rural community being
involved in the operations of co-operatives, it is in the best position
to judge the effectiveness of credit; {ii) deposit mobilisation can be
promoted, and {Hi) the cost of service will be minimal compared to
other credit delivery systems. All the same, it is to be realised that
PACS, as at present situated^ are not competent enough to handle
multi-term and multi-purpose credit. It is, therefore, necessary to
consider the steps essential for strengthening and activising them so
that they can rapidly build up their organisational effectiveness and
capacity to meet the needs of accelerated rural development. This
would largely depend upon their financial soundness and managerial
efficiency. The build-up of internal resources including deposits
would pave the way for their successful operations. But, efforts made
up till now for mobilising deposits are relatively negligible in all the
states except Kerala and Punjab. The problem, therefore, is how to
encourage PACS in all the states to develop a strong deposit base.
81
4.86 The need to reorient the functioning of PACS to meet, in full
measure, the requirements of the weaker sectionsof the rural community
and to build up in them a managerial system which will be responsive
to this commitment, cannot be over-emphasised. How this can be
ensured and what modifications are called for in their present structure
and operations are matters that will have to be examined.
4.87 The policy, currently followed, is to discourage functional
societies taking up credit activity primarily on the score that this is
the legitimate business of PACS. In view of the need to draw a clear
distinction between the financing of an individual for his multifarious
pursuits, land-based, or otherwise, and a group of individuals for a
common service or activity undertaken by it, the question that arises
is, whether, the functional societies should be totally barred from
lending to their members.
4.88 At the structural level, the issues that arise in the overall context
of the need to cater to the entire gamut of rural productive activities
is, whether any particular advantages are derived from a three-tier
system of co-operative credit or whether the goals could be better
secured through a more compact two-tier structure. Yet another
question is whether, for achieving integration of production and
investment credit programmes, there is need for a complete structural
integration of the short-term and long-term structures of the co-
operative credit system or whether functional integration without
merging the two can secure the purpose in view.
4.89 One of the most disquieting features of the co-operative system
in recent times has been its excessive politicisation. It has become
a common feature particularly at the time of elections for the politicians
of most hues to indulge in adverse propaganda concerning repayment
of co-operative dues. Even more disheartening is the tendency of
some of the state governments as stated earlier to stall recovery of
co-operative loans by staying the recovery proceedings launched against
defaulters. Some of the state governments e.g., Maharashtra and
Tamil Nadu have even resorted to exempting the whole classes of
defaulters from payment of their dues to PACS and to pay the said
amounts to the institutions from the exchequer.
4.90 Another form in which politicisation has manifested itself is
the ad hoc supersession of elected board of management of co-operative
banks by state governments by exercising the powers conferred on
them therefor under the State Co-operative Societies Act, and, the
Chapter 04
Chapter 04
Chapter 04
Chapter 04
Chapter 04
Chapter 04
Chapter 04
Chapter 04
Chapter 04
Chapter 04
Chapter 04
Chapter 04
Chapter 04
Chapter 04
Chapter 04
Chapter 04
Chapter 04
Chapter 04
Chapter 04
Chapter 04
Chapter 04
Chapter 04
Chapter 04
Chapter 04
Chapter 04
Chapter 04
Chapter 04
Chapter 04
Chapter 04
Chapter 04
Chapter 04
Chapter 04

More Related Content

What's hot

Co operative banking system - origin, scope, object
Co operative banking system - origin, scope, object Co operative banking system - origin, scope, object
Co operative banking system - origin, scope, object
DiyaNandi1
 
Rural banking
Rural bankingRural banking
Rural banking
Ashish Mohan
 
Co operative banking in india
Co operative banking in indiaCo operative banking in india
Co operative banking in india
yogesh ingle
 
Role of rrb and fi in india
Role of rrb and fi in indiaRole of rrb and fi in india
Role of rrb and fi in india
ShradhaRao4
 
Project on Banking
Project on BankingProject on Banking
Project on Banking
Raj vardhan
 
205 Financial Markets and Banking Operations MCQ 6
205 Financial Markets and Banking Operations MCQ 6205 Financial Markets and Banking Operations MCQ 6
205 Financial Markets and Banking Operations MCQ 6
ASM's IBMR- Chinchwad
 
Cooperativecredit
CooperativecreditCooperativecredit
Cooperativecredit
Dr-Eknath Mundhe
 
The government telecommunication employees co operative society ltd
The government telecommunication employees co operative society ltdThe government telecommunication employees co operative society ltd
The government telecommunication employees co operative society ltd
Viknesh Vijayakumaar
 
Unit 1 regional rural banks
Unit 1  regional rural banksUnit 1  regional rural banks
Unit 1 regional rural banks
Gagan bhati
 
Cooperative Credit Institutions
Cooperative Credit InstitutionsCooperative Credit Institutions
Cooperative Credit Institutions
Harsha Aswani
 
B036209011
B036209011B036209011
B036209011
inventionjournals
 
Urban Co-operative Bank
 Urban Co-operative Bank Urban Co-operative Bank
Urban Co-operative Bank
Dona Sara Jacob
 
Understanding the Finance Industry in Rural India PPT | RC&M India Experienti...
Understanding the Finance Industry in Rural India PPT | RC&M India Experienti...Understanding the Finance Industry in Rural India PPT | RC&M India Experienti...
Understanding the Finance Industry in Rural India PPT | RC&M India Experienti...
RC&M India - Experiential Rural Marketing
 
Regional Rural Banks
Regional Rural BanksRegional Rural Banks
Regional Rural Banks
JiniaBanerjee1
 
Financial accounting project on NKGSB Co-operative Bank
Financial accounting project on NKGSB Co-operative Bank Financial accounting project on NKGSB Co-operative Bank
Financial accounting project on NKGSB Co-operative Bank
Anjali Modi
 
Co operative
Co operativeCo operative
Co operative
Mahek Chheda
 
Cooperative bank
Cooperative bankCooperative bank
Cooperative bank
Gurpreet Brar
 
National federation state co operative bank
National federation state co operative bankNational federation state co operative bank
National federation state co operative bank
Nemi Verma
 
Co operative banking in india
Co operative banking in indiaCo operative banking in india
Co operative banking in india
Prof. Devrshi Upadhayay
 
15 dr kavita_kalkoti
15 dr kavita_kalkoti15 dr kavita_kalkoti
15 dr kavita_kalkoti
SRJIS
 

What's hot (20)

Co operative banking system - origin, scope, object
Co operative banking system - origin, scope, object Co operative banking system - origin, scope, object
Co operative banking system - origin, scope, object
 
Rural banking
Rural bankingRural banking
Rural banking
 
Co operative banking in india
Co operative banking in indiaCo operative banking in india
Co operative banking in india
 
Role of rrb and fi in india
Role of rrb and fi in indiaRole of rrb and fi in india
Role of rrb and fi in india
 
Project on Banking
Project on BankingProject on Banking
Project on Banking
 
205 Financial Markets and Banking Operations MCQ 6
205 Financial Markets and Banking Operations MCQ 6205 Financial Markets and Banking Operations MCQ 6
205 Financial Markets and Banking Operations MCQ 6
 
Cooperativecredit
CooperativecreditCooperativecredit
Cooperativecredit
 
The government telecommunication employees co operative society ltd
The government telecommunication employees co operative society ltdThe government telecommunication employees co operative society ltd
The government telecommunication employees co operative society ltd
 
Unit 1 regional rural banks
Unit 1  regional rural banksUnit 1  regional rural banks
Unit 1 regional rural banks
 
Cooperative Credit Institutions
Cooperative Credit InstitutionsCooperative Credit Institutions
Cooperative Credit Institutions
 
B036209011
B036209011B036209011
B036209011
 
Urban Co-operative Bank
 Urban Co-operative Bank Urban Co-operative Bank
Urban Co-operative Bank
 
Understanding the Finance Industry in Rural India PPT | RC&M India Experienti...
Understanding the Finance Industry in Rural India PPT | RC&M India Experienti...Understanding the Finance Industry in Rural India PPT | RC&M India Experienti...
Understanding the Finance Industry in Rural India PPT | RC&M India Experienti...
 
Regional Rural Banks
Regional Rural BanksRegional Rural Banks
Regional Rural Banks
 
Financial accounting project on NKGSB Co-operative Bank
Financial accounting project on NKGSB Co-operative Bank Financial accounting project on NKGSB Co-operative Bank
Financial accounting project on NKGSB Co-operative Bank
 
Co operative
Co operativeCo operative
Co operative
 
Cooperative bank
Cooperative bankCooperative bank
Cooperative bank
 
National federation state co operative bank
National federation state co operative bankNational federation state co operative bank
National federation state co operative bank
 
Co operative banking in india
Co operative banking in indiaCo operative banking in india
Co operative banking in india
 
15 dr kavita_kalkoti
15 dr kavita_kalkoti15 dr kavita_kalkoti
15 dr kavita_kalkoti
 

Similar to Chapter 04

Credit Policy for Agriculture in India
Credit Policy for Agriculture in IndiaCredit Policy for Agriculture in India
Credit Policy for Agriculture in India
Ashok Taradale
 
Str11 fpa
Str11 fpaStr11 fpa
National Economic Survey - Volume I - Chapter 7 Golden Jubilee Of Bank Nation...
National Economic Survey - Volume I - Chapter 7 Golden Jubilee Of Bank Nation...National Economic Survey - Volume I - Chapter 7 Golden Jubilee Of Bank Nation...
National Economic Survey - Volume I - Chapter 7 Golden Jubilee Of Bank Nation...
DVSResearchFoundatio
 
Rm presentation (2)
Rm presentation (2)Rm presentation (2)
Rm presentation (2)
JOYAL SANDEEP
 
Jiyaaa maaaammmmmmmmmmmmm
Jiyaaa maaaammmmmmmmmmmmmJiyaaa maaaammmmmmmmmmmmm
Jiyaaa maaaammmmmmmmmmmmm
Harish Yadav
 
Agriculture finance
Agriculture financeAgriculture finance
Agriculture finance
Karan Kukreja
 
Regional rural banks
Regional rural banksRegional rural banks
Regional rural banks
Palak Sodhi
 
Banks performance analysis
Banks performance analysisBanks performance analysis
Banks performance analysis
Mallikarjun Doddamane
 
12 chapter 5
12 chapter 512 chapter 5
12 chapter 5
TANUJ1234
 
nabard ppt
nabard pptnabard ppt
nabard ppt
Venu Praveen
 
Trends in Agricultural Credit
Trends in Agricultural CreditTrends in Agricultural Credit
Trends in Agricultural Credit
Dr. Amarjeet Singh
 
Current trends in banking sector (2015) Edition
Current trends in banking sector (2015) EditionCurrent trends in banking sector (2015) Edition
Current trends in banking sector (2015) Edition
Isha Desai
 
Role of rbi & co operative movement
Role of rbi  & co operative movementRole of rbi  & co operative movement
Role of rbi & co operative movement
Zenobia Sukhia
 
Macroeconomics Role Of Institutional Credit For Economic Growth
Macroeconomics   Role Of Institutional Credit For Economic GrowthMacroeconomics   Role Of Institutional Credit For Economic Growth
Macroeconomics Role Of Institutional Credit For Economic Growth
Spartanski
 
Ee bank
Ee bankEe bank
Ee bank
hii_bharti
 
Beacon.april.2014
Beacon.april.2014Beacon.april.2014
Lecture 13.pptx
Lecture  13.pptxLecture  13.pptx
Lecture 13.pptx
yazirp
 
Agricultural finance
Agricultural financeAgricultural finance
Agricultural finance
Prashant Arsul
 
Rural Financial Markets and Agricultural Credit
Rural Financial Markets and Agricultural CreditRural Financial Markets and Agricultural Credit
Rural Financial Markets and Agricultural Credit
Zain Khan
 
Report presentation
Report presentationReport presentation
Report presentation
Zain Khan
 

Similar to Chapter 04 (20)

Credit Policy for Agriculture in India
Credit Policy for Agriculture in IndiaCredit Policy for Agriculture in India
Credit Policy for Agriculture in India
 
Str11 fpa
Str11 fpaStr11 fpa
Str11 fpa
 
National Economic Survey - Volume I - Chapter 7 Golden Jubilee Of Bank Nation...
National Economic Survey - Volume I - Chapter 7 Golden Jubilee Of Bank Nation...National Economic Survey - Volume I - Chapter 7 Golden Jubilee Of Bank Nation...
National Economic Survey - Volume I - Chapter 7 Golden Jubilee Of Bank Nation...
 
Rm presentation (2)
Rm presentation (2)Rm presentation (2)
Rm presentation (2)
 
Jiyaaa maaaammmmmmmmmmmmm
Jiyaaa maaaammmmmmmmmmmmmJiyaaa maaaammmmmmmmmmmmm
Jiyaaa maaaammmmmmmmmmmmm
 
Agriculture finance
Agriculture financeAgriculture finance
Agriculture finance
 
Regional rural banks
Regional rural banksRegional rural banks
Regional rural banks
 
Banks performance analysis
Banks performance analysisBanks performance analysis
Banks performance analysis
 
12 chapter 5
12 chapter 512 chapter 5
12 chapter 5
 
nabard ppt
nabard pptnabard ppt
nabard ppt
 
Trends in Agricultural Credit
Trends in Agricultural CreditTrends in Agricultural Credit
Trends in Agricultural Credit
 
Current trends in banking sector (2015) Edition
Current trends in banking sector (2015) EditionCurrent trends in banking sector (2015) Edition
Current trends in banking sector (2015) Edition
 
Role of rbi & co operative movement
Role of rbi  & co operative movementRole of rbi  & co operative movement
Role of rbi & co operative movement
 
Macroeconomics Role Of Institutional Credit For Economic Growth
Macroeconomics   Role Of Institutional Credit For Economic GrowthMacroeconomics   Role Of Institutional Credit For Economic Growth
Macroeconomics Role Of Institutional Credit For Economic Growth
 
Ee bank
Ee bankEe bank
Ee bank
 
Beacon.april.2014
Beacon.april.2014Beacon.april.2014
Beacon.april.2014
 
Lecture 13.pptx
Lecture  13.pptxLecture  13.pptx
Lecture 13.pptx
 
Agricultural finance
Agricultural financeAgricultural finance
Agricultural finance
 
Rural Financial Markets and Agricultural Credit
Rural Financial Markets and Agricultural CreditRural Financial Markets and Agricultural Credit
Rural Financial Markets and Agricultural Credit
 
Report presentation
Report presentationReport presentation
Report presentation
 

Chapter 04

  • 1. CHAPTER 4 EXISTING INSTITUTIONAL RURAL CREDIT STRUCTURE AND TRENDS IN RURAL CREDIT INSTITUTIONAL credit system for the rural sector started with the organisation of co-operative credit societies at the beginning of the century to emphasise thrift and mutual help. The co-operative credit system was refurbished in the mid-fifties in the wake of the re- commendations of the AIRCS Report. Following it, the GOI, the RBI and the state governments made special efforts to foster the growth of the co-operative movement. However, co-operative credit could not be developed uniformly in all parts of the country. Pari passu, the credit needs of the agricultural sector, which were the primary concern of co-operatives, increased rapidly due principally to the biological and technological developments in crop and animal hus- bandry. Commercial banks were, therefore, inducted into the field of agricultural credit under the policy of 'social control' over banks in 1967. Subsequent nationalisation of the 14 major scheduled com- mercial banks, in 1969, carried this process further. As the RCRC report put it in 1969: "At the same time, effort in the sphere of rural credit should not be solely concentrated in the co-operative sector. Go-operatives should be strengthened, but they would be all the better — and the farmer better served — if other institutions co-existed with them in healthy competition." (R 411) This approach which has come to be known as the 'multi- agency approach' provides for commercial banks serving as an addi- tional source of credit to the rural sector. A later innovation (1975) was the organisation of Regional Rural Banks (RRBs) in select areas with their focus exclusively on the small/marginal farmers, agricultural labourers and rural artisans. I. OVERALL SET-UP 4.2 Under the multi-agency approach to rural credit, both the co- operative and commercial banking sectors receive active financial 36
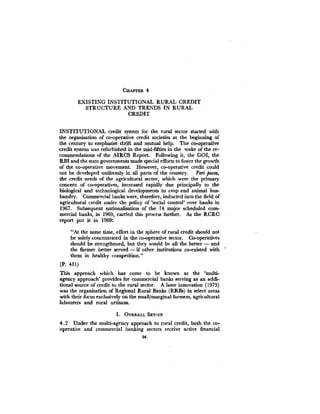
  • 2. 37 and non-financial support from the Central and State Governments and national level institutions such as the Reserve Bank of India, the Agricultural Refinance and Development Corporation, the Industrial Development Bank of India (IDBI), the National Co- operative Development Corporation (NCDC), etc. Chart 4.1 along- side presents the existing institutional channels for rural credit. The field level institutions which provide credit to individual borrowers consist of (z) primary agricultural co-operative credit societies pro- viding both short-term and medium-term credit to their members, {ii) primary co-operative land development banks or branches of state co-operative land development banks (SLDBs) dispensing long- term credit to their members, (m) branches of commercial banks and (iv) branches of regional rural banks. While the institutions at (m) provide multi-purpose and multi-term credit to all categories of persons engaged in agriculture and other rural economic activities, those at {iv) serve, at present, a restricted clientele, as a deliberate policy. 4.3 As explained in Chapter 1, the Committee reviewed, in the first instance, the national level credit institutions and made its recommen- dations which are reproduced in Part III of this Report. In this chapter, the Committee reviews the working of the existing rural credit institutions in the context of the integrated rural development approach described in Chapter 3. II. OVERALL PROGRESS 4.4 At the outset, it is necessary to note that complete data on the total institutional credit advanced in the rural sector for all years on a comprehensive basis are not available. We shall therefore confine our review to credit for agriculture for which the data are available. Loans outstanding increased from Rs. 1,075 crores in June 1969 to Rs. 6,325 crores in June 1980 (Statement 4.1). Of the total agri- cultural credit outstanding at the end of June 1980, co-operatives accounted for 59.4 per cent, commercial banks for 38.8 per cent and RRBs for 1.8 per cent (Chart 4.2). Investment credit, which amounted to Rs. 499 crores or 46 per cent of the total outstanding in 1969 increased to Rs. 3,563 crores or 56.3 per cent in 1980. The sizeable increase in the quantum of investment credit as also its share in the total credit is attributable to the efforts of the ARDC. Both co-operatives and commercial banks contributed to this increase. In the total investment credit outstanding at the end of June 1980, the share of co-operatives was 59 per cent, that of commercial banks 39 per cent and RRBs 2 per cent.
  • 3. 38 EXISTING INSTITUTIONAL SET-UP FOR RURAL FINANCE jonol £1/ Notional UlMtl Stole Level District Level Primary Level GOVERNMENT OF" INDIA IAFC RESERVE BANK OF IWDJA 1 NCDC i__r ARDC AAAAA/I^AAAAAAAAAAAAAAAAAAAAAAAAA PiAAAAAi AAA » » H K II » * z z z z z z z z : SLDBs (19) » y X * *••• » ? Cofnnnerck(( Banks C58) PLDBs(889) and SLD8 Branches ( 9 9 9 ) I K HtK * * y-r-, , - i l » « p . . « p . | ™ . zz Izizztzzzzzzz'zi iznzzzzzzi^z' !;Jzi zMzzzzzI • ! • • I I ? A 3 4 I Z : A : ; • z t i l '• z i • • z I *. IDBI State Governments J . . I . J_ S C B s ( 2 6 ) RRBs{84) Comm»rciaf Bank Branches (14,669) r-p^ Small farmers • < v Stote/Centrol Industrial Co-ope«3tive Banks (10), Branches(64) CCBs(330> RRB Branches (2059) PACS/FSS/ LAMPS (1.16,125) Industrial Co-operatives Other farmers rRural Artisans : I + - - { — r + ;-» Agricul- tural Labourers .J_ Other Rural Enterprises tlOther Rural HousehoJds ivIOTE : (1) Figures tn brackets indicate the lotest ovailoble number. (2) Some functional societies olso advance loans to their respective groups. •• Aflriculturdl Finance Corporation provides coSultoncy asjistance to other rurol financing ogencle$ and Gdveriunents • In the smaller States/Union Terj-ifories the SCBs directly finance ihe PACS
  • 5. 40 4.5 The data on loans issued during the year are presented in State- ment 4.1. In the case of commercial banks, these data are available only from 1974-75. Loans issued by co-operatives during the year, for short-term and term purposes, which amounted to Rs. 1,039 crores in 1974-75 increased to Rs. 1,744 crores in 1979-80. The annual average increase was Rs. 141 crores or 10.8 per cent. In the case of commercial banks, total loans issued increased, over the same period, from Rs. 274 crores to Rs. 1,045 crores, yielding an annual average increase of Rs. 154 crores or 31.3 per cent. The share of commercial banks in the total loans issued by co-operatives and commercial banks which was 21 per cent in 1974-75 increased to 36 per cent in 1979-80. In terms of the type of credit, the share of commercial banks in term credit increased from 31 per cent in 1974-75 to 50 per cent in 1979-80. Go-operatives, on the other hand, conti- nued to dominate the short-term credit scene, although, their share declined from 84 per cent in 1974-75 to 70 per cent in 1979-80. The third type of credit institution viz-, RRB is of recent origin ; their share of the total in 1979-80 amounted to 3 per cent in short-term loans and 5 per cent in term loans. 4.6 The National Commission on Agriculture (1976) had estimated the credit requirement for full programme coverage by 1985 a,, Rs. 16,549 crores. The more comprehensive integrated rural credit approach and the accelerated rural development visualised in the Sixth Plan are bound to create additional demand for credit and therefore, the total demand for credit would be of a far higher order than that estimated by the NCA. As against this expected large need of rural credit, an attempt has been made below to project the likely supply of credit based on the present trends and the likely per- formance of rural credit institutions in the current decade. 4.7 Between 1975 and 1980, short-term loans issued by co-opera- tives increased at an average annual rate of Rs. 94 crores or about 10 per cent. In the case of commercial banks, the increase was of the order of Rs. 65 crores or about 27 per cent. In respect of investment credit, the average annual rate of growth of advances, over the same period worked out to Rs. 47 crores or 13 per cent in the case of co- operatives and Rs. 89 crores or 36 per cent in the case of commercial banks. As regards RRBs, though separate data for loans issued during each year are not uniformly available, we have to note that during the short period of their working, they have made considerable progress. As a good number of RRBs are expected to be set up during the next few years, this agency may be able to increase its lending sizeably in the next decade.
  • 6. 41 4.8 The aggregate loans issued by all these agencies in 1979-80 amounted to Rs. 2,889 crores. Based on the rate of increase in credit disbursal during the last five years, an attempt has been made to project the level of credit likely to be reached by co-operatives and commercial banks in 1989-90 on a linear basis. In regard to RRBs, however, the estimate is based on an informed judgement on the pro- gress of RRBs that are already in the field, the number likely to be organised in the next five years and the viability norms evolved for them. ESTIMATES OF AGRICULTURAL C R E D I T D I S B U R S A L IN 1 9 8 9 - 9 0 (Rs. crores) Short- Term Term Total Institutions 1979-80 1989-90 (Projec- tion) 1979-80 1989-90 (Projec- tion) 1979-80 1989-90 (Projec- tion) (1) (2) (3) (4) (5) (6) (7) Co-operatives Commercial banks .. RRBs TOTAL 1,218 470 44 1,732 2,100 1,050 350 3,500 526 960 575 1,370 56 350 1,157 2,680 1,744 3,060 1,045 2,42® 100 700 2,889 6,180 Thus the disbursement of credit by the rural credit institutions is expected to reach the level of about Rs. 6,180 crores in 1989-90. While these rough projections indicate the progress likely to be made by institutional lending agencies by 1989-90, the real problem is to meet the credit requirements of integrated rural development with special attention to vulnerable groups and backward areas. Regional Variations in Credit Disbursal 4.9 Some idea of the spatial distribution of credit for agriculture can be had by working out the quantum of loans per hectare of gross cropped area by all credit institutions in each state. Though subject to limitations arising from the wide diversity in regard to natural endowments, input supplies and the need for credit, this, nonetheless, provides a rough indicator of the disparities in credit distribution. 4.10 In Statement 4.2, the states are ranked in a descending order of total agricultural loans issued per hectare of gross cropped area in 1977-78. Alongside, per hectare data on loans issued during 1974-75 and 1977-78 and outstanding at the end of 1974-75 and 1977-78 are given. Loans issued by all credit institutions in the whole of India
  • 7. 42 increased from Rs. 112 per hectare in 1974-75 to Rs. 134 per hectare in 1977-78. Similarly, outstanding credit also increased from Rs. 158 per hectare at end 1974-75 to Rs. 255 per hectare at end 1977-78. 4.11 In the ranking of states according to loans isucd in 1977-78, Kerala came first with Rs. 343 per hectare of gross cropped area followed by Tamil Nadu (Rs. 341), Punjab (Rs. 273) and Haryana (Rs. 234). In Andhra Pradesh, Gujarat, Karnataka, Maharashtra, Uttar Pradesh and West Bengal, credit per hectare ranged between Rs. 110 and Rs. 178. In the other states, credit per hectare was less than Rs. 75, the lowest being in Assam at Rs. 6 (Charts 4.3 and 4.4). 4.12 In four states viz., Himachal Pradesh, Jammu and Kashmir, Maharashtra and Gujarat, loans issued per hectare in 1977-78 re- presented a decline compared to 1974-75, but the fact that credit outstanding per hectare had increased during this period implied that the overdues have risen. 4.13 In Statement 4.3, the major states are ranked according to percentage distribution of agricultural loans issued by co-operatives (including LDBs) and commercial banks separately during 1974-75 and 1977-78. These data reveal that in terms of percentage, agri- cultural loans issued by the two credit agencies in both the years broadly correspond in many of the states. The significant exceptions are Maharashtra and Gujarat where co-operatives have a larger share compared to commercial banks. In Kerala, the proportion of agri- cultural credit issued by commercial banks is larger than that of co- operatives. The same position emerges even when states are ranked on the basis of loans outstanding at the end of each of the two years. 4.14 To indicate the degree of association between these two series of data, the method of rank correlation was employed. The* coeffi- cient of correlation worked out to -j- 0.8. This broadly confirms the observation that the percentage share of loans by co-operatives and commercial banks in different states was more or less the same. Thus, as the Dantwala Committee on RRBs concluded, commercial banks' agricultural credit has been additive and has not helped to fill the geographical gaps in the availability of credit not covered by co-opera- tives.* *Page 32 of the Report.
  • 8. 43 PER HECTARE CREDIT ISSUED ALL INDIA KERALA TAMIL NADU PUNJAB - • HARYANA UJARAT MAHARASHTRA • • • • • • • KARNATAKA ANDHRA PRADESH- UTTAR PRADESH WEST BENGAL ORISSA- RAJASTHAN JAMMU AND KASHMIR MADHYA PRADESH BIHAR HIMACHAL PRADESH- ASSAM ••••••*•••••»« <I2 lllllllllllllllllllllllllll 134 3 0 0 MliMMmilMIHIIIINIIIIIIIIillllllllllllllllllllllll 3 4 3 341 177 2 7 3 ffimiwitMftmiiiiiiiiiiiiiiiiiiiir^^ 140 fttiniiiiiiiiiHiiiiiim^m- 178 lllllillHIIIilllllHIIIHM 144 164 :J 107 iiiiiJiiiiiiiHiiiiinim^'"^ iiiiiiiiiiNiiniHiir^-* 3 7 no [unniwrn^^ 3 4 60 5 7 7777777773 5 2 1 5 2 3 2 47 T56 3 8 260 226 m :J3 O H > m > o o c c > o - - g o c H > m (/) ^ O O C •z. o (5 -^ -(^ I --J > o CO - J I 00
  • 9. 44 PER HECTARE CREDIT OUTSTANDING ALL-IMDIA' (KERALA ^ ^ TAMIL NADU' PUNJAB HARYANA GUJARAT MAHARASHTRA' 158 255 3 3 4 3 9 0 rn 237 173 s I 354 347 q 3 6 7 KARNATAKA' ANDHRA PRADESH" WTTAR PRADESH- WEST BENGAL' ORISSA . . « . « » . . « . - . RAJASTHAN JAMMU AND KASHM4R MADHYA PRADESH- BIHAR HIMACHAL PRADESH ASSAM -V 2 3 0 3 0 6 ^ ^ 9 0 3 3 0 168 S 3 6 3 iiTi'iyfi'Mii^^^ . . ; . . . | 69 7 8 133 4 9 101 riri'mi'-^^ 88 78 3 0 I 151 148 H 219 Tl ^^ FH 43 580 6 73 ^ m 3> m o H > m > o o c ^ c: :xi 3> r- o JO m o O c H C/) H > m o H "^> 1 m o "n m -< m S to > z o I 00 •!l.^i>3^[J«J^•>«XiK rjirir-iyiarnri'Tir-'^ i? M-a-je*
  • 10. 45 Coverage of Weaker Sections 4.15 Loans to small farmers (less than two acres) and other weaker sections accounted for 31.5 per cent of the outstanding credit as at the end of June 1978 and 38.5 per cent of the loans issued in 1977-78 by scheduled commercial banks and co-operatives (Chart 4.5). In the case of both these types of institutions, credit purveyed to this class of borrowers recorded an increase over the period. Thus, in the case of co-operatives, loans to this class formed 30 per cent of credit extended in 1974-75 and the proportion increased to 39.3 per cent in 1977-78. In the case of commercial banks, the corresponding proportions were 36 per cent and 39 per cent respectively. Go-operative credit to scheduled castes and tribes formed about 10 per cent of the total credit in 1977-78. 4.16 Against this overall background, the performance of these three credit institutions in the field of rural credit is reviewed and their major problems identified, in the following sections. III. CO-OPERATIVE CREDIT 4.17 The primary agricultural credit societies functioning at the base of the co-operative credit system constitute the major retail out- let of short and medium-term credit to the rural sector. Attempts have been made to strengthen them through structural reorganiza- tion and rationalisation of their operations, particularly in respect of financing seasonal farm activities, through a production-oriented system of lending called the crop loan system. 4.18 The structural reform has been in the direction of determining the optimum size and nature of functions of the society so as to make it economically viable and managerially efficient. ofVocStils''" The official policy as to the size of the society cry- stallized around the mid-sixties. At the Conference of the State Ministers for Co-operation held in 1964 at Hyderabad, it was decided, inter-alia, that, for attaining the minimum criteria of viability such as ability to appoint a full-time paid secretary, to set up a regular office, to contribute to reserves and to pay dividend, areawise standards of the quantum of business necessary for the society should be worked out and that a survey should be carried out for the purpose of drawing up programmes of reorganization through amal- gamation of non-viable units and liquidation of defunct ones. Re- organization on this basis was expected to be completed by
  • 12. 47 1966-67, resulting in a reduction of the total number of societies to 1.20 lakhs. However, even at the end of 1-967-68, the number of societies remained at 1.75 lakhs. In 1973, the Working Group on Co-operation for the Fifth Five Year Plan recommended that a PACS might be treated as viable only when it reached a minimum short- term agricultural credit business of Rs. 2 lakhs. Again, at a meeting of the Registrars of Co-operative Societies convened by the RBI in May 1976, it was decided that, for the purpose of viability, a normal cropped area of 2,000 hectares might be considered adequate to provide a minimum short-term credit potential of Rs. 2 lakhs. Fur- ther, in order to remove the existing lacunae in legal procedures which were responsible to some extent for the delays in implementing the reorganization programme, it was suggested to amend the State Co-operative Societies Acts to provide for compulsory amalgamation of societies. 4.19 Thanks to continuous efforts for more than a decade to push through the reorganization programme, the number of PACS declined to 1,16,125 in 1977-78 and further to 94,503 at the Reo?gln%aJion ^""^ of June 1979* as against 90,000 estimated to remain ultimately in the field. Out of 1,16,125 societies as on 30 June 1978, only 49,453 societies were considered as viable as per the business norm mentioned above. According to information available, the process of reorganization is either complete or in progress in all the states except Jammu & Kashmir, Gujarat and Maharashtra. In Gujarat, the Co-operative Societies Act needs to be amended to provide for compulsory amalgamation of societies. In Maharashtra, the State Government has reservations about the prescribed norms of viability. As a result, the number of societies in Maharashtra continues to be more than 18,000 as against 10,000 viable units that the state government had decided upon at one stage in September 1975. Performance of PACS 4.20 The latest published data on the performance of PACS relate to 1977-78. Statement 4.4 shows the salient features of the societies in 1970-71 and 1977-78. In Statement 4.5, provisional data relating to their operations during 1978-79 are presented. Excluding 8,994 dormant societies which were to be liquidated or merged in the process of reorganization, there were 1.07 lakhs active societies at the end of *Data on co-operative credit for 1978-79 used in this chapter are provisional.
  • 13. 48 June 1978 which covered 5.28 lakhs villages or 90.9 per cent of the total number of villages in the country, the average coverage per active society being about 5 villages. The population of the villages covered accounted for 88.6 per cent of the total rural population in the country. 4.21 The total membership of PACS increased from 31 million in 1970-71 to 47.9 million in 1977-78 and further to 51.8 million in 1978-79 registering an increase of 67.1 per cent over anTMemtoSiip 1970-71. Of the 47.9 milUon members, as on 30 June 1978j 36.8 million were cultivators, 4.3 million were agricultural labourers and 0.8 million were rural artisans. The membership of weaker sections comprising small farmers (having operational holdings of not more than 2 hectares each), agricultural labourers and rural artisans totalled 26.3 million, constituting 54.9 per cent of the aggregate membership as on 30 June 1978. 4.22 Notwithstanding the increase in membership and in also those borrowing amongst them, the borrowing membership, expressed as a percentage to total membership, declined from wTe^mb^rehip 36.0 per cent in 1970-71 to 34.4 per cent in 1977-78. According to the provisional data for 1978-79, the proportion of borrowing members to total membership has recorded only a marginal increase to 36.5 per cent. In 1977-78, borrowing membership as a proportion of total membership was below the all- India percentage of 34.4 in several states as may be seen from the following : STATES WHERE THE PERCENTAGE OF BORROWING MEMBERSHIP WAS BELOW THE ALL-INDIA PERCENTAGE State Percentage of borrowing membership to total membership in 1977-78 State Percentage of borrowing membership to total membership in 1977-78 (1) (2) (1) (2) 1. Andhra Pradesh .. 28-1 2. Assam .. .. 0-7 3. Bihar .. 26-2 4. Himachal Pradesh .. 31-2 5. Jammu & Kashmir 24-7 6. Kamataka .. .. 24-5 7. Madhya Pradesh 30-2 8. Maharashtra 27-0 9. Manipur .. .. 5*7 10. Meghalaya .. .. 28-8 11. Nagaland .. .. 15-4 12. Orissa .. .. 21-8 13. Tripura .. .. 11-8 Source 1977-78. Statistical Statements Relating to the Co-operative Movement in India,
  • 14. 49 The indebted membership (22.8 million) of societies at the end of 1977-78 formed 47.6 per cent of the total membership. 4.23 The position of borrowing membership of weaker sections and others as on 30 June 1978 was as shown below : Group No. of Percentage of No. of Percentage of members membership borrowers borrowing (in million) to total households in the gproup (in million) membership in the group (1) (2) (3) (4) (5) 1. Small Farmers (i. e. those whose holdings do not exceed 2 hectares) 21-2 43 7-7 36-3 2. Other farmers 15-6 68 8-0 51-3 3. Tenants, agricultural labourers and others I M 52 0-8 7-2 47-9 52 16-5 52 Sources : (i) Statistical Statements Relating to the Co-operative Movement in India. (ii) For groups 1 and 2 :—^Agricultural Census 1971. (in) For group 3 :—^All India Debt and Investment Survey, 1971-72. Scheduled castes and scheduled tribes together accounted for 21.3 per cent of the total membership ; amongst them, those borrow- ed in 1977-78 and those indebted at the end of the year were 30.4 per cent and 42.1 per cent, respectively, of their total membership. 4.24 The paid-up share capital of societies increased from Rs. 205.74 crores in 1970-71 to Rs. 420.69 crores in 1977-78 and further to Rs. 455.47 crores in 1978-79, raising the average Financial share capital per society to Rs. 48 thousands in Position 1978-79 from Rs. 13 thousands in 1970-71. In the matter of deposit mobilisation, the deposits held byallthePAGS were only Rs. 211.44 crores as on 30 June 1979, as against Rs. 69.46 crores as at end June 1971. Deposits accounted for 7.1 per cent of their working capital at end June 1979. The societies in Kerala and Punjab held sizeable deposits, the former with Rs. 92 crores and the latter with Rs. 25 crores as on 30 June 1979. Both these States together accounted for 55.4 per cent of the deposits mobilised by all PACS in the country as on that date. Borrowings
  • 15. 50 from higher financing agencies increased from Rs. 675 crores at end- June 1971 to Rs. 1,727 crores at end-June 1979, accounting for 58.4 per cent of the working funds of societies and signifying their conti- nued heavy dependence on borrowed funds. 4.25 The proportion of societies which issued loans to their members increased from 73 per cent in 1970-71 to 77 per cent of total during 1977-78. The loans issued increased from Rs. 578 Loan Business crores in 1970-71 to Rs. 1,270 crores in 1977-78 and further to Rs. 1,409 crores in 1978-79. Of the total short-term loans and advances of Rs. 1,111 crores in 1977-78, crop production finance amounted to Rs. 1,033 crores, consisting of Rs. 581 crores in cash and Rs. 452 crores in kind by way of seeds, fertilisers and pesticides. Credit disbursed in kind formed 43.8 per cent of the crop loans issued in 1977-78 as against only 11.1 per cent in 1973-74.* Out of medium-term (excluding conversions) advances of Rs. 98 crores in 1977-78 (as against Rs. 58.54 crores of such advances in 1970-71), those for minor irrigation programmes were Rs. 23 crores followed by those for dairying activities amounting to Rs. 22 crores. The volume of short and medium-term loans issued during 1978-79 by the societies in 5 states viz., Gujarat, Kerala, Maharashtra, Punjab and Tamil Nadu adding to Rs. 673 crores, accounted for 47.8 per cent of the total advances of PACS in the country. On the other hand, the loan business of societies in states like Assam, Bihar, Hima- chal Pradesh, Jammu & Kashmir, Manipur, Meghalaya, Nagaland and Tripura was relatively low. The total outstanding loans of PACS increased from Rs. 784.48 crores at end June 1971 to Rs. 1,798.07 crores as on 30 June 1978 and further to about Rs. 2,008 crores at end June 1979, comprising Rs. 1,513 crores of short-term loans and Rs. 494 crores of medium-term loans. 4.26 Over the period 1970-71 to 1977-78, the average share capital and deposit held per member increased from Rs. 61 and Rs. 15 to Rs. 76 and Rs. 24, respectively, (Statement 4.4). Performance ^^^ average loan amount per borrowing member rose to Rs. 772 from Rs. 514 during the same period. The average amount of loans outstanding per society at Rs. 0.49 lakh as at end June 1971, had moved upto Rs. 1.55 lakhs by June 1978 and further to Rs. 2.12 lakhs by June 1979. However, in terms of outstanding short-term agricultural loans, the average per society was only Rs. 1.16 lakhs on 30 June 1978 and Rs. 1.60 lakhs as on •Information relating to years prior to 1973-74 is not available
  • 16. 51 30 June 1979. This was below the prescribed viability standard of Rs. 2 lakhs. While the total advances of societies increased by 119.7 per cent between 1970-71 and 1977-78, the number of borrowing members increased by only 46.7 per cent. It will be seen from Statement 4.6 that in Bihar, Himachal Pradesh, Jammu & Kashmir, Madhya Pradesh and Punjab the number of borrowing members had decreased over the period 1970-71 to 1977-78 ; but the loans issued had recorded an increase. In Andhra Pradesh, Haryana, Orissa, Rajasthan, and West Bengal, both the magnitude of lendings and the borrowing membership increased ; but the percentage in- crease of the former was sharper than the latter. It has, therefore, to be inferred that the increased credit had not benefited a larger number of members in these states. 4.27 The state-wise position of PACS considered as viable, those working at profit/loss as on 30 June 1978, etc., is indicated in State- ment 4.7. Statement 4.8 presents the averages per society in respect of membership, borrowing membership, share capital, working capital, deposits, loans, etc., in each state for 1970-71 and 1977-78. It is observed from these data that in the matter of increasing effective coverage, deposits and loan business, Kerala has done relatively better. Co-operative Credit to the Rural Poor 4.28 Since the beginning of this decade, a significant shift has been effected in the loan policies of co-operatives for meeting the credit needs of the small/marginal farmers and other weaker sections of the rural community. The Reserve Bank stipulated in 1970-71, that 10 per cent of the drawals on its short-term credit Hmits granted to Central Co-operative Banks (CCBs) should be for financing small and marginal farmers defined for this purpose as those having operational holdings of 1.2 hectares ( 3 acres) or less. This percentage was raised to 20 from 1971-72. In 1975-76, this norm was finked to the loans issued to small farmers during the year instead of loans out- standing (which was the norm till then). In 1976-77, the parameters for identification of small farmers for this purpose were revised so as to range from 1 hectare to 3.2 hectares (2.5 acres to 8 acres), taking note of the geo-physical and agro-climatic conditions of each district in the country. To ensure compliance with this condition, drawals on the RBI's short-term credit Umits in excess of 70 per cent are per- mitted only if 20 per cent of the loans advanced in the year have gone to small farmers. Thus, the flow of credit to the weaker sections
  • 17. 52 increased from Rs. 213 crores in 1973-74 to about Rs, 490 crores in 1977-78. Of the total advances of the societies during 1977-78, loans to members holding land upto 1 hectare amounted to Rs. 198 crores and to those having more than one hectare but not exceeding 2 hec- tares, Rs. 246 crores, i.e. 15.5 per cent and 19.3per cent,respectively, of the total advances. The share of tenant-cultivators was Rs. 30.90 crores or 2.4 per cent of the total and of agricultural labourers, a little over one per cent. The landless labourers, rural artisans and marginal farmers holding lands of not more than 0.2 hectare (0.5 acre) each, numbering 2.91 lakhs in all, were assisted with consumption credit by 10,326 PACS (out of the total of 1.16 lakh PAGS) to the extent of Rs. 8.47 crores in 1977-78. 4.29 In regard to long-term credit for which fragmentary data are available in respect of 13 states and one Union Territory for 1977-78, disbursements to 3.70 lakh farmers amounted to Rs. 179 crores; of this, Rs.67 crores or 37.4 per cent had gone to 1.71 lakh cultivators with land holdings upto 2 hectares each. 4.30 The weaker sections were also given the benefit of a lower rate of interest on loans. Besides, they are to contribute at a concessional rate of 5 per cent of the loans to be advanced to them as share capital as against the usual 10 per cent of the loan amount to be held as shares by other members. With a view to enabling even the relatively weak PACS to serve as channels of credit, particularly in the special scheme areas or co-operatively underdeveloped or weak states, the Reserve Bank has liberalised its norms of eligibility of credit institutions in regard to overdues percentage for purpose of share capital contribution by state governments from loans out of its Long Term Operations Fund. The SFDAs and also some of the state governments provide, wherever necessary, loans to small farmers*/agricultural labourers to enable them to contribute the initial share capital required for enrolment in co-operatives. The ARDG has committed itself to ensuring that at least 60 per cent of its disbursements are utilised for meeting the investment needs of small farmers. Small farmers, for this purpose, are defined as those cultivating land, providing a pre- development net return to family resources to such farmers, not exceeding Rs. 2,000 per annum at 1972 prices. They are also entitled to other concessional terms like 5 per cent down payment as com- pared to 10 to 15 per cent stipulated for medium and large farmers *Small farmers for this purpose are generally defined as those having operational holding of not more than 1 hectare of irrigated land and 2 hectares of dry land.
  • 18. 53 besides longer repayment schedule, running upto 15 years, especially for minor irrigation investments. 4.31 Although the provision of outright grants to the Special Bad Debt Reserve of PACS and CCBs under a Central Sector Plan Scheme to serve as an incentive for financing small and economically weak farmers ceased with the Third Five Year Plan, the SFDAs have been contributing to the "Risk Fund" of the lending agencies for encourag- ing them to finance the identified small farmers, in an increasing measure. Such contributions in respect of short-term loans are made at the rate of 4 per cent and 2 per cent of the additional quantum of advances made in a year by PACS and CCBs, respectively. In the case of medium-term credit, the rate of contribution is 4 per cent and 2 per cent to PACS and CCBs, respectively, on the total quantum of loans advanced to the identified small farmers. Primary land deve- lopment banks are given "risk fund contribution" at 2 per cent of the total long-term advances made to the identified farmers. As on 30 June 1978, the risk funds (including the special bad debt reserve created earlier) to the credit of both PACS and CCBs aggregated Rs. 61.88 crores. Complete and precise information regarding the utilisation of these Funds for writing off irrecoverable dues of small and marginal farmers is not available. A sample study of the utilisa- tion of risk fund by PACS, conducted during November 1980 by the Co-operative Department of the Government of Kerala, in 4 SFDA districts i.e., Trivandrum, Quilon, Trichur and Cannanore, revealed that many of the societies had invested the risk fund in term deposits with the CCB. This was because of the absence of specific instructions from the Registrar of Co-operative Societies and the SFDAs concerned regarding the manner of utilisation of the fund for write off purposes. In terms of SFDA's instructions, the Registrar of Co-operative Socie- ties is vested with the power to accord sanction to write off irrecoverable dues. However, there seems to have been no attempt so far to make an assessment of the irrecoverable dues of small and marginal farmer- borrowers. Thus the non-utilisation of the fund, for the purpose for which it was intended, was due to the lethargy of the bureaucracy in the matter of issuing suitable guidelines, spelling out the modalities of assessment of bad debts and their write off. PACS were afraid of opening the issue on their own. In fact, they have been shying off from the issue. The procedure laid down for this purpose also seems to be cumbersome. All this needs to be looked into. 4.32 To ensure that non-wilful, small farmer-defaulters to the co- operatives are not handicapped for want of credit to carry on their
  • 19. 54 production and investment programmes, co-operatives were advised by the Reserve Bank, in pursuance of the decision taken by its Agri- cultural Credit Board in December 1979, that cultivators holding 1 hectare of irrigated land or 2 hectares of dry land and whose defaults involve small amounts, not exceeding 10 per cent of their eligibility under short-term agricultural loans, could be given fresh finance by the concerned society at its own discretion out of its own funds by re- scheduling the old default for a period upto 5 years, provided this facility is treated as a one-shot operation. Such category of defaulters are also eligible for fresh investment credit (long-term loan) if the amount of default together with the fresh long-term credit are well within their assessed repaying capacity. 4.33 As regards financing of rural artisans and village craftsmen, the RBI recognised, as far back as in 1968, the industrial co-operatives formed by such categories engaged in 22 broad groups of cottage and small-scale industries as eligible for its concessionary refinance assis- tance for working capital purposes. As the progress in the formation of industrial co-operatives was not encouraging, the NGA suggested that credit requirements of rural artisans, and craftsmen should be met by Farmers Service Societies (FSS) envisaged by it. In August 1977, the Reserve Bank extended its refinance facilities through PACS to individual artisans and craftsmen who, being scattered, are not able to form their own co-operatives. Recently, some of the State Co-operative Banks (SCBs) have initiated steps to provide credit facilities to the artisans through PACS. For instance, the Haryana and Orissa SCBs had secured credit limits amounting to Rs. 23.27 lakhs and Rs. 31.91 lakhs from the RBI for this purpose in 1979-80. 4.34 As regards term credit, since there is a legal constraint on the RBI in providing refinance to CCBs for this purpose, it advised them in February 1980 that they could provide, from out of their own resources, loans for periods not exceeding 10 years to PACS for meet- ing such credit needs of rural artisans provided that the aggregate of such credit does not go beyond 15 per cent of their long-term dis- posable resources or 5 per cent of their total deposits whichever is more. We have been informed that the IDBI is exploring the possi- bility of extending its refinance assistance to selected CCBs for meeting the term credit needs of this sector. Meanwhile, governmental agencies such as Khadi and Village Industries Boards meet to some extent the term credit needs of rural artisans.
  • 20. 55 Recovery of Loans 4.35 Over the period 1970-71 to 1978-79, the recovery performance of PACS showed a deteriorating trend. As on 30 June 1978, there were 12 million defaulting members accounting for 53 per cent of the indebted membership. The overdues increased from Rs. 322.40 crores in 1970-71 to Rs. 809.62 crores in 1977-78 (Statement 4.9), constituting 43.3 per cent and 45 per cent of the demand and out- standing loans, respectively, at end June 1978. The overdues further rose to Rs. 908 crores at end June 1979, forming 45.2 per cent of the total loans outstanding. 4.36 Overdues under short-term loans increased from Rs. 283 crores on 30 June 1971 to Rs. 660 crores at end June 1978 and further to Rs. 733 crores on 30 June 1979. Of the total overdues of Rs. 809.62 crores at end June 1978, those for over 3 years amounted to Rs. 170 crores or 21 per cent of the total. State-wise, recoveries during 1977-78 in relation to the demand for the year were below the all-India average in Assam, Bihar, Himachal Pradesh, Jammu & Kashmir, Karnataka, Madhya Pradesh, Maharashtra, Manipur, Meghalaya, Tripura, Orissa and West Bengal. In a few states, viz-^ Haryana and Kerala, the recovery efforts had shown signs of improvement. It will be seen from Statement 4.5 that as on 30 June 1979, the position of overdues was particularly disquieting in Bihar, Karnataka, Maharashtra, Madhya Pradesh, West Bengal and Tamil Nadu. The prevalence of large-scale overdues constitute a major obstacle to uninterrupted flow of co-operative credit to the needy rural households. 4.37 The RBI's Study Team on Overdues of Go-operative Credit Institutions (1974) had come to the conclusion that defaults were, by and large, wilful and that lack of will and discipline among cultivators to repay and the unhelpful attitude of state governments in creating a favourable climate for recovery were the primary factors responsible for the prevalence of overdues. It had further observed that there was no positive relationship between the level of overdues and the extent and frequency of natural calamities. It, therefore, recommen- ded that state governments should not condone wilful non-repayment and that coercive steps should be instituted for recovery of overdues. Some of its major recommendations were : automatic supersession of managing committees/Boards of Directors if and when the overdues exceeded a specified level, denial of fresh credit and voting rights to defaulters and their sureties, amendments to the Go-operative Societies Acts empowering the Registrar of Go-operative Societies to issue
  • 21. 56 orders suo moto for recovery of co-operative dues as arrears of land revenue and strengthening of the government machinery concerned with the recovery of dues. Yet another important recommendation was in regard to grant of relief to small farmer-defaulters (whose gross agricultural income did not exceed Rs. 5,000 per annum) affected by successive or frequent natural calamities. The various types of relief suggested by it in this regard were : (?) For two successive failures of crops, the aggregate of two short- term conversion loans should be rescheduled as a five year loan; {ii) For three successive failures, write off of the short-term (conversion) loan and the interest thereon and spreading over of the other loans as a rescheduled loan for five years; {Hi) If, in addition to the short-term loans, the borrower has to repay a normal medium-term loan, the repayment period of the rescheduled loan might be spread over six years in the case of one crop failure; for two successive failures, one short- term (conversion) loan and interest thereon might be written off, spreading over of the remaining loans as a rescheduled loan for seven years; for three successive failureSj, two short- term (conversion) loans might be written off spreading over of the remaining loans as a rescheduled loan for seven years. The Study Team had also recommended that all non-wilful small defaulters with cultivated holdings in villages affected by natural calamities in one or more years during the period 1970-71 to 1972-73 should be rehabilitated by converting their short-term loan overdues into medium-term or even long-term (7 years) loans and that state governments might extend financial assistance to CGBs for enabUng the latter to grant such rehabilitation loans to the primaries. These recommendations have, by and large, remained unimplemented in most of the states. On the other hand, some of the state governments viz-i Andhra Pradesh, Karnataka, Maharashtra, Madhya Pradesh, Rajasthan and Tamil Nadu have issued, from time to time, blanket stay orders on or banned coercive action for recovery of co-operative dues. 4.38 According to the RBFs study reports and our own observations in the field, the principal reasons for overdues are : {}) failure to tie-up lending with development programmes, Overdues*"^ (^0 defective loaning policies, including untimely loan disbursements, under-financing/over-financing and unrealistic scheduling of loan repayment, [Hi) neglect of/or
  • 22. 57 absence of efforts for marketing arrangements and linkage of credit recovery with sale of produce, (iv) ineffective supervision, (v) mis- application of loans, [vi) apathy and indifference of management of societies to taking coercive measures for recovery and (vii) foremost of all, want of a sense of discipline and resj>onsibility among the loanees in regard to prompt repayment of debts. While unforseeen natural calamities such as drought, floods, etc., have contributed in some measure to non-payment of dues, steps taken by state governments in the name of these calamities have adversely affected the climate for recovery and accelerated the accumulation of overdues. Credit Stabilisation Arrangements 4.39 It should be ovserved that the rise in overdues has been quite steep despite large conversion facilities channelised through the co- operative credit system. Conversion facilities were resorted to fre- quently and on a large scale in recent years as may be seen from the details given below : Year (July-June) Drawals from the National Agricailtural Credit (Stabilisation) Fund 1970-71 1971-72 1972-73 1973-74 1974-75 1975-76 1976-77 1977-78 1978-79 1979-80 (Rs. Crores) 14 24 68 41 55 41 78 103 32 88 Source : Report on Currency and Finance, RBI. At the level of PACS, the amount of medium-term conversion loans outstanding against members was as high as Rs. 200 crores at end-June 1978. Of this, as much as Rs. 184 crores or 92 per cent were accounted for by six states viz., Andhra Pradesh (Rs. 25 crores), Gujarat (Rs. 60 crores), Karnataka (Rs. 16 crores), Madhya Pradesh (Rs. 10 crores), Maharashtra (Rs. 28 crores) and Tamil Nadu (Rs. 45 crores). The studies conducted from time to time by the Reserve Bank into the actual utilisasion of conversion facilities have, inter alia, revealed that conversions were allowed uniformly to all the borrowers in the affected areas irrespective of their need therefor and that, v6ry often, even
  • 23. 58 overdues of short-term loans relating to crops not damaged by natural calamity were also converted. 4.40 In Gujarat, Maharashtra and Tamil Nadu which accounted for over 85 per cent of the total drawals from the National Agricultural Credit (Stabilisation) Fund during the three years ended 1975-76, own^wan was found to have been declared not crop-wise, but on the basis of average yield of all the crops taken together. Under this system, the yield of one or two principal crops tilts the aggregate annewari of ajl the crops* In Maharashtra, for example, the normal yield is arrived at by averaging the yield over a period of 10 years and this is valued at 9 annas instead of 12 annas as envisaged under the stabilisation arrangements. It was found that the figures of annewari did not bear any logical relation to those of foodgrain production for the State as could be seen from the following table : Total No. of villages No. of villages having annewari below 6 annas Foodgraini (In lakh > production tonnes) Year Total No. of villages No. of villages having annewari below 6 annas Ten year moving average of production Actual estimat- ed production (1) (2) (3) (4) (5) 1973-74 1974-75 1975-76 1976-77 38,832 38,839 38,870 38,870 10,672 5,972 17,483 9,834 57-67 58-82 63-25 67-00 70-45 79-00 91-19 96-98 Source: Report of the Crpp Loan Evaluation Committee of the Gk>vernment of Maha- rashtra, 1978. In Tamil Nadu, dual standards were adopted for declaration of annewari—-QBG for obtaining stabilisation assistance from the RBI and another for grant of relief by the State Government itself, by way of suspension or remission of land revenue. 4.41 The Study Team on Overdues had recommended that certi- fication oi annewari by the District Collector should be considered ade- quate for the use of stablisation arrangements, provided the annewari was determined on a scientific basis, by undertaking crop cutting experiments in plots selected on a random sampling basis, preferably by the Statistics Department of the state government. While the Reserve Bank has accepted the certification o{annewari by the Collector, state governments have not taken action to introduce scientific methods for determination of annewari.
  • 24. 59 4.42 Quite a large number of PACS continue to remain only as credit-disbursing agencies without providing complementary services to members. The number of societies distributing Functi'ons* farm inputs was less than 10 per cent of the total number of societies in Andhra Pradesh, Assam and Bihar. The aggregate value of farm requisites supplied by 43,605 societies (38 per cent of the total) in 1977-78 was about Rs. 488 crores, of which the major component was fertilisers worth Rs. 425 crores. About a third of the societies (37,704) sold essential consumer articles like foodgrains, kerosene, sugar, etc., of the value of about Rs. 278 crores, during 1977-78. In 1977-78, 18,449 societies (16 per cent of the total) spread over 12 states, recovered from 2.7 million borrowers, a sum of Rs. 127 crores from out of the sale proceeds of produce. This was roughly 12 per cent of the total recoveries effected during this year. A much smaller number of societies (1j309) undertook sale of members' produce during 1977-78. 39 societies in Andhra Pradesh, Bihar, Gujarat, Kerala, Maharashtra and West Bengal had made a beginn- ing with processing activities. Farmers Service Societies [FSS) 4 A3 The Farmers Service Society was conceived by the NGA in 1971 with the following basic objectives : (f) To provide all types of credit and a full package of services and technical guidance to farmers, particularly small farmers, for enhancing production, and for diversification of activities on the farm in an integrated manner and at one contact point; {ii) To cover effectively a large area of operation, say a block or population of 10,000, so that it can maintain technical experts and well-trained managerial staff and simultaneously function as a viable unit; and (iii) To enable the weaker sections to control the society while servicing all categories of farmers, for which purpose, its constitution should provide for a two-third representation to such class of people on its elected board of management. Such type of societies could be sponsored by and affiliated to commercial banks or could form part of the co-operative credit system. It was envisaged that there would be two types, viz., (a) at block level—with jurisdiction over the entire block and with 20 branches
  • 25. 60 (miiiimum) and loan business of Rs. 1 crore within a period of five years and (b) a smaller model covering a gross cropped area of 10,000 hectares to command a loan business of Rs. 10 lakhs within 5 years. Except in Bihar, Jammu & Kashmir, Goa, Manipur, Nagaland, Tripura and the tribal area of Gujarat, the FSS registered are generally of the smaller type. 4.44 Starting with 30 FSS in 1973-74 in SFDA areas, the number of FSS in the country increased to 1,577 (inclusive of 665 gtam-panchayat societies in Assam and 113 Sericulturists-cum-Farmers Service Societies in Karhataka) by the end ofJune 1978j as against 2,520 envisa;ged by the NCA to be set up over a period of 6 years. Assam had the largest number of FSS (665) followed by Uttar Pradesh (381), Karnataka (215), Madhya Pradesh (92) and Pondicherry (62). Haryana, Jammu and Kashmir, Nagaland, Orissa, Rajasthan, Maharashtra and Tamil Nadu had only a few FSS. No FSS had been organised in Arunachal Pradesh, Meghalaya and Mizoram in the North-east region and in Punjab and Himachal Pradesh in the northern region. The ^ogress made by FSS in 1977-78 can be seen from the following data : All FSS Averrge per FSS (Rs. crores) (Rs. lakhs) 1. Niimbcr of Societies (including Sericulturists- cum-FSS) 2. Membership ('000) 3. Borrowing membership (*000) 4. Paid-up capital (Rs.) .. 5. Deposits (.. ) 6. Other borrowings (>, ) 7. Loans issued (>> ^ 8. Loans Oustanding (,> ) 9. Overducs (,, ) Source: Statistical Statements Relating to the Co-operative Movement in India. Sixty per cent of FSS membership comprised of small farmers with holdings upto 2 hectares. Effective coverage in terms of borrow- ing members was only 19 per cent in 1977-78. In the outstanding advances at Rs. 69.03 crores, medium-term loans at Rs. 14.70 crores worked out to 21.3 per cent. Recovery performance did not materially differ from that of the PACS inasmuch as the percentage of overdues to outstanding loans on 30 June 1978 was about 38. The value of farm requisites distributed by the FSS during 1977-78 was Rs. 30.88 crores and the marketing operations undertaken were of the order of Rs. 4.44 crores. Nearly 34 per cent of the FSS (533 societies) had in- curred losses in 1977-78. 1,577 3.276 2-10 611 0-40 17-30 1-10 6-86 0-40 59-34 3-76 55-91 3-55 69-03 4-38 26-19 1-66
  • 26. 61 4.45 A study of the working of 788 FSS, which were in business for more than one year as on 1 January 1979, (excluding the gram-pan,' chayat societies in Assam and the sericulturists-cum-FSS in Karnataka) undertaken by the RBI in January-March 1980, revealed the follow- ing position : {i) A number of PACS co-existed in the jurisdiction of FSS in Gujarat, Bihar, Maharashtra and Andhra Pradesh and they con- tinued to disburse credit resulting in overlap of jurisdiction. [ii) Large cultivators continued to wield influence over FSS management. In Jammu and Kashmir and Uttar Pradesh, the bylaws of FSS provided for only 50 per cent representation to weaker sections on the managing committee as against two-thirds representation envisaged in the model bylaws. (m) The nominees ofstate governments and sponsor banks hardly evinced adequate interest in the working of FSS. {iv) The Managing Directors of a number of FSS, sponsored by co-operative banks, were not well quaUfied and experienced to handle efficiently the complex functions of these societies. In Andhra Pradesh, Goa and Tamil Nadu the Managing Directors of FSS, being employees of the state government/financing bank, on deputation, were frequently transferred, depriving the societies of continuity of their service. {v) Some of the FSS in Gujarat, Maharashtra, Orissa and Rajas- than functioned without technical staff. In Andhra Pradesh and Karnataka the technical personnel deputed by the State Governmen- were withdrawn after sometime. {vi) Only 39 out of 531 FSS, for which data were received, achie- ved a loan business of more than Rs. 10 lakhs each by 1978-79. Long- term credit disbursal was still negligible, being limited to a small number of 19 FSS. {mi) In Gujarat, Jammu and Kashmir, Madhya Pradesh and Tamil Nadu, the share of weaker sections in short-term loans advanced by FSS was relatively small, as indicated below : (Rs. lakhs) State Total loans disbursed in 1978-79 Of which to weaker sections Percentage of (3) to (2) (1) (2) (3) (4) Gujarat Jammu & Kashmir Madhya Pradeidi .. Tami) Nadu 87-53 19-59 72-58 153-83 29-56 5-44 6-32 41-72 34 28 9 27
  • 27. 62 (viii) Except in Gujarat and Kerala, where the overdues in FSS ranged between 20 and 40 per cent and 20 to 30 per cent of demand respectively, the level of overdues in other states was quite high, at about 50 to 60 per cent of demand as on 30 June 1979. {ix) The limited range of non-credit functions related to supply of farm inputs as also distribution of consumer goods. {x) Marketing of farm produce was not arranged by many of the FSS except a few in Andhra Pradesh and Kerala. Some FSS in Maharashtra, Karnataka and Andhra Pradesh, however, collected milk produced by their loanees and supplied it to government dairies. (xi) Only in Kerala, FSS had sizeable deposits; 10 out of 13 FSS studied had deposits of more than Rs. 10 lakhs each. In Tamil Nadu, 10 FSS had deposits of more than Rs. 3 lakhs each. A number of FSS in Andhra Pradeshj Orissa and Maharashtra held no deposits. In Haryana, the average deposit per FSS ranged around Rs. 0.60 lakh, while in Rajasthan, it was about Rs. 10,000. 4.46 The above findings point to the lack of enthusiasm on the part of state governments and sponsor banks in giving the scheme of FSS a fair trial. The commercial banks which sponsored them hardly made use of them for deposit mop-up and lendings under the Differen- tial Rates of Interest (DRI) Scheme; instead, they preferred to operate through their own branches. It was observed during our field visits that, more often than not, the operations of these societies failed to take oif for want of a minimum infrastructure and a higher degree of mana- gerial skill and competence. Illustratively, we cite the case of a FSS in West Bengal, sponsored by one of the nationalised banks. This society which started functioning from May 1975 had issued loans to the tune of Rs. 14 lakhs over a period of 4 years, undertaken input supplies and provided storage facilities to members. But, beyond these, it colild not perform well owing to {a) absence of a compact and contiguous area coverage, {b) non-availability of technical staff from government for animal husbandry activities, (c) non-supply by the Marketing Federation of hybrid seeds, {d) inadequacy of margin in fertiliser supplies which landed the society in loss and {e) delay in ground water survey to assess the potential for term lending for minor irrigation programmes. On the other hand, the example of FSS (including sericulturists-cum-FSS) in Karnataka amply demonstrates that^ given proper assistance and infrastructural facilities, these socie- ties can certainly render a good account of themselves. The average lendings of FSS in this State worked out to Rs, 8.5 lakhs per society in 1978-79, although the advances of some of the societies in Bangalore
  • 28. 63 district had touched the level of Rs. 30 to 40 lakhs. The sericulturists- cum-FSS in this state had formulated 88 schematic lending pro- jects, of which 42 had been cleared by the ARDC for its refinance assistance. Of the 113 societies, 82 had lent nearly Rs. 8 crores during 1978-79; of this, the amount advanced for sericultural programme alone was of the order of Rs. 2.32 crores. The societies, however, reportedly faced stiff competition from their own sponsoring commer- cial banks in increasing their loaning, because, the latter were directly lending to individuals in their area of operations. All aspects consi- dered, it is too premature to hazard any judgement on the performance of FSS; but, one thing is clear, that, although, they are structurally sound, they have not been given the requisite aid and opportunities to work on the lines desired. Large-sized Adivasi Multi-Purpose Co-operative Societies {LAMPS) 4.47 In pursuance of the recommendations of the Study (Bawa) Team appointed by the Glovernment of India in December 1971, LAMPS were organised in tribal areas with the objects of (?) providing under a single roof, all types of credit including those for meeting social obligations and consumer requisites, {ii) technical guidance in the intensification and modernization of agriculture, and {Hi) arranging for the marketing of agricultural and minor forest produce besides the products of other subsidiary occupations of the tribals. Like the FSS, these societies were expected to cover larger areas of operation than the PAGS. At the end ofJune 1978, there were 1,424 LAMPS, largely concentrated in the tribal areas of Madhya Pradesh, Maharashtra and Orissa. The progress of these societies in 1977-78 is indicated as under: All LAMPS Average per (Rs Crores) LAMP (Rs. lakhs) 1. Number of LAMPS 14.24 2. Membership ('000) .. 15.42 M 3. Borrowing membership ('000) 3-92 0-3 4. Paid-up share capital (Rs.) 15.68 M 5. Deposits ( ,, ) 2-52 0-2 6. Other borrowings ( ,, ) 42-39 2-9 7. Loans issued ( ,. ) 25-21 1-8 8. Loans outstanding ( ,, ) 43-66 3-1 9. Overdues ( >. ) 23-23 1-6 Source: Statistical Statements Relating to the Co-operative Movement in India.
  • 29. 64 4.48 Of their total membership at 15.42 lakhs, 56.9 per cent were scheduled tribes and the rest were scheduled castes and others inhabi- ting the tribal areas. Members who borrowed during 1977-78 formed 25.4 per cent of the total membership. The average membership and effective coverage in terms of borrowing membership per society were 1,082 and 275 respectively. The working capital of the societies amounted to Rs. 80.09 crores as on 30June 1978 giving an average of Rs. 5.6 lakhs per society. Loans issued per society were Rs. 1.8 lakhs, preponderantly £is short-term credit while medium-term and long-term loai3B formed only 27 per cent. Recoveries were poor and overdues were mounting up alarmingly. At end June 1978, the quantum of overdues was as high as Rs. 23.23 crores, constituting 53.2 per cent of the outstandings. As many as 519 societies, forming 36.4per cent ofthe total number of societies incurred losses in 1977-78. 4.49 Several problems seem to endanger the financial viability of LAMPS. During our visit to Kunduli and Nandapur LAMPS in Koraput district of Orissa and our subsequent discussions with the concerned authorities ofthe State Government in December 1979, the following problems were raised in regard to the viable functioning of LAMPS: (i) Only 10 out of 56 LAMPS in the district had taken the initiative for collection of forest produce. The other LAMPS in the area acted as agents of the lessee LAMPS. The agency commission paid to them was insufficient to cover storage losses, damages and cost of staff employed for the work. {ii) Transportation charges were not being provided by the Government in respect of consumer goods moved to outstations under the scheme for distribution of controlled commodities. Added to this was the absence of a realistic pricing policy for sale of old stock. (m) The monopoly enjoyed by LAMPS for collection of all minor forest produce was not enforced effectively. The sahukars purchased some trees at low price and smuggled out the produce of other trees as well. The Government was slack in enforcing the monopoly. {iv) The societies had not taken up long-term investment lending aggressively. Financing of programmes of horticulture, sericulture, cashew and coffee plantations, was yet to be actively pursued. The Village Level Workers (VLWs) were not attending to agricultural extension work properly. [v) The LAMPS sustained losses in fertiliser distribution as transport expenses were not reimbursed to them. {vi) There was lack of managerial expertise.
  • 30. 65 (vii) The State Government did not provide adequate margins in distribution arrangements entrusted to them. 4.50 Besides these reasons, due to frequent increases in royalties payable on forest products, unhealthy competition faced from private traders, absence of effective marketing organisation and market intelli- gence service, lack of infrastructural arrangements for storage, trans- portation and processing of forest products, resulting in underselling of the collections of these products from members, insistence on landed security from loanees in areas like Manipur where individual rights in land do not exist etc., many of the LAMPS are finding it difficult to show progress. CREDIT ACTIVITY OF NON-CREDIT SOCIETIES 4.51 Besides PAGS, some of the non-credit co-operatives, such as those undertaking marketing and processing of agricultural commo- dities and functional societies which are activity-specific like dairy co-operatives, poultry farming societies, fisheries' societies, etc., have also assumed the credit-purveying role (Statement 4.10). Loans disbursed by the marketing and processing societies were, by and large, against pledge of agricultural produce and the bulk of such advances was by the societies in Gujarat, Karnataka and Uttar Pradesh. 4.52 The functional societies which symbolise the group approach or market-segment approach, are commodity-specific. Their main aim is to assist their members to improve their bargaining power vis-a-vis the suppliers of inputs and purchasers of their output. Credit is only one of the items in their total operations. The available data on the working of these societies presented in Statement 4.11 reveal that their operations have significantly expanded over the last seven years, viZ'i 1970-71 to 1977-78. Even though the general policy has been to ensure channelling all the credit needs of rural households only through PACS, some of these societies have continued to advance loans to their members. Their trump card Ues in meeting the non-credit services needed by their members without, at the same time, losing sight of their credit needs. CENTRAL CO-OPERATIVE BANKS (CCBS) 4.53 At the middle (district) level of the co-operative credit structure, there were 338* CCBs with 6,835 offices at the end ofJune 1979. The * Excluding data relating to 6 banks in Assam which were under process of amal- gamation and later merged with the Assam Co-operative Apex Bank Ltd.
  • 31. 66 following table shows that, out of 338 GGBs as on 30 June 1978, 74 or 22 per cent had loan business of less than Rs. 2 crores each. Number of banks as on 30 Jiine 1978 Size Deposits Loans and advances outstanding Working capital (1) (2) (3) (4) 1. Below Rs. 50 lakhs 23 1 2. Between Rs, 50 lakbs and Rs, 1 cTQreM .. .. .. 54 16 1 3, Between Rs. 1 crore and Rs. 2 crores .. 88 57 24 4. Between Rs. 2 crores and Rs. 3 crores .. 43 62 46 5. Between Rs. 3 crores and Rs. 4 crores .. 30 37 50 6. Between Rs. 4 crores and Rs, 5 crores .. .. 19 33 25 7. Above Rs. 5 crores .. 81 132 192 AveTage per bank (Rs. crores) .. 4-0 6-15 8-59 Source: Statistical Statements Relating to the Co-operative Movement in India 4.54 Generally, the jurisdiction of a GCB is confined to a district. With a view to improve their contacts with and supervision over PACS and also to mop up the savings of the rural comm- Expansion unity through deposits, the GGBs have been encour- aged to open branches in different parts of the district. As a result, the number of branches increased from 3,434 in 1970-71 to nearly 6j500 in 1978-79. However, from the point of view of intensive supervision over the affiliated units, per-branch coverage of societies was too wide in Assam and Bihar as may be seen from the following data : (As on 30 June 1979) State No. of branches ofCCBs Coverage of societies per branch State No. of branches ofCGBs Crf)verage of societies per branch (1) (2) (3) (1) (2) (3) Andhra Pradesh 292 64 Assam 6 100 Bihar 194 144 Gujarat 699 27 Haryana 160 48 Himachal Pradesh .. 53 42 Jammu and Kashmir 47 54 Karnataka .. 453 27 Kerala .. Madhya Pradesh Maharashtra Orissa Punjab .. Rajasthan Tamil Nadu Uttar Pradesh West Bengal 217 19 662 15 1498 23 118 42 511 32 214 47 356 33 863 19 154 62 Source: Reserve Bank of India.
  • 32. 67 4.55 Over the period 1970-71 to 1977-78, the owned funds of CCBs rose by 2J times from Rs. 199 crores to Rs. 484 crores and further to Rs. 533 crores at end June 1979. The state govern- Owned Funds ments' contribution to the share capital of these banks amounted to Rs. 88 crores or about 30 per cent of the total as on 30* June 1978. Owned funds as a percentage of working capital, however, dropped to 16.4 in 1977-78 from 18.4 in 1970-71. 4.56 The deposits held by CGBs increased from Rs. 438 crores at end June 1971 to Rs. 1,377 crores at end June 1978. The co-operatives accounted for 37 per cent of the deposits as on 30 Deposits June 1978. Nearly 60 per cent of the deposits amount- ing to Rs. 825 crores were accounted by the banks in Maharashtra, Tamil Nadu, Gujarat and Uttar Pradesh. Deposits increased further to Rs. 1,654 crores at end June 1979. In relation to working capital, the growth of deposits was steady from 40.6 per cent in 1970-71 to 46.6 per cent in 1977-78 and to above 50 per cent in 1978-79. The rate of deposit growth was 20.1 per cent (1978-79) which compared favourably with that of scheduled commercial banks at 19.5 per cent. The spurt in deposits was largely due to con- certed and sustained efforts made by CCBs in the wake of the Reserve Bank*s scheme for linking its refinance assistance to the deposit mobili- sation efforts of the banks. An extra ^ per cent interest offered by them (over and above the ceiling rates of interest applicable to com- mercial banks), as allowed by the RBI, also helped. The benefit of insurance cover for depjosits of co-operative banks has been availed of only in 13 states and 3 Union Territories. 4.57 The borrowings of CCBs increased from Rs. 393 crores at the end of June 1971 to Rs. 928 crores at the end of June 1978 and to Rs. 947 crores on 30 June 1979; but as a percentage Borrowings and of working funds, they decreased from 36.4 per cent in 1970-71 to 28.7 in 1978-79. Loans and advances issued by the banks rose substantially from Rs. 894 crores in 1970-71 to Rs. 2,116 crores in 1977-78 and further to Rs. 2,407 crores in 1978-79. Agricultural purposes continued to account for the bulk (73.4 per cent) of their loan business as shown on the next page. 4.58 The studies on utilisation of medium-term loans conducted by the Reserve Bank, in 1979-80, brought to light that the loaning in several cases was not preceded by proper appraisal as to the economic viability of the investment programme, that there was no verification of end-use by the lending agency, that there was no arrangement for
  • 33. 68 LOAN BUSINESS OF GGBS (Rs* crores) Agricultural piuposes Non-agricultural purposes Type of Credit Issued in 1977-78 Outstanding at end June 1978 Issued in 1977-78 Outstanding at end June 1978 (1) (2) (3) (4) (5) Short-term Medium-term .. TOTAL 1,349 204 1,553 1,247 454 1,701 517 (90) 46 (1) 563 335 (4) 414 Figures in bracket indicate advances for industrial purposes. Source: Statistical Statements Relating to the Co-operative Movement in India. post-disbursement follow-up and that the availability of infrastructural facilities like assured supply of quality breeds of livestock, marketing tie-up arrangements etc., was not ensured, as a result of which, the borrowers tended to divert the loans for other purposes and misutilised them. This underlines the need for greater vigilance and supervision on the part of the banks. 4.59 In the matter of industrial financing, the advances of GGBs for working capital purposes of industrial co-operatives increased from Rs. 20 crores in 1970-71 to Rs. 90 crores in 1977-78. Arf "**'^'*' Their lendings for block capital needs were negUgible vances ^^ ^^^^ j^^ ^ ^^ crores in 1977-78 as against Rs. 0.82 crores in 1970-71. This was partly due to the non-availability of long-term refinance assistance from the Reserve Bank which is not legally permitted to provide such assistance to co-operative banks for the purpose of acquiring block assets such as plant and machinery, work sheds etc., by cottage and small-scale industrial co-operatives. However, as stated earlier, GGBs have been permitted to involve their own disposable long-term resources, to a limited extent, in provid- ing block capital loan assistance to industrial societies. The more im- portant reason for the inadequate progress in this regard, is the dormant condition of a large number of industrial co-operatives. Thus, as on 30 June 1978, out of nearly 25,000 primary industrial co-operatives (other than weavers' co-operatives) engaged in the groups of industrial activities approved by the RBI for working capital refinance, as many as 11,452 or nearly 46 per cent were dormant.
  • 34. 69 4.60 The aggregate credit flow to the industrial sector from CGBs during 1977-78 formed only 4,3 per cent of their total advances in the year; bulk of these loans was to co-operative spinning mills and hand- loom weavers' co-operatives. Financial assistance to the handloom sector was of two kinds, viz. (i) to the apex/regional weavers' societies for trading in yarn and marketing of finished cloth and (w) to primary weavers societies for their production and marketing activities. There had been a significant rise in the magnitude of credit availed for these purposes from the RBI as will be observed from the data given below : April-March Drawals by SGBs OP the RBI's credit limits for financing apex/primary weavers societies (Rs. crores) 1975-76 34 1976-77 36 1977-78 168 1978-79 127 Of the drawals in 1978-79, about Rs. 100 crores were for lending to the weavers' societies in Tamil Nadu and about Rs. 18 crores in Andhra Pradesh. As a measure to reduce the cost ofthis credit which is intended to benefit one of the weakest sections of the community, the rate of interest on refinance assistance provided by the Reserve Bank for the purpose has been lowered to 2^ per cent below the Bank Rate from 1 March 1978. Advances to industrial co-operatives other than handloom societies are yet to look up, mainly because a large number of such units in the country continue to be dormant, despite the Reserve Bank's advice to the state governments, as far back as October 1968, to conduct surveys for identifying the viable and potentially viable industrial societies for stepping up credit assistance to them from the co-operative financing system. The need for reorganization of industrial societies on viable basis had again been brought home to the state governments in the Reserve Bank's circular dated 17 May 1979, issued in the context of the recommendations made by the Working Group on Small Scale Industries with special reference to District Industries Centres. 4.61 Overdues at the level of CCBs rose to 38 per cent of the demand as on 30 June 1978 from 34.5 per cent on 30 June 1971. Statewise, the overdues of CCBs in Assam and Bihar amounted Loan Recoveries to more than 70 per cent of the demand for 1977-78 and between 40 and 55 per cent in the case of CGBs in Andhra Pradesh, Gujarat, Himachal Pradesh, Jammu & Kashmir,
  • 35. 70 Madhya Pradeshj, Maharashtra and Rajasthan. As on 30 June 1979, Mdbarashtra, Tamil Nadu, Uttar Pradesh and Gujarat together accounted for 51.1 per cent of the total overdues in the country at GCB level. The classification of 313 CCBs (for which data on overdues as on 30 June 1979 are available) was as under : Percentage of Overdues No, of CCBs to Demand Upto 20 . . . . 44 Betweeu 20 and 40 113 „ 40and60 .. . . . . 107 Above 60 49 313 Source: Reserve Bank of India. Thus, 49 CCBs had overdues exceeding 60 per cent of demand and hence were primafacie ineligible for credit limits from the Reserve Bank of India. 4.62 Against the background of the rising overdues and the conse- quent deterioration in the financial position of many CCBs, a pro- gramme of rehabilitation was introduced in 1971, in respect of CCBs whose bad and doubtful debts, accumulated losses and overdues over 3 years exceeded 50 per cent of their owned funds. Initially, accord- ing to the criteria, 64 CCBs in 12 states were brought under the pro- gramme of rehabilitation on the basis of their financial position as on 30 June 1970. The number of such banks increased to 180 as on 30 June 1977. The programme envisaged investigation of overdues with a view to identifying irrecoverable debts and ascertaining the reasons for overdues, augmenting the bad debts reserve of the concerned banks to cover the bad debts, coercive steps for recovery of chronic overdues, rationalisation of loan policies and procedures of CCBs, strengthening of the supervision machinery, mobilisation of resources, toning up the management of the banks^ training and professionalization of staff etc. 4.63 As paucity of resources with some CCBs constituted the main obstacle in writing off their irrecoverable dues and accumulated losses and improving their financial position, the GOI introduced in January 1972, a Central Sector Plan Scheme under which Central/State Govern- ments provided grants-in-aid to 'weak' CCBs for the purpose with reference to their financial position as on 30 June 1971. Upto 30
  • 36. 71 June 1979, under this scheme, the GOI released assistance of Rs. 781.42 lakhs in respect of 146 CGBs in 15 states and Rs. 14.71 lakhs in respect of 3 SGBs in the areas served by the two-tier credit structure. As a result of the above assistance provided under the scheme, a substantial number of the banks have improved their financial position. The Central Sector Plan Scheme has been discontinued by the GOI with effect from April 1980. 4.64 The RBI had been reviewing from time to time the criteria for considering a CCB as weak so that the banks which have improved their position could be excluded from the rehabilitation programme. Accordingly, in November 1979, the RBI laid down revised normis, for deletion of a CCB from the list of 'weak' banks, viz., (i) The bank's financial position is such that its estimated bad and doubtful debts, accumulated losses and other overdues over 3 years no longer exceeded 50 per cent of its own funds. ( a) The bank has shown an average annual growth rate of 10 per cent in respect of deposits and loans outstanding during the preceding 3 years. 4.65 On the basis of the above revised norms, 106 CCBs were retained in the list of 'weak' CCBs with reference to their financial position as on 30 June 1978 for the purpose of rehabilitation pro- gramme. 4.66 The implementation of the rehabilitation programme has not been uniformly satisfactory in all the states, as evidenced by the deter- ioration in recovery performance referred to earlier. According to a review, made by the Reserve Bank, of the progress of rehabilitation programme as on 30 June 1979, many of the banks have not drawn up the annual plans covering all aspects of the rehabilitation programme. Certain SCBs have yet to create rehabilitation cells as recommended. Similarly, in some states, the State and District Level Committees have not been constituted to monitor the programme of rehabilitation, while in many states, the committees have not been meeting as fre- quently as required. Investigation of overdues on a scientific basis at the level of PACS had not been completed by the banks in many states viZ'i Andhra Pradesh, Assam, Bihar, Orissa, Punjab and Uttar Pradesh. As a result, the amount released by the Government of India under the Central Sector Plan Scheme has not been fully uti- lised by the banks. Had the assistance been fully utilised, the finan- cial position of these banks would have improved. Further, it has
  • 37. 72 been observed that the assei^ment and write off of irrecoverable over- dues has not been done in accordance with the instructions of the GOI, for example, by some of the CCBs in Karnataka. Also as on 30 June 1979, sizeable amounts have been reported to be involved in arbitra- tion cases and execution petitions in certain states, viz-, Andhra Pra- desh and Jammu & Kashmir. The slow pace of disposal of arbitra- tion cases and execution of awards clearly indicates the lack of serious- ness on the part of the agencies implementing the programme of re- habilitation. Again, certain measures essential to complement the rehabilitation programme such as revitalization of PACS, selection of^ertain good working societies for intensive development, strengthen- ing and improving the arrangements for supervision over field staff, mobilization of resources etc., have not been taken up with the de- sired degree of earnestness. STATE CO-OPERATIVE BANKS (SCBS) 4.67 At the apex level of the state co-operative credit structure are 26 State Co-operative Banks* with 360 offices (as on 30 June 1979). Over the years, their overall financial position has Resources shown considerable improvement with an expanded resource base. Between 1970-71 and 1977-78, their owned funds increased from Rs. 93 crores to Rs. 214 crores. At end-78 June 1979, their owned funds at Rs. 239 crores formed about 12 per cent of their total working capital. Their deposits also recorded a fast growth from Rs. 279 crores in 1970-71 to Rs. 1,004 crores in 1977-78 and further to Rs. 1,206 crores in 1978-79. Nearly 56 per cent of the deposits as on 30 June 1979 were held by four SCBs viz., Mahara- shtra (27 per cent), Gujarat, Uttar Pradesh (10 per cent each) and Tamil Nadu (9 per cent). The bulk of the deposits (79 per cent of the total deposits as on 30 June 1978) had accrued from within the co-operative sector representing the investment by the central co- operative banks of their statutory reserve fund, agricultural credit stabilisation fund, bad debts reserve, gratuity and provident fund of employees, etc., and deposits eligible to be reckoned towards their statutorily stipulated liquid assets besides the deposits kept by primary co-oi>erative banks and non-credit co-operatives like co-operative marketing societies, co-operative spinning mills, co-operative sugar factories, etc. This was in tune with the state policy to ensure that the investible funds of the various types of co-operative organizations should, as far as possible, be conserved for deployment within the * Excludes Arunachal Pradesh State Co-operative Bank.
  • 38. 73 co-operative system itself. Deposits gathered by SCBs from outside the co-operative system, mz^j individuals and institutions, con- stituted 21 per cent of the total deposits at end June 1978. Owned funds and deposits together amounted to Rs. 1,445 crores at end June 1979 constituting 72.3 per cent of the working capital of SCBs at Rs. 2,000 crores. 4.68 As on 30 June 1979, the borrowings of SCBs at Rs. 454 crores accounted for 22.7 per cent of their working capital, indicating a decrease of over 20 per cent from the 1970-71 position. Adva^nTe?^ ^"*' Their outstanding habiUties to the RBI stood at Rs. 360 crores which, as a proportion to their working capital, formed only 18 per cent as against 35.3 per cent in 1970-71„ It may be noted in this context that although the Reserve Bank has the capacity and the intention to expand rural credit through the co-operative organizations by providing funds at low interest rates, subject to the discipline stipulated by it, the co-operative credit system is unable to absorb an increasing quantum of such resources year after year, owing to its inability to comply with the discipline required of it. This is evident from the fact that, while the short-term agricultural credit limits of the Reserve Bank had increased from Rs. 390 crores in 1970-71 to Rs. 748 crores in 1977-78, and further to Rs. 799 crores in 1978-79, the percentage of utilisation of the limits had declined from 74 to 59 over the same period. In the case of medium-term credit limits for agricultural purposes, the utilisation of the limits averaged around 56 per cent during the last six years ended December 1978. 4.69 Between 1970-71 and 1978-79, there was nearly a threefold increase in the lending operations of SCBs, the quantum of loans issued having gone upto Rs. 2,237 crores in 1978-79 from Rs. 749 crores in 1970-71. The loans outstanding stood at Rs. 1,396 crores as on 30 June 1979 as against Rs. 534 crores at the end of 1970-71. In deploy- ment of resources, agriculture received the lion's share, the short-term credit for production constituting about 88 per cent of the total agri- cultural loans. Non-agricultural advances have also increased from 20 per cent of the total loans issued in 1970-71 to 33 per cent in 1977- 78 as may be seen from the following table. Non-agricultural ad- vances were, in the main, meant for financing consumption purposes and working capital requirements of handloom production-cum- marketing co-operatives, co-operative spinning mills, co-operative sugar factories, monopoly cotton procurement, distribution of consu- mer goods through co-operatives, etc. As a result of deliberate pohcy pursued by the Reserve Bank, the SCBs have been enabled to invest
  • 39. 74 thtk own r^ources increasingly in non-agricultural sector which ppo- vidcs a higher interest margin, with a view t^- off-setting the losses incurred by them in agricultural lending at the pooled rate of in- terest. LOAN Bt^mEss OF SCBS (Rs. crores) 1970-71 1977-78 Purpose Z^aus issued during the year Outstanding at.the.end . of theye^ = Loans issued Outstanding during the year at the end pf the year ST. M.T. S.T. M.T. S.T. M.T. S.T. M.T. (1) (2) (3) (4) (5) (6) (7) (8) (9) Agricultural 574 31 349 66 1,185 168 745 236 Non-agricultural 129 15 9Q 29 636 33 280 77 TOTAL 703 46 439 95 1,821 201 1,025 313 Source: Statistical Statements relating to the Co-operative Movement in India. INDUSTRIAL CO-OPERATIVE BANKS 4.70 Besides SCBs and CCBs, some Industrial Co-operative Banks have been functioning in a few states. They cater to the credit needs of village/cottage industrial co-operatives (other than co-operative sugar mills and spinning mills) and in exceptional cases, of individual craftsmen and self-employed technocrats. In Rajasthan and Tamil- Nadu, an apex level Industrial Co-operative Bank with state-wide jurisdiction exists, while in Gujarat, Maharashtra and Karnataka, a few district-level bajiks are working in some of the districts. The position of these banks is indicated in Statement 4.12. 4.71 We have noted earlier that the RBI has, as a rule, preferred to route its financial accommodation for cottage and village industries, through the regular co-operative credit system, i. e., SCBs and CCBs and hence, it has been advocating either the conversion of the exist- ing industrial co-operative banks into urban co-operative banks with their clientele limited to urban industrial co-operatives, bringing the rest of their constituents within the CCB's financing orbit or their total merger with the CCB itself. There is, however, resistance to this idea from the Industrial Co-operative Banks and also from some of the concerned state governments. Those who advocate the continuance of these special banks argue that the established co-operative financing
  • 40. 75 system which is traditionally oriented to agriculture may adopt apa- thetic and unenlightened attitudes towards the credit needs of indus- trial co-operatives. One of the reasons cited in support of these banks is that the industrial co-operatives are the administrative responsibi- lity of the Industries Department in the state government while SCBs and CCBs fall within the jurisdiction of the Go-operative Department. LONG-TERM CO-OPERATIVE CREDIT 4.72 The long-term co-operative credit structure is federal in some states and unitary in others. Bihar, Gujarat, Jammu and Kashmir, Maharashtra and Uttar Pradesh have unitary structure Structure and where the SLDB concerned finances individuals Progress directly through a network of its branches. In other states except Himachal Pradesh and West Bengal which have a mixed pattern, the structure is federal with PLDBs as affiliates. As at end June 1978, there were 19 SLDBs, operating through 999 branches and 889 PLDBs with about 6 million farmers on their roUs^ covering nearly 11 per cent of the estimated farm households in the country. 4.73 Table below presents a summary of the progress registered by LDBs over the period 1970-71 to 1977-78. (Rs. crores) SLDBs 1970-71 1977-78 ~) ST PLDBs 1970-71 1977-78 (3) (4) 1. Owned Ainds .. 2. Deposits and other borrowings 3. Debentures outstanding 4. Working capital 5. Loans issued .. 6. Loans outstanding 58 213 48 97 24 50 449 719 725 1,690 — — 841 2,082 551 896 168 239 119 160 638 1.305 448 735 Source: Statistical Statements Relating to the Co-operative Movement in India. 4.74 Long-term credit dispensed through PLDBs and branches of SLDBs in 1977-78 to about 5 lakh borrowers were of the order of Rs. 239 crores while the amount outstanding at end June 1978 came to Rs. 1,305 crores. The lending programme of SLDBs in the financial year 1978-79 was fixed at Rs. 419 crores, comprising Rs. 271 crores for the ARDC-aided schemes and Rs. 148 crores under ordinary lending programmes. Against this programme, the actual disbursals at the level of primary units were of the order of Rs. 244.16 crores
  • 41. 76 maddvup of Rs. 147.23 crores under the ARDC schemes and Rs. 96.93 crords under ordinary pro^ammes. 4.75 Statewise disbursement of long-term credit through PLDBs/ branches of SLDBs during the last five financial years (1974-75 to 1978-79) is given in Statement 4.13. It will be seen therefrom that the magnitude of lending is showing a declining trend even in some of the co-operatively well-developed states. 4.76 Purposewise, minor irrigation accounted for 60 per cent of the total lending in 1977-78, followed by farm mechanization and land improvement (Statement 4.14). Loans bene- tion of UJIBS*'*" fiting artisans and landless labourers reported in Andhra Pradesh, Kerala, Haryana and Punjab were negligible. Evidently, the main thrust in the lending activities of LDBs continues to be on financing land-based activities. Even in the states where LDBs arc legally entitled to lend for non-land based purposes, {e. g., Kerala, Kamataka, Haryana, Punjab, West Bengal) financing of such activities which would benefit the rural poof has not been taken up in a big way, due presumably to lack of expertise and technical know-how with the LDBs for such lending. The declining potential for traditional lending avenues such as minor irrigation investments points to the need for the banks to explore non- traditional avenues of lending, both land-based and non-land based, such as sericulture, horticulture, plantations, dairy farming, animal husbandry, social forestry, etc. 4.77 Mention may be made here of the Committee on Land Develop- ment Banks appointed by the RBI under the Chairmanship of Shri K. Madhava Das in 1973. The committee's report, onToBs** published in 1975, made several recommendations pertaining to the organisational, structural and operational aspects of the LDBs. The more important of them were: {i) co-ordination between LDBs and other institutions including the short-term structure and the development departments of the state governments; {ii) concerted action towards improving recovery performance; (m) changes in legal framework to boost the operational efiiciency of LDBs in the eastern and north-eastern states; {iv) diversi- fication of lending operations and linking of lending to specific agri- cultural and other development programmes; and {v) strengthening of managerial and supervisory machinery and building up of technical staff. These recommendations are being pursued by the RBI with state governments. Admittedly, the progress of implementation is rather slow.
  • 42. 77 4.78 The operational efficiency and organisational competence of many of the LDBs leave much to be desired. Bearing testimony to this, is the rising overdues at the primary level which increased from Rs. 149.76 crores at end June Rising Overdues 1977 to Rs. 226.57 crores at end June 1979. Both in absolute quantum and as percentange of demand, the overdues at the level of PLDB/branches of SLDBs have increased in Andhra Pradesh, Assam, Bihar, Gujarat, Jammu & Kashmir, Karnataka, Madhya Pradesh, Tamil Nadu, Uttar Pradesh and West Bengal as will be seen from the data given below: (Amount in Rs. crores) Overdues as on 30 June 1977 1978 1979 (Provisional) State Amount % of Amount % of Amount % of overdue overdues overdue over- overdue overdues to dues to to demand demand demand (1) (2) (3) (4) (5) (6) (7) Andhra Pradesh .. .. .. 5-11 15-1 11-17 28-8 16-50 33-4 Assam .. 0-11 44-6 O i l 40-6 0-21 51-1 Bihar .. 12-66 41-9 18-93 61-0 22-75 59-5 Gujarat .. 29-09 38-1 39-15 68-7 44-76 74-6 Jammu & Kashmir. .. 0-45 47-1 0-51 43-5 0-68 49-4 Karnataka .. .. 15-53 54-6 N.A. N.A. 19-59 47-9 Madhya Pradesh • .. 9-18 50-0 13-22 47-0 18-76 56-6 Tamil Nadu .. 15-05 51-1 32-38 67-1 52-51 80-8 Uttar Pradesh .. 11-27 23-9 15-09 26-6 1911 27-6 West Bengal .. 0-49 17-5 1-14 25-4 2-35 39-1 Source: Reserve Bank of India. Statewise position of PLDBs/branches of SLDBs classified accor- ding to the range of their overdues to demand, as on 30 June of the last four years (1974-75 to 1977-78), is indicated in Statement 4.15. As on 30 June 1979, according to available information, 925 PLDB/ branches of SLDBs had overdues not exceeding 25 per cent of demand for 1978-79, while 360 PLDBs/branches of SLDBs had overdues above 55 per cent. The classification of the units according to the range of their overdues was as under:
  • 43. 78 iUoge of ov^dues to demand No. of Units 25 per cent or less .. .. .. .. .. 925 Between 26 per cent and 35 per cent ., . . . . 167 ,, 36 per cent and 40 per cent . . . . .. 50 ,, 41 per cent and 50 per cent . . . . ., 138 ,, 51 per cent and 55 per cent .. .. .. 97 Above 55 per cent .. .. .. .. .. 360 Source: Reserve Bank of India. 4.79 Several factors haye contributed to the rising trend of overdues. The more important of these are: faulty loan proposals and lending without an integrated programme; laxity in post-credit follow-up and monitoring of end-use; lack of technical guidance to the loanees; natural calamities; and above all, wilful default. The observations we have made earlier regarding the deterioration in recovery cUmate in the short-term credit structure and the unhelpful attitude of some of the state governments also apply generally to the long-term credit structure. Leaving aside such external factors which are outside the control of LDBs, it is necessary to draw attention to one important internal factor within the control of LDBs. During our field visits we have noticed that very little has been done to ensure that the investment credit borrowers reap the full benefit of their investment on completion of the project through the application of the needed production credit. As LDBs did not always furnish a list of their borrowers to PACS in their jurisdiction, long-term loanees were not assured of production credit support as a matter of course. The absence.,of any eiFective operational Hnk between PLDBs/branches of SLDBs and short-term credit wing has given rise to problems of inability of the co-operative credit system to assess the credit-worthiness and credit-servicing capacity of its clientele in a complete manner, taking note of the totaUty of credit support needed by the borrower, and the additional income potential expected to be generated by the investment for servicing the loan. 4.80 As mounting overdues in some states, as stated above, have virtually thrown out of gear the financing operations of LDBs, attempts are being made to rehabilitate such of those PLDBs/branches of SLDBs, the overdues of which exceed 50 per cent of demand and which are either viable or poentially viable. On the basis of the overdues position as on 30 June 1977, as many as 505 out of 1881 PLDBs/ branches of SLDBs, were stated to be under rehabilitation programme.
  • 44. 79 CO-OPERATIVE CREDIT IN THE N E W CONTEXT 4.81 It will be observed from the discussions in earlier paragraphs that the co-operative credit system has, to its credit, several achieve- ments and, at the same time, its working has thrown up certain pro- blems that need immediate attention. No doubt, to build up a democratic countrywide organisation upto the village level for dis- pensing rural credit is no easy task. Over the years, the co-operative movement has evolved different types of co-operative credit insti- tutions which, despite all their faults and shortcomings, have the requisite potential to cater to the diverse credit needs of the rural areas. If suitable changes and improvements are made, they will be able to meet the new challenges underlying the concept of integrated rural development. 4.82 About 57 per cent of the total number of PAGS were not viable as on June 30, 1978. Continued non-viability of a very large number of PACS is attributable to poor membership coverage and still smaller number of borrowing members, lack of supervision over the end use of credit, lack of complementary services, absence of tie-up with develop- ment plans and programmes and consequently the poor recovery performance. In our view, these are the factors which have not only placed serious constraints on the business expansion of PACS but rendered several of them dormant. The large scale efforts made through the reorganisation and revitalisation programmes in most of the states were a step in the right direction. According to available information, the reorganisation process has now been completed in many of the states. While this is an important step towards ensuring viability of the base level organisation, it must be pointed out that viability is not a static concept, and that, as costs go up along with service expansion and diversification, viability standards have to be raised suitably and hence, continuous efforts would be needed to achieve such higher levels of performance. 4.83 The co-operatives, along with other agencies, have to meet the credit needs of various target groups in rural areas. This would, on their part, call for a large-scale coverage of families belonging to poorer groups, both land-based and non-land-based. This, however, raises a host of basic issues which have been very succinctly stated by the Dantwala Committee on RRBs (1977). To quote it: "This phenomenon needs a deeper analysis than it has received so far, especially in the context of our endeavour to ensure uni-
  • 45. to versal membersliip. Who are these non-borrowmg members? Do they belong to a class of farmers (and others) who have no need to borrow because they have enough resources of their own? Or are they ineligible for borrowing because they are not 'creditworthy' ? Or, worse still, are they eligible but are unable to borrow because the management of the societies is averse to accommodating them ? Do the societies suffer from paucity of funds, as a result of which they can accommodate only less than 40 per cent of its members? Whether the structural and operational innovations we have introduced and propose to introduce are meaningful or not for solving the problems of rural credit, will depend on precise answers to these questions." (P. 10) 4.84 The underlying objective of the programme of reorganisation is to ensure that the reorganised societies are developed into viable ones so as to render them an effective vehicle to Viability Aspect purvey multipurpose credit and to carry multi-service to the rural community, paying greater attention to the needs of the poorer sections. But, the programme, so far, has not paid sufficient attention to this essential perspective nor focussed on integrated rural development. The reasons for this need to be analysed and the measures required to carry the reorganisation programme to its logical end, spelt out. 4.85 PACS is commended as an ideal credit institution at the grass- root level for the following reasons: (z) the rural community being involved in the operations of co-operatives, it is in the best position to judge the effectiveness of credit; {ii) deposit mobilisation can be promoted, and {Hi) the cost of service will be minimal compared to other credit delivery systems. All the same, it is to be realised that PACS, as at present situated^ are not competent enough to handle multi-term and multi-purpose credit. It is, therefore, necessary to consider the steps essential for strengthening and activising them so that they can rapidly build up their organisational effectiveness and capacity to meet the needs of accelerated rural development. This would largely depend upon their financial soundness and managerial efficiency. The build-up of internal resources including deposits would pave the way for their successful operations. But, efforts made up till now for mobilising deposits are relatively negligible in all the states except Kerala and Punjab. The problem, therefore, is how to encourage PACS in all the states to develop a strong deposit base.
  • 46. 81 4.86 The need to reorient the functioning of PACS to meet, in full measure, the requirements of the weaker sectionsof the rural community and to build up in them a managerial system which will be responsive to this commitment, cannot be over-emphasised. How this can be ensured and what modifications are called for in their present structure and operations are matters that will have to be examined. 4.87 The policy, currently followed, is to discourage functional societies taking up credit activity primarily on the score that this is the legitimate business of PACS. In view of the need to draw a clear distinction between the financing of an individual for his multifarious pursuits, land-based, or otherwise, and a group of individuals for a common service or activity undertaken by it, the question that arises is, whether, the functional societies should be totally barred from lending to their members. 4.88 At the structural level, the issues that arise in the overall context of the need to cater to the entire gamut of rural productive activities is, whether any particular advantages are derived from a three-tier system of co-operative credit or whether the goals could be better secured through a more compact two-tier structure. Yet another question is whether, for achieving integration of production and investment credit programmes, there is need for a complete structural integration of the short-term and long-term structures of the co- operative credit system or whether functional integration without merging the two can secure the purpose in view. 4.89 One of the most disquieting features of the co-operative system in recent times has been its excessive politicisation. It has become a common feature particularly at the time of elections for the politicians of most hues to indulge in adverse propaganda concerning repayment of co-operative dues. Even more disheartening is the tendency of some of the state governments as stated earlier to stall recovery of co-operative loans by staying the recovery proceedings launched against defaulters. Some of the state governments e.g., Maharashtra and Tamil Nadu have even resorted to exempting the whole classes of defaulters from payment of their dues to PACS and to pay the said amounts to the institutions from the exchequer. 4.90 Another form in which politicisation has manifested itself is the ad hoc supersession of elected board of management of co-operative banks by state governments by exercising the powers conferred on them therefor under the State Co-operative Societies Act, and, the