More Related Content

PDF
Python 機械学習プログラミング データ分析ライブラリー解説編 
PDF

PDF
Introduction to NumPy & SciPy 
PDF
Python for Data Anaysis第2回勉強会4,5章 
PDF
2013.07.15 はじパタlt scikit-learnで始める機械学習 
PDF

PDF

PDF
What's hot

PDF
C++のSTLのコンテナ型を概観する @ Ohotech 特盛 #10(2014.8.30) 
PPTX

PDF

KEY
PyOpenCLによるGPGPU入門 Tokyo.SciPy#4 編 
PDF

PDF
2015年9月18日 (GTC Japan 2015) 深層学習フレームワークChainerの導入と化合物活性予測への応用 
PDF
統計解析言語Rにおける大規模データ管理のためのboost.interprocessの活用 
PDF

PDF

PDF

PDF

PDF

PDF
Introduction to Chainer and CuPy 
PDF

PDF
Intoroduction of Pandas with Python 
PDF

PDF

PDF
STLの型の使い分け(ダイジェスト版) @ Sapporo.cpp 第7回勉強会 (2014.10.18) 
PDF

PDF
Similar to Pythonデータ分析 第3回勉強会資料 8章

PPTX
PythonとRによるデータ分析環境の構築と機械学習によるデータ認識 
PPTX
PythonとRによるデータ分析環境の構築と機械学習によるデータ認識 第3版 
PPTX
東大生向けデータ解析講座 第2回 2017/12/29 
PDF

PDF
Pythonによる機械学習入門〜基礎からDeep Learningまで〜 
PDF
Streamlitを用いた音響信号処理ダッシュボードの開発 
PDF
#経済学のための実践的データ分析 11. データのビジュアライゼーション 
PDF
How to use animation packages in R(Japanese) 
PDF

PDF
ArcGISの便利な印刷周りの機能に、QGIS APIを駆使して挑んでみたお話 
PDF

PDF
PyData入門(超初心者編)~野球のデータをカジュアルに可視化 
PDF
Pythonで動かして学ぶ機械学習入門_予測モデルを作ってみよう 
PDF
Python Data-Visualization Package Status 
PPTX

PPTX
Introduction of network analysis with Google Colaboratory -- Example of Netwo... 
PDF
TokyoR102_BeginnersSession.pdf 
PDF
Html5j data visualization_and_d3 
PPTX

PDF
20141127 py datatokyomeetup2 More from Makoto Kawano

PDF
Road Marking Blur Detection with Drive Recorder 
PDF

PDF
Dl hacks paperreading_20150527 
PDF
Python for Data Analysis第1回勉強会(+git入門) 
PDF

PDF

PDF

PDF
DLhacks paperreading_20150902 
PDF
情報科学若手の会発表資料「Node-REDフローの分散処理化による次世代の都市システム」 Pythonデータ分析 第3回勉強会資料 8章
- 1.
- 2.
- 3.
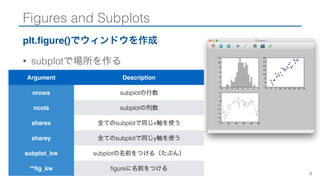
Figures and Subplots
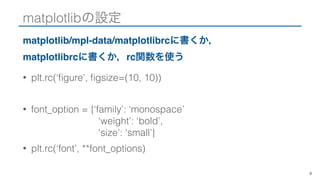
plt.figure()でウィンドウを作成
•subplotで場所を作る
3
Argument Description
nrows subplotの行数
ncols subplotの列数
sharex 全てのsubplotで同じx軸を使う
sharey 全てのsubplotで同じy軸を使う
subplot_kw subplotの名前をつける(たぶん)
**fig_kw figureに名前をつける
- 4.
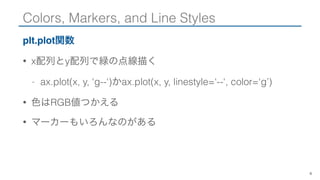
Colors, Markers, andLine Styles
plt.plot関数
• x配列とy配列で緑の点線描く
- ax.plot(x, y, ‘g--‘)かax.plot(x, y, linestyle=‘--‘, color=‘g’)
• 色はRGB値つかえる
• マーカーもいろんなのがある
4
- 5.
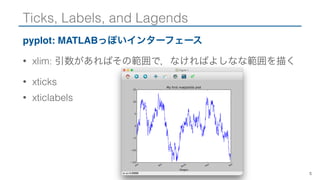
Ticks, Labels, andLagends
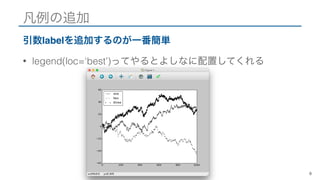
pyplot: MATLABっぽいインターフェース
• xlim: 引数があればその範囲で,なければよしなな範囲を描く
• xticks
• xticlabels
5
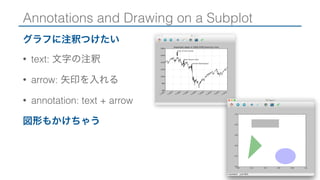
- 6.
- 7.
- 8.
- 9.
- 10.
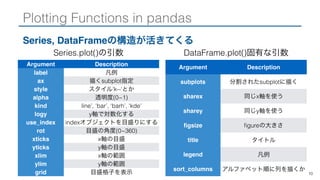
Plotting Functions inpandas
Series, DataFrameの構造が活きてくる
10
Argument Description
label 凡例
ax 描くsubplot指定
style スタイル’k--‘とか
alpha 透明度(0~1)
kind line’, ‘bar’, ‘barh’, ‘kde’
logy y軸で対数化する
use_index indexオブジェクトを目盛りにする
rot 目盛の角度(0~360)
xticks x軸の目盛
yticks y軸の目盛
xlim x軸の範囲
ylim y軸の範囲
grid 目盛格子を表示
Argument Description
subplots 分割されたsubplotに描く
sharex 同じx軸を使う
sharey 同じy軸を使う
figsize figureの大きさ
title タイトル
legend 凡例
sort_columns アルファベット順に列を描くか
Series.plot()の引数 DataFrame.plot()固有な引数
- 11.
- 12.
- 13.
- 14.