Sterling Financial Corporation is a regional bank headquartered in Washington state that was heavily impacted by the financial crisis but has since recovered through restructuring and management changes. The report recommends holding Sterling stock with a price target of $19.46, a 5% increase from the current price. Key points include Sterling's improved financial performance through reducing non-performing loans and assets, its strategy of growing organically and through acquisitions such as a pending purchase of First Independent Bank, and the benefits provided by new leadership and investors from the 2010 recapitalization.
Compared to equities, bonds at first glance can appear like a throwback to your grandparent's days, but this month we take a look at how bonds may help mitigate risk, and the role they play in a well-diversified portfolio.
Compared to equities, bonds at first glance can appear like a throwback to your grandparent's days, but this month we take a look at how bonds may help mitigate risk, and the role they play in a well-diversified portfolio.
Damon Ridley • FSC Securities Corp.
- The efficient frontier fails the test of time by Linda Ferentchak
- Wage growth mixed amid “just right” employment report
- Market high? Pie in the sky by Ian Naismith
- Maintaining a high-profile practice (Marlow Felton, Chris Felton, Transamerica Financial Advisors Inc.)
The less transparent, often misunderstood high yield municipal bond sector offers not only unusually high tax exempt income, but a mostly unrecognized source of long run diversification with the taxable high grade (re what the Fed says and does) bond market.
Neither bulls nor bears in 2011, LPL Financial Research expects the economy and the markets will be range-bound in 2011. Bound by economic and fiscal forces that will restrain and not reverse growth, we believe the markets will provide modest single-digit rates of return.
In 2011, business leaders, policymakers, and investors will play important roles in shaping the investing environment.
FIS Research - High Performance Community BankingPaul McAdam
Historically, economies of scale have provided larger financial institutions with the ability to generate lower efficiency ratios and, often, higher returns on assets than community banks. Despite the disadvantages of their smaller size, some community banks outperform larger banks as well as their community bank peers during both good and bad times. This research brief focuses on the financial metrics of high-performing community banks to determine the characteristics that differentiate the elite performers from the rest of the pack.
Mercer Capital's Atlantic Coast Bank Watch | August 2013Mercer Capital
The August 2013 issue of Bank Watch is available now at www.mercercapital.com, and features articles by Jeff Davis, Madeleine Davis, and the announcement of an upcoming webinar on the recently finalized capital rules.
International Journal of Business and Management Invention (IJBMI)inventionjournals
International Journal of Business and Management Invention (IJBMI) is an international journal intended for professionals and researchers in all fields of Business and Management. IJBMI publishes research articles and reviews within the whole field Business and Management, new teaching methods, assessment, validation and the impact of new technologies and it will continue to provide information on the latest trends and developments in this ever-expanding subject. The publications of papers are selected through double peer reviewed to ensure originality, relevance, and readability. The articles published in our journal can be accessed online.
what is the future of Pi Network currency.DOT TECH
The future of the Pi cryptocurrency is uncertain, and its success will depend on several factors. Pi is a relatively new cryptocurrency that aims to be user-friendly and accessible to a wide audience. Here are a few key considerations for its future:
Message: @Pi_vendor_247 on telegram if u want to sell PI COINS.
1. Mainnet Launch: As of my last knowledge update in January 2022, Pi was still in the testnet phase. Its success will depend on a successful transition to a mainnet, where actual transactions can take place.
2. User Adoption: Pi's success will be closely tied to user adoption. The more users who join the network and actively participate, the stronger the ecosystem can become.
3. Utility and Use Cases: For a cryptocurrency to thrive, it must offer utility and practical use cases. The Pi team has talked about various applications, including peer-to-peer transactions, smart contracts, and more. The development and implementation of these features will be essential.
4. Regulatory Environment: The regulatory environment for cryptocurrencies is evolving globally. How Pi navigates and complies with regulations in various jurisdictions will significantly impact its future.
5. Technology Development: The Pi network must continue to develop and improve its technology, security, and scalability to compete with established cryptocurrencies.
6. Community Engagement: The Pi community plays a critical role in its future. Engaged users can help build trust and grow the network.
7. Monetization and Sustainability: The Pi team's monetization strategy, such as fees, partnerships, or other revenue sources, will affect its long-term sustainability.
It's essential to approach Pi or any new cryptocurrency with caution and conduct due diligence. Cryptocurrency investments involve risks, and potential rewards can be uncertain. The success and future of Pi will depend on the collective efforts of its team, community, and the broader cryptocurrency market dynamics. It's advisable to stay updated on Pi's development and follow any updates from the official Pi Network website or announcements from the team.
Poonawalla Fincorp and IndusInd Bank Introduce New Co-Branded Credit Cardnickysharmasucks
The unveiling of the IndusInd Bank Poonawalla Fincorp eLITE RuPay Platinum Credit Card marks a notable milestone in the Indian financial landscape, showcasing a successful partnership between two leading institutions, Poonawalla Fincorp and IndusInd Bank. This co-branded credit card not only offers users a plethora of benefits but also reflects a commitment to innovation and adaptation. With a focus on providing value-driven and customer-centric solutions, this launch represents more than just a new product—it signifies a step towards redefining the banking experience for millions. Promising convenience, rewards, and a touch of luxury in everyday financial transactions, this collaboration aims to cater to the evolving needs of customers and set new standards in the industry.
What website can I sell pi coins securely.DOT TECH
Currently there are no website or exchange that allow buying or selling of pi coins..
But you can still easily sell pi coins, by reselling it to exchanges/crypto whales interested in holding thousands of pi coins before the mainnet launch.
Who is a pi merchant?
A pi merchant is someone who buys pi coins from miners and resell to these crypto whales and holders of pi..
This is because pi network is not doing any pre-sale. The only way exchanges can get pi is by buying from miners and pi merchants stands in between the miners and the exchanges.
How can I sell my pi coins?
Selling pi coins is really easy, but first you need to migrate to mainnet wallet before you can do that. I will leave the telegram contact of my personal pi merchant to trade with.
Tele-gram.
@Pi_vendor_247
where can I find a legit pi merchant onlineDOT TECH
Yes. This is very easy what you need is a recommendation from someone who has successfully traded pi coins before with a merchant.
Who is a pi merchant?
A pi merchant is someone who buys pi network coins and resell them to Investors looking forward to hold thousands of pi coins before the open mainnet.
I will leave the telegram contact of my personal pi merchant to trade with
@Pi_vendor_247
US Economic Outlook - Being Decided - M Capital Group August 2021.pdfpchutichetpong
The U.S. economy is continuing its impressive recovery from the COVID-19 pandemic and not slowing down despite re-occurring bumps. The U.S. savings rate reached its highest ever recorded level at 34% in April 2020 and Americans seem ready to spend. The sectors that had been hurt the most by the pandemic specifically reduced consumer spending, like retail, leisure, hospitality, and travel, are now experiencing massive growth in revenue and job openings.
Could this growth lead to a “Roaring Twenties”? As quickly as the U.S. economy contracted, experiencing a 9.1% drop in economic output relative to the business cycle in Q2 2020, the largest in recorded history, it has rebounded beyond expectations. This surprising growth seems to be fueled by the U.S. government’s aggressive fiscal and monetary policies, and an increase in consumer spending as mobility restrictions are lifted. Unemployment rates between June 2020 and June 2021 decreased by 5.2%, while the demand for labor is increasing, coupled with increasing wages to incentivize Americans to rejoin the labor force. Schools and businesses are expected to fully reopen soon. In parallel, vaccination rates across the country and the world continue to rise, with full vaccination rates of 50% and 14.8% respectively.
However, it is not completely smooth sailing from here. According to M Capital Group, the main risks that threaten the continued growth of the U.S. economy are inflation, unsettled trade relations, and another wave of Covid-19 mutations that could shut down the world again. Have we learned from the past year of COVID-19 and adapted our economy accordingly?
“In order for the U.S. economy to continue growing, whether there is another wave or not, the U.S. needs to focus on diversifying supply chains, supporting business investment, and maintaining consumer spending,” says Grace Feeley, a research analyst at M Capital Group.
While the economic indicators are positive, the risks are coming closer to manifesting and threatening such growth. The new variants spreading throughout the world, Delta, Lambda, and Gamma, are vaccine-resistant and muddy the predictions made about the economy and health of the country. These variants bring back the feeling of uncertainty that has wreaked havoc not only on the stock market but the mindset of people around the world. MCG provides unique insight on how to mitigate these risks to possibly ensure a bright economic future.
BYD SWOT Analysis and In-Depth Insights 2024.pptxmikemetalprod
Indepth analysis of the BYD 2024
BYD (Build Your Dreams) is a Chinese automaker and battery manufacturer that has snowballed over the past two decades to become a significant player in electric vehicles and global clean energy technology.
This SWOT analysis examines BYD's strengths, weaknesses, opportunities, and threats as it competes in the fast-changing automotive and energy storage industries.
Founded in 1995 and headquartered in Shenzhen, BYD started as a battery company before expanding into automobiles in the early 2000s.
Initially manufacturing gasoline-powered vehicles, BYD focused on plug-in hybrid and fully electric vehicles, leveraging its expertise in battery technology.
Today, BYD is the world’s largest electric vehicle manufacturer, delivering over 1.2 million electric cars globally. The company also produces electric buses, trucks, forklifts, and rail transit.
On the energy side, BYD is a major supplier of rechargeable batteries for cell phones, laptops, electric vehicles, and energy storage systems.
Turin Startup Ecosystem 2024 - Ricerca sulle Startup e il Sistema dell'Innov...Quotidiano Piemontese
Turin Startup Ecosystem 2024
Una ricerca de il Club degli Investitori, in collaborazione con ToTeM Torino Tech Map e con il supporto della ESCP Business School e di Growth Capital
Financial Assets: Debit vs Equity Securities.pptxWrito-Finance
financial assets represent claim for future benefit or cash. Financial assets are formed by establishing contracts between participants. These financial assets are used for collection of huge amounts of money for business purposes.
Two major Types: Debt Securities and Equity Securities.
Debt Securities are Also known as fixed-income securities or instruments. The type of assets is formed by establishing contracts between investor and issuer of the asset.
• The first type of Debit securities is BONDS. Bonds are issued by corporations and government (both local and national government).
• The second important type of Debit security is NOTES. Apart from similarities associated with notes and bonds, notes have shorter term maturity.
• The 3rd important type of Debit security is TRESURY BILLS. These securities have short-term ranging from three months, six months, and one year. Issuer of such securities are governments.
• Above discussed debit securities are mostly issued by governments and corporations. CERTIFICATE OF DEPOSITS CDs are issued by Banks and Financial Institutions. Risk factor associated with CDs gets reduced when issued by reputable institutions or Banks.
Following are the risk attached with debt securities: Credit risk, interest rate risk and currency risk
There are no fixed maturity dates in such securities, and asset’s value is determined by company’s performance. There are two major types of equity securities: common stock and preferred stock.
Common Stock: These are simple equity securities and bear no complexities which the preferred stock bears. Holders of such securities or instrument have the voting rights when it comes to select the company’s board of director or the business decisions to be made.
Preferred Stock: Preferred stocks are sometime referred to as hybrid securities, because it contains elements of both debit security and equity security. Preferred stock confers ownership rights to security holder that is why it is equity instrument
<a href="https://www.writofinance.com/equity-securities-features-types-risk/" >Equity securities </a> as a whole is used for capital funding for companies. Companies have multiple expenses to cover. Potential growth of company is required in competitive market. So, these securities are used for capital generation, and then uses it for company’s growth.
Concluding remarks
Both are employed in business. Businesses are often established through debit securities, then what is the need for equity securities. Companies have to cover multiple expenses and expansion of business. They can also use equity instruments for repayment of debits. So, there are multiple uses for securities. As an investor, you need tools for analysis. Investment decisions are made by carefully analyzing the market. For better analysis of the stock market, investors often employ financial analysis of companies.
how to sell pi coins in South Korea profitably.DOT TECH
Yes. You can sell your pi network coins in South Korea or any other country, by finding a verified pi merchant
What is a verified pi merchant?
Since pi network is not launched yet on any exchange, the only way you can sell pi coins is by selling to a verified pi merchant, and this is because pi network is not launched yet on any exchange and no pre-sale or ico offerings Is done on pi.
Since there is no pre-sale, the only way exchanges can get pi is by buying from miners. So a pi merchant facilitates these transactions by acting as a bridge for both transactions.
How can i find a pi vendor/merchant?
Well for those who haven't traded with a pi merchant or who don't already have one. I will leave the telegram id of my personal pi merchant who i trade pi with.
Tele gram: @Pi_vendor_247
#pi #sell #nigeria #pinetwork #picoins #sellpi #Nigerian #tradepi #pinetworkcoins #sellmypi
What price will pi network be listed on exchangesDOT TECH
The rate at which pi will be listed is practically unknown. But due to speculations surrounding it the predicted rate is tends to be from 30$ — 50$.
So if you are interested in selling your pi network coins at a high rate tho. Or you can't wait till the mainnet launch in 2026. You can easily trade your pi coins with a merchant.
A merchant is someone who buys pi coins from miners and resell them to Investors looking forward to hold massive quantities till mainnet launch.
I will leave the telegram contact of my personal pi vendor to trade with.
@Pi_vendor_247
The secret way to sell pi coins effortlessly.DOT TECH
Well as we all know pi isn't launched yet. But you can still sell your pi coins effortlessly because some whales in China are interested in holding massive pi coins. And they are willing to pay good money for it. If you are interested in selling I will leave a contact for you. Just telegram this number below. I sold about 3000 pi coins to him and he paid me immediately.
Telegram: @Pi_vendor_247
how to sell pi coins in all Africa Countries.DOT TECH
Yes. You can sell your pi network for other cryptocurrencies like Bitcoin, usdt , Ethereum and other currencies And this is done easily with the help from a pi merchant.
What is a pi merchant ?
Since pi is not launched yet in any exchange. The only way you can sell right now is through merchants.
A verified Pi merchant is someone who buys pi network coins from miners and resell them to investors looking forward to hold massive quantities of pi coins before mainnet launch in 2026.
I will leave the telegram contact of my personal pi merchant to trade with.
@Pi_vendor_247
how to sell pi coins on Bitmart crypto exchangeDOT TECH
Yes. Pi network coins can be exchanged but not on bitmart exchange. Because pi network is still in the enclosed mainnet. The only way pioneers are able to trade pi coins is by reselling the pi coins to pi verified merchants.
A verified merchant is someone who buys pi network coins and resell it to exchanges looking forward to hold till mainnet launch.
I will leave the telegram contact of my personal pi merchant to trade with.
@Pi_vendor_247
Introduction to Indian Financial System ()Avanish Goel
The financial system of a country is an important tool for economic development of the country, as it helps in creation of wealth by linking savings with investments.
It facilitates the flow of funds form the households (savers) to business firms (investors) to aid in wealth creation and development of both the parties
Webinar Exploring DORA for Fintechs - Simont Braun
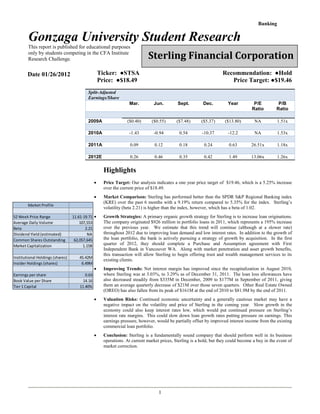
CFA Institute Research Challenge Sterling Financial Corporation (STSA) research report Gonzaga University
1. Banking
Gonzaga University Student Research
This report is published for educational purposes
only by students competing in the CFA Institute
Research Challenge.
Sterling Financial Corporation
Ticker: ●STSA
Price: ●$18.49
Date 01/26/2012
Recommendation: ●Hold
Price Target: ●$19.46
Split-Adjusted
Earnings/Share
Mar.
Jun.
Sept.
Dec.
Year
P/E
Ratio
P/B
Ratio
2009A
($0.40)
($0.55)
($7.48)
($5.37)
($13.80)
NA
1.51x
2010A
-1.43
-0.94
0.54
-10.37
-12.2
NA
1.53x
2011A
0.09
0.12
0.18
0.24
0.63
26.51x
1.18x
2012E
0.26
0.46
0.35
0.42
1.49
13.06x
1.26x
Highlights
Price Target: Our analysis indicates a one year price target of $19.46, which is a 5.25% increase
over the current price of $18.49.
Market Comparison: Sterling has performed better than the SPDR S&P Regional Banking index
(KRE) over the past 6 months with a 9.19% return compared to 5.35% for the index. Sterling’s
volatility (beta 2.21) is higher than the index, however, which has a beta of 1.02.
11.61-19.71
107,553
2.21
NA
62,057,645
1.15B
Growth Strategies: A primary organic growth strategy for Sterling is to increase loan originations.
The company originated $926 million in portfolio loans in 2011, which represents a 195% increase
over the previous year. We estimate that this trend will continue (although at a slower rate)
throughout 2012 due to improving loan demand and low interest rates. In addition to the growth of
the loan portfolio, the bank is actively pursuing a strategy of growth by acquisition. In the first
quarter of 2012, they should complete a Purchase and Assumption agreement with First
Independent Bank in Vancouver WA. Along with market penetration and asset growth benefits,
this transaction will allow Sterling to begin offering trust and wealth management services to its
existing clients.
Market Profile
52 Week Price Range
Average Daily Volume
Beta
Dividend Yield (estimated)
Common Shares Outstanding
Market Capitalization
Institutional Holdings (shares)
Insider Holdings (shares)
45.42M
6.49M
Earnings per share
Book Value per Share
Tier 1 Capital
0.63
14.16
11.40%
Improving Trends: Net interest margin has improved since the recapitalization in August 2010,
where Sterling was at 3.03%, to 3.29% as of December 31, 2011. The loan loss allowances have
also decreased steadily from $335M in December, 2009 to $177M in September of 2011, giving
them an average quarterly decrease of $21M over those seven quarters. Other Real Estate Owned
(OREO) has also fallen from its peak of $161M at the end of 2010 to $81.9M by the end of 2011.
Valuation Risks: Continued economic uncertainty and a generally cautious market may have a
negative impact on the volatility and price of Sterling in the coming year. Slow growth in the
economy could also keep interest rates low, which would put continued pressure on Sterling’s
interest rate margins. This could slow down loan growth rates putting pressure on earnings. This
earnings pressure, however, would be partially offset by improved interest income from the existing
commercial loan portfolio.
Conclusion: Sterling is a fundamentally sound company that should perform well in its business
operations. At current market prices, Sterling is a hold, but they could become a buy in the event of
market correction.
1
2. Indexed Returns
$115
$112
$109
$106
$103
$100
$97
$94
$91
$88
$85
$82
$79
$76
$73
$70
STSA
KRE*
*SPDR S&P Regional Banking ETF (KRE) Source:Yahoo Finance
Business Description
Sterling Financial Corporation is the bank holding company for Sterling Savings Bank, which began in 1983
in Spokane, Washington. Sterling Savings bank also operates a subsidiary commercial bank, Intervest
Mortgage Investment Co., founded in 1987, which focuses on institutional lending. Sterling expanded
rapidly, largely through aggressive acquisitions, and now has over $9.1 billion in assets, with 178 branches in
five states including Washington, Oregon, Montana, Idaho and California.
As a regional commercial bank Sterling offers a typical array of financial products including consumer loans,
real estate mortgages, retirement and wealth management services, commercial loans, and a full range of
deposit products. While they offer a broad product mix, they have a strong focus on business relationships.
Moving forward, the bank seeks to strengthen this focus.
During the height of the market, Sterling was heavily involved in construction lending, especially speculative
development projects, with as much as 33% of their total loan portfolio concentrated in this one segment.
When the real estate market collapsed, many of these loans defaulted. Many banks, including Sterling, are
still liquidating OREO properties, much of which was land and speculative housing developments. OREO
increased dramatically as management took foreclosure actions on non performing assets, and since their
peak at the end of 2010, Sterling has been liquidating these problem loans systematically. As a necessary
reaction to the current market conditions, only 4% of their loan portfolio is now concentrated in construction
and development (C&D). This has helped to improve their portfolio quality, since C&D loans typically carry
the highest level of default risk. Analysis of their current portfolio concentration indicates that they are much
more reasonably diversified, so OREO should continue to decline.
Sterling’s subsidiary, Intervest, is a small portion of the overall company, but because this company
specializes in brokering loans to the secondary market (primarily insurance companies), they are able to offer
terms to borrowers that most community banks or credit unions cannot offer. This allows Sterling to capture
borrowers that would be forced to work with larger national banks that also offer institutional lending
solutions. The loans that are sold to insurance companies are typically of high quality, but the terms would
not be favorable to Sterling because they often have longer fixed-rate terms associated with them. By
brokering these loans, Sterling is able to earn fee income while reserving capital for higher yielding loan
products.
Management has targeted their portfolio concentrations at 1/3 in consumer loans (including mortgages), 1/3
in commercial loans and 1/3 in non-owner occupied commercial real estate. With much of their loan
portfolio in commercial loans, they are at the high end of the spectrum compared to their peer group. This is
not necessarily a concern, but it does indicate the strategic approach that they are taking. This strategy has a
unique set of benefits and risks, which we discuss throughout this analysis.
3. Community Involvement
One of Sterling’s strengths is their Community Involvement, which has been a focus for Sterling since its
inception. They show commitment to customer relationships and their communities through multiple
channels, as they hope to make a positive impact on the communities in which they operate. In 2010,
Sterling employees donated more than 25,000 hours to over 400 organizations, demonstrating their dedication
to the mission of being a community-focused entity. This community investment is not only good for
society, but it creates name recognition and a positive image of the bank.
Recapitalization
Due to its heavy loan losses from 2008-2010, Sterling’s capitalization plunged until they came under heavy
regulatory pressure that culminated in a Cease and Desist order in 2010. The Cease and Desist order required
Sterling to improve its Tier 1 capital to 10% or better, reduce its level of classified and non-performing loans,
and to restructure the management team. Sterling restructured in August 2010, receiving a net capital
infusion of $730 million from two private equity funds and 30 other individual investors. Both of the private
equity firms are registered as bank holding companies, with significant banking experience. Each received
one non-voting board seat. Subsequent to the restructuring, Sterling’s capitalization exceeded their 10% Tier
1 capital requirements. As part of this recapitalization, the cease and desist order was lifted.
A large part of Sterling’s strategy has been to reduce its levels of non-performing assets by selling or
otherwise divesting themselves of distressed properties. They have been able to reduce OREO properties by
$68.9 million year over year, which is a 46% decrease. Loan loss allowance has fallen by $69.6 million over
the past year, which is a 28% decrease.
Millions
Loan Loss Allowance
400
350
300
250
200
150
100
50
0
Management
Much of the success of the recapitalization of Sterling can be attributed to the current management of Sterling
Financial Corporation and Sterling Savings Bank. Despite a challenging environment for the banking
industry, managers were able to orchestrate the investment of two large private equity firms, who provided
the large capital investment necessary for recapitalization. This success, along with consistent improvement
of the financial performance of the institution, indicates the strong capabilities of management. Brad
Williamson, director of the state DFI Banking Division, who headed the team that was in charge of closing
banks in Washington, stated succinctly that, “Sterling survived because management did a good job getting a
handle on its problems.”
J. Gregory Seibly serves as the President and CEO of Sterling Financial Corporation, and has been a major
part of the restructuring of Sterling. Mr. Seibly also sits on the Board of Directors, which boasts impressive
resumes within the banking industry, as well as in other business endeavors. Included in the Board are former
management from Wells Fargo & Company, Bank of America, U.S. Bank, Citicorp, and JPMorgan Chase, as
well as presidents of Ivar’s Inc., Norwest Corporation, and Starbucks Coffee. This extensive understanding
of business and banking allows Sterling to view their current situation from knowledgable positions and
diverse prior experiences. Executive experience is critical to determining the direction of the organization, so
it is important that Sterling’s leadership comes from diverse financial backgrounds. The presence of these
4. diverse backgrounds and experiences suggests that they will have the knowledge necessary to grow Sterling
into the future.
One notable management change in 2011 was that Sterling’s former CFO was replaced with Patrick J.
Rusnak. Before moving to Sterling, Mr. Rusnak was the CEO of AmericanWest Bank. He was promoted
from CFO to CEO and tasked with the responsibility of recapitalizing to avoid bankruptcy. He was successful
in recapitalizing the bank by negotiating investments from private equity investors. This experience in
working through the turnaround of a troubled bank and the facilitation of a recapitalization exhibits valuable
skills which will help Mr. Rusnak to facilitate Sterling’s full recovery.
The private equity (PE) firms that injected capital into Sterling were Warburg Pincus and Thomas H. Lee
Partners. According to Private Equity International, an industry trade publication, Warburg Pincus is the 13th
largest private equity firm in the world and Thomas H. Lee Partners is the 27th largest (based on total
fundraising over the preceding 5 years). Although banking regulations restrict the PE firms from exercising
direct control over the management of banks, the management expertise and network of industry contacts
they provide is a tremendous asset for a relatively small bank such as Sterling. Sterling also benefits from the
expertise of Scott L. Jaeckel, the managing director of Thomas H Lee Partners, and David A. Coulter, the
managing director and senior advisor at Warburg Pincus, who joined the Board of Directors in 2010. As a
result of the bargaining power of these large investors, Sterling may be able to engage in service contracts
with vendors on more favorable terms. The PE firms provide a wealth of knowledge that will be useful in
benchmarking and determining best practices. Prior to the financial crisis, Sterling outgrew the expertise of
their management, which led to many of the subsequent problems. Overall, our analysis of the new
management at Sterling indicates that they are well equipped to direct the company towards greater
profitability, in the future.
Growth Strategy
Sterling has strived to increase loan originations year over year. The company originated $926M million in
portfolio loans in 2011, which represents a 195% increase over the previous year. We estimate that this trend
will continue throughout 2012 due to improved loan demand and low interest rates. Downward pressure on
interest rates is a concern, however, due to the increase in demand and increase in competition as many banks
more aggressively pursue loan growth. This trend is evidenced by the decrease in loan yields of 0.13% since
3rd qtr of 2011.
Loan Portfolio
Concentrations
Sterling
13%
4%
18%
7%
7%
25%
13%
10%
2%
Residential real estate
Investor CRE
Multifamily
Construction
Total commercial real estate
Owner occupied CRE
C&I
Total commercial
Sterling has recently been increasing their percentage of assets concentrated in multi-family housing loans.
This is beneficial as this is one of the strongest sectors in the commercial real estate spectrum. Management
has an internal target for this sector of 22% of total loans. The average loan to value (LTV) of these loans is
66% and the debt service coverage ratio (DSCR) (net operating income divided by debt payments) is 1.30:1.
Both of these ratios are better than the standard underwriting qualifications of 75% LTV and 1.20:1 DSCR at
most competing commercial banks. This should help them to avoid significant defaults.
Consumer
Loan Portfolio
Concentration
First Independent
47%
6%
6%
13%
16%
12%
Consumer and Other
C&I
CRE
Multi-Family
1-4 Family
C&D
At projected growth rates for multi-family loans, the company will need to start selling these notes in order to
maintain their target loan portfolio composition. This could be done effectively through their subsidiary,
Intervest. They could also attempt to grow their other loan segments at a similar rate.
In addition to loan portfolio growth, the bank is actively pursuing a strategy of growth by acquisition. In the
first quarter of 2012, they should complete a Purchase and Assumption agreement with First Independent
Bank in Vancouver, WA. Along with market penetration and asset growth benefits, this transaction will
allow Sterling to begin offering trust and wealth management services to its existing clients. With Tier 1
capital exceeding 11%, Sterling is well-positioned for further acquisitions.
First Independent Purchase and Assumption
As previously noted, Sterling has historically grown their business primarily through acquisitions. Now that
they have returned to profitability, they appear to be returning to that model. Sterling is in the process of
finalizing a P&A Agreement with First Independent Bank. The P&A structure was chosen over an acquisition
in order to allow Sterling to exclude approximately $79 million worth of undesirable assets. The transaction
will add approximately $691 million in deposits, $450 million of trust and wealth management assets, and 16
additional branch and office locations.
First Independent operated with a similar focus on community banking, so this acquisition should allow
Sterling to expand their reach in the Vancouver/Portland market, while maintaining their community focus
and feel. One of the most beneficial aspects of this transaction is that it will allow Sterling to add wealth
management and trust services to its product offerings throughout the company. Our analysis indicates that
there will not be significant overlap of the geographical footprint of the combined entities. Sterling’s
management has stated that they expect modest operational efficiencies from the P&A as a result of the
consolidation of back office personnel.
5. Deposit Mix
First Independent
26%
16%
35%
13%
7%
3%
CDs
IRA
Savings
Money Market
Non-interest Checking
The acquired assets and deposits have a product mix favorable to Sterling, and merited a $25 million
premium, of which $17 million is contingent upon the quality of the loan portfolio and retention of at least
90% of pre P&A deposit levels. The conditions of the closing are reasonable and the banks are working
closely with regulators throughout the process, so the transaction is likely to be completed in the first quarter
of 2012.
Customer Retention
The McKinsey Banking Report suggests that banks will need to transition to a Customer Relationship focus
in order to succeed in today’s economy. Sterling paid above industry average for time deposits in an effort to
attract customers and maintain adequate liquidity prior to the restructuring. This resulted in interest expense
being well above industry average. Sterling seeks to retain their core customers, but allow “floating”
customers (those that change banks often in search of the best rates) to drift away. To retain their core
customers, Sterling is focusing on customer service and relationship banking, positioning itself to become the
premier one-stop commercial bank in their region. This builds customer loyalty, while also shifting their
deposit mix more toward business checking accounts and demand deposits, instead of savings accounts and
CD’s.
Industry Overview and Competitive Positioning
Financial markets have remained volatile as investors are still trying to determine the impact of the housing
crisis going into the future, as well as determine the impact of the European debt crisis on the economy.
Although loan demand is currently rising, there is still the threat that lagging loan demand due to poor
economic conditions and uncertain economic outlook could slow the financial sector recovery. Although it
does not directly impact regional banks, the spillover effects of the European debt crisis could adversely
impact the market for financial stocks as a whole.
In today’s banking environment, where interest rate risk is a significant concern, commercial lending
typically offers the benefit of variable loan rates, which can reduce this risk. In general, banks prefer to have
variable loan products in a rising rate environment. Following the recent Federal Reserve pronouncements,
we believe that interest rates will remain fairly flat through 2013. Loan demand has increased over the past
two quarters, especially for business loans. This trend is helpful for commercial banks such as Sterling.
Despite concerns about commercial real estate following the pattern of extremely high foreclosures, as seen
in the housing sector, commercial real estate foreclosures have not been as high as projected. In the Pacific
Northwest (Sterling’s primary market), the foreclosure rate and rate of distressed properties has been
manageable.
Regulatory Risk
On October 1, 2011 the Durbin Amendment of the Dodd-Frank Act took affect. This regulation significantly
reduces the fee income generated by the use of debit cards for institutions with more than $10 billion in
assets. It is anticipated that Sterling will not reach the $10 billion threshold in 2012, but likely would in
2013. At that point, the projected revenue losses per year will be approximately $7 million. These
transaction fee changes do not affect credit card fees. Sterling has very low levels of credit card assets as a
percentage of total loans, and could increase their marketing of credit cards in order to offset this loss of
income.
The Troubled Asset Relief Program (TARP) was signed into law in October 2008, as an attempt by the U.S.
Government to increase liquidity and capitalization by purchasing assets and equity from financial
institutions, thereby strengthening the financial sector as a whole. Sterling received funds from TARP in
December of 2008. As a concession to Sterling, the preferred stock shares issued to the government were
converted to common stock during their recapitalization, so they have no further special obligations as a
consequence of TARP. The government’s consequential minority ownership of Sterling has no impact on its
valuation.
The Federal Reserve’s recent endorsement of higher capital requirements could limit the profitability
potential of large institutional banks. Although these changes could impact smaller banks, it could function as
an opportunity for Sterling, as these regulations are likely to affect larger banks more heavily. Further,
Sterling’s Tier 1 capital is already 11.4%, and they are maintaining an 11% target rate. Any regulatory
change in this area could benefit Sterling, as Sterling would likely exceed the new standard, and it would put
further pressure on Sterling’s competitors.
6. Competitor Analysis
Banking has become a commoditized industry. In order to compete effectively, some banks try to specialize
in key areas and some use a diversification strategy (all things to all people). The competitive landscape for
Sterling includes a wide range of financial institutions. Large banks such as BofA, Chase and Wells Fargo,
and small community banks all compete with Sterling for customers. (See Marketshare tables in Appendix 3)
Within Washington, Oregon, Idaho, Montana and California, Sterling has the ability to serve the specific
needs of the customer, but their lack of presence outside those states makes Sterling less appealing to
depositors who need access to their funds across the country or internationally. For example, Sterling cannot
compete with larger banks such as JPMorgan Chase or Bank of America in their geographical reach, because
those banks each offer over 5,000 branch offices nationwide where Sterling is currently limited to 193
branches and only the Northwest region.
Credit unions, which have been growing rapidly, were given an additional surge of membership and exposure
as a result of Occupy Wall Street and National Bank Transfer Day initiatives which urged bank customers to
move to these non-profit financial institutions. Regulations for credit unions have become less stringent over
time, allowing them to have less restrictive membership requirements and to offer additional business
products. They are increasingly becoming a threat to banks as they expand into commercial lending.
Deposit Mix-Sterling
32%
19%
41%
8%
Interest-bearing transaction
Noninterest-bearing transaction
Savings and MMDA
Time deposits
Net Interest Margin
The shape of the treasury yield curve has flattened significantly over the past 6 months. Flattening of the
curve is caused by a number of factors, including the Fed’s quantitative easing, but usually is indicative of
bond investors’ lack of confidence in the market. Net interest margin has been impacted by this shrinking
margin between short and long term interest rates. As long term interest rates decline, competition forces
banks to lower the rates that they charge for loans. Savings rates are not able to fall at the same rate, so their
margins shrink. This is a significant risk for Sterling as they have a higher than average cost of capital.
In addition to the capital that Sterling raised through private equity firms, they needed to quickly raise capital
by attracting traditional deposits. To accomplish this, they were required to offer significantly higher rates
than market for deposits (primarily time deposits). This strategy was successful, but it reduced the net
interest margin of the bank. With maturities between 1 and 5 years, these CDs are starting to mature and this
should help reduce the average cost of capital. As of December 31st, 2011, the average cost of these deposits
was 0.80%, which matched the peer average. This cost of funds for Sterling is down from 0.86% in the third
quarter of 2011. The P&A will also help to reduce the cost of deposits because First Independent has an
average cost of interest bearing deposits significantly below the market, at 0.41%.
As with most financial institutions, a vast majority of Sterling’s fixed mortgages are immediately sold to
Fannie Mae or Freddie Mac after origination. This asset management strategy reduces Sterling’s exposure to
interest rate risk in the current interest rate environment since real estate loans have long term rates that are
still historically low.
Regulation Q, originally part of the Glass-Steagall Act of 1933, was recently repealed by the Dodd-Frank
Act. As a result of the repeal of Reg Q, banks are no longer prohibited from paying interest on demand
deposits (checking accounts). The impact of this change will likely be minimal in this low rate environment,
but once interest rates start to climb, this will be another competitive tool that banks will use to attract
deposits, and could negatively impact net interest margins.
Duration Gap Analysis
One tool commonly used to calculate interest rate risk is an analysis of the Duration Gap between assets and
liabilities. Sterling manangment has calculated their duration of assets at 1.65 years and duration of liabilities
at 2.42 years. This yields a duration gap of -1.088 years. Because of a negative duration gap, Sterling’s
financial performance will actually improve as interest rates rise (all else being equal). It should be noted that
in calculating durations of assets and liabilities, managers must make certain assumptions when determining
the cash flow streams. If these assumptions are incorrect, then the validity of the duration gap analysis will
also be incorrect. Based on Sterling’s duration numbers, the change in net worth as a percentage of assets
would increase 50% if interest rates increase by 3%. This indicates that Sterling could significantly benefit
from an environment of rising interest rates.
Investment Summary
Our analysis indicates a one year price target of $19.46, which is a 5% increase over the current price.
Sterling has performed better than the SPDR S&P Regional Banking index over the past 6 months with a
9.19% return vs. 5.35% for the index. Sterling’s volatility (beta of 2.21) is higher than the index, which has a
beta of 1.02.
7. Currently, Sterling does not pay dividends. Competitors such as Umpqua Holdings Corporation (UMPQ) and
Glacier Bancorp, Inc. (GBCI) have paid regular dividends to investors, making them appear stronger to
investors who have a focus on dividend returns. Sterling stopped paying dividends during the financial crisis
(after the third quarter of 2008). Very recently, one of the obstacles to paying dividends, the Memorandum of
Understanding (MOU), was recinded. According to Sterling management, the Department of Financial
Institutions (DFI) is reviewing Sterling’s financial condition relating to the final restrictions on dividend
payments. This would indicate that Sterling may be able to start paying dividends once it has paid all of the
accrued interest on its subordinated debt. Management has indicated that they do not currently have plans to
issue dividends.
Positive EPS Surprises:
Sterling has a good track record of positive EPS surprises over the past four quarters, indicating that they
have been successful in managing the firm. This recent track record of positive surprise also suggests that
Sterling has been effective at managing market expectations by being very transparent in their actions. The
positive track record continues in performance against the Financial sector as a whole, in which Sterling has
outperformed by 3.7% in the last month and 18.9% over six months.
The market has reacted well to Sterling’s performance outlook and the news of the P&A agreement with First
Independent. The share price has risen over 18.5% since the purchase announcement. This also may be an
indicator that the market supports management’s decision to seek out these types of acquisitions.
Figure 1: Sterling Stock Price and News Last 12 Months
Source: Schwab
Valuation
We derived the price target of Sterling using a weighted average of the Forward P/E ratio (20% weight) and
the P/BV ratio (80%). Historically, the PE ratio has been a commonly used ratio for determining the current
valuation of a company’s stock. One problem with this ratio in a poor economic climate is that when there
are very low or negative earnings, then this valuation tool becomes less effective. As banks have started to
recover from the recession, this ratio is again a relevant instrument for assessing the value of a company. The
Forward PE ratio looks further into the recovery, creating more realistic valuation expectations. Because it
8. relies on third-party estimates of future earnings for the comparable banks, it still merits a lower weighting
than the P/BV ratio.
The price to book value ratio (P/BV) is arguably the best metric for evaluating a capital intensive company
such as a bank. Unlike many industries, this is a good metric because the book value of assets for banks is
presumably very close to the actual market value. This assumes that problem loans have been identified and
marked to market. During the real estate bubble banks had inflated asset values, but we believe that the
necessary corrections have been made and book values closely match the market. Any P/BV ratio of more
than 1.00 would mean either that the market thinks the company has undervalued the assets or investors
believe that the current (or projected) ROA is positive. Many banks are still trading at levels which result in
P/BVs which are less than 1, but our comparables yielded a weighted average that was 1.24. Because this is
the stronger of the two metrics, we gave the P/BV an 80% weighting in our analysis. (See Appendix 11)
As we used a comparables approach for the valuation of Sterling, our analysis depended on finding the most
highly comparable companies. The FDIC identifies Sterling’s peer group as all banks above $3 billion in
assets. Sterling is a pure-play bank, and most larger banks are not pure play firms. Furthermore, banks with
fewer than $3 billion in assets face a different regulatory environment. For these reasons, we determined that
only banks within $6 billion in assets were truly comparable. We excluded banks above $16 billion in asset
size, subsidiaries of larger banks, non-commercial banks, industrial banks and non-public banks.
The remaining banks were ranked by their similarity to Sterling in a number of financial categories, including
interest income and expense, net interest margin, loan loss provisions, non-interest income and expenses, and
loan portfolio. Commercial banks operate in a different manner than retail banks, so the remaining banks
were ranked based on the level of commercial assets comparative to Sterling. Those banks not highly similar
in their asset mix were excluded. The financial information we used for this analysis came from the FDIC.
(See Appendix 8)
A banks’ performance is strongly influenced by the economic conditions in which they operate, so we
calculated an economic strength coefficient for the remaining banks in our sample. We used two variables to
determine the economic strength of States in which the banks operate: GDP growth and unemployment rates.
For banks that operate in multiple States, we weighted these calculations based on the percentage of branches
that they have in each state. (See Appendix 9)
The banks in the sample are similar in size, have strong concentrations in commercial loans, and operate in
markets that are equivalent economically to those of Sterling. In addition, their financial performance metrics
and ROA are similar to Sterling’s.
The nine banks we determined to be the closest peers to Sterling are First Midwest Bank (FMBI), Umpqua
Bank (UMPQ), MB Financial Bank (MBFI), The Privatebank and Trust Company (PVTB), National Penn
Bank (NPBC), Citizen Bank (CRBC), United Bank (UBSI), Banner Bank (BANR), and Columbia State
Bank (COLB). Interestingly, three of the nine banks which we identified as the closest peers to Sterling are
also direct competitors (Umpqua Bank, Banner Bank, and Columbia State Bank).
The composite price to book value and P/E ratios were then calculated using weights assigned by their
relative rankings. This gave a slightly higher weighting for those banks that were the most similar to
Sterling. The resulting weighted average Forward P/E ratio target was 28.97 and the weighted average P/BV
was calculated at 1.05. (See Appendix 11)
We calculated the projected balance sheet and income statement data for Sterling and used the statistical
forecasting method of two factor exponential smoothing to create baseline growth projections. Income
forecasts were based on financial performance for Sterling and their comparables group, and balance sheet
forecasts were based on Sterling’s own balance sheet, both using data from the last ten quarters. (See
Appendix 4, 5, 6)
We then modified these projections where necessary, following management guidance and taking into
account competitive risks, economic outlook, and regulatory environment. Using this technique, we
calculated the 12/31/12 book value per share to be $15.42 and the earnings per share to be $1.49. The EPS of
$1.49 was multiplied by the weighted average Forward P/E ratio of the comparables (13.99) to arrive at a
Target price of $20.85. The book value per share was multiplied by the P/BV of the comparables to give a
price of $19.12. Using the 20/80 weighting noted above, the final calculated YE 2012 target price for
Sterling is $19.46. (See Appendix 4, 7, 11)
9. Financial Analysis
Sensitivity Analysis
EPS
3
2.25
1.49
0.99
0
BVPS
18.42
16.18
15.42
14.92
13.93
Price
26.67
22.35
19.47
17.57
17.27
Sensitivity analysis
To determine the sensitivity of the market price to variability in earnings per share, we determined a range of
possible earnings per share estimates. These estimates range from no earnings to $3 per share for 2012. For
each earnings estimate, we calculated book value and used our target forward PE ratio and price to book
value ratio to determine a target price. For our low estimate of no earnings, forward PE ratio would be not
applicable, so the price target has a 100% weighting on the price to book value ratio. This sensitivity analysis
provided a range of possible stock prices, from a no earnings $17.27 per share target to a high earnings
$26.67 price target.
Capital Structure
Sterling benefits from a capital structure with little or no debt, making it less financially risky when compared
to the industry aggregate. Competitors such as Glacier Bancorp, Inc. (GBCI) operate with greater long-term
liabilities and therefore greater financial risk. Sterling does, however, have over $1 billion in junior
subordinated notes (forward repurchase agreements) for which they pay an average interest rate of 3.9%.
These interest payments have been accruing, and are required to be paid current before dividends can be paid.
The high interest rate on these notes has an adverse impact on the net interest margin of the bank. (See
Appendix 5)
Earnings
We took Sterling’s performance ratios and forecasted earnings based on projected changes. Interest income is
expected to decline somewhat over the next year, but this is partially offset by a decrease in interest expense.
Net interest margin improves to 3.38%, which is only a partial improvement over the 3.30% at close of 2011.
Management’s target for net interest margin is 4.00, but we do not expect Sterling to reach this target until the
Federal Reserve relaxes interest rate controls. (See Appendix 6, 7)
Balance Sheet
An understanding of the trends in asset growth is critical to an understanding of the financial performance of
the company. Our analysis of Sterling’s asset growth assumes that loan portfolio would decrease somewhat
in the first quarter and then begin gradual growth as Sterling manages the portfolio to remain below the $10
billion asset level. This has a net positive effect on Sterling’s net income for 2012. We expect the securities
portfolio to be managed in a similar fashion, with tapered growth and then some decline in the fourth quarter,
to keep Sterling from exceeding the $10 billion asset level. (See Appendix 5)
Sterling maintains a direct purchase plan for individuals to buy newly issued shares directly through their
transfer agent, American Stock Transfer & Transfer Services, LLC. Increase in common shares outstanding
through this program is very small, and we projected very modest increases throughout the year.
Investment Risks
Insufficient Capital Levels
If Sterling’s current capital levels are found to be insufficient because of changing regulations, they may need
to raise additional capital that may be subject to additional regulatory restrictions. For example, if the
economic conditions worsen leading to additional provision for loan losses then it could force Sterling to seek
additional capital.
Issuing New Securities
Sterling may decide to raise capital through public or private debt or equity finacing, so if the decision is
made to raise funds through the issuance of securities that could dilute ownership interests of existing
shareholders.
Acquisition Risks
Acquisitions make up a large part of Sterling’s growth strategy, leaving them susceptible to the risks
associated with acquisitions. These risks include overpaying for assets as well as improper implimentation or
integration of newly aquired assets. Unfavorable accounting consequences as well as increases in taxes may
cause acquisitions that appeared to be beneficial to ultimately hurt Sterling overall because of unforeseen
factors.
Regulator Restrictions
There remains some uncertainty as to when regulator restrictions will be lifted or additionally imposed.
Under the terms of the Reserve Bank Agreement, Sterling cannot currently pay dividends, and there is no
certainty that the restriction on dividends will be lifted in the near future. The Reserve Bank Agreement also
10. prevents Sterling from appointing new board members or senior executive officers, which could prevent
Sterling from making personel changes that could benefit the bank.
THL and Warburg Pincus
Because of the significant holdings of these investors they each have a representative on the Board of
Directors. Although these board members are non-voting, they will have influence over corporate
governance. This becomes a risk if the goals of THL and Warburg Pincus become substantially different
Sterling, leading to a conflict of interests on the Board.
Stock Volatility
Sterling’s stock price has been very volatile, which may cause investors to lack confidence in the investment
quality of this stock. This volitility may be a result of factors completely outside of the control of Sterling, as
well as larger trends within the Financial Sector, which includes Sterling. Public perception has a significant
impact on stock price so if the public continues to lack confidence in the banking industry it could negatively
impact the stock price.
11. Appendix 1 (Source: Sterling 10-Q 2011 3rd Quarter)
Largest Institutional Holders of STSA
Holder
Shares
% Outstanding
Value*
Reported
KING STREET CAPITAL M ANAGEM ENT, L.L.C.
2,973,487
4.8
36,811,769
30-Sep-11
Capital World Investors
2,888,260
4.66
35,756,658
30-Sep-11
Cyrus Capital Partners, L.P.
2,390,405
3.86
29,593,213
30-Sep-11
THORNBURG INVESTM ENT M ANAGEM ENT INC.
2,272,729
3.67
28,136,385
30-Sep-11
Anchorage Capital Group, LLC
2,272,727
3.67
28,136,360
30-Sep-11
LEE PARTNERS (THOM AS H.)
12,948,112
20.89
160,297,626
30-Sep-11
WARBURG PINCUS LLC
12,948,107
20.89
160,297,564
30-Sep-11
1,359,791
2.19
16,834,212
30-Sep-11
WELLINGTON M ANAGEM ENT COM PANY, LLP
907,191
1.46
11,231,024
30-Sep-11
BlackRock Institutional Trust Company, N.A.
603,540
0.97
7,471,825
30-Sep-11
Shares
% Outstanding
Value*
Reported
SM ALLCAP WORLD FUND
1,666,668
2.69
20,633,349
30-Sep-11
AM ERICAN FDS INSURANCE SER-GROWTH FD
VANGUARD GROUP, INC. (THE)
Appendix 2 (Source: Sterling 10-Q 2011 3rd Quarter)
Largest Mutual Fund Holders of STSA
Holder
1,221,592
1.97
15,123,308
30-Sep-11
VANGUARD SM ALL-CAP INDEX FUND
467,860
0.75
5,792,106
30-Sep-11
ISHARES RUSSELL 2000 INDEX FD
391,569
0.63
5,877,450
31-Oct-11
VANGUARD TOTAL STOCK M ARKET INDEX FUND
268,327
0.43
3,321,888
30-Sep-11
VANGUARD SM ALL CAP VALUE INDEX FUND
259,273
0.42
3,209,799
30-Sep-11
VANGUARD EXTENDED M ARKET INDEX FUND
251,775
0.41
3,116,974
30-Sep-11
FBR SM ALL CAP FINANCIAL FUND
244,185
0.39
3,023,010
30-Sep-11
Fidelity Strategic Advisors Small-M id Cap Fund
186,800
0.3
2,624,540
31-Aug-11
ISHARES RUSSELL 2000 VALUE INDEX FD
175,413
0.28
2,632,949
31-Oct-11
12. Appendix 3 (Source: Sterling Investor Relations presentation)
Appendix 4
Balance Sheet Assumptions
Assets and Liabilities
Total assets
Cash and due from depository institutions
Securities
Net loans & leases
Bank premises and fixed assets
Other real estate owned
Goodwill and other intangibles
All other assets
Total liabilities and capital
Total liabilities
Deposits held in domestic offices
Other borrowed funds
All other liabilities
Common stock
30-Dec-11
30-Mar-12
30-Jun-12
30-Sep-12
30-Dec-12
1.97%
4.14%
-1.54%
-0.43%
-26.58%
-9.12%
7.72%
0.99%
2.39%
-0.70%
-0.43%
-26.58%
0.00%
0.75%
0.49%
0.80%
0.00%
-0.54%
-26.58%
0.00%
0.00%
0.25%
0.00%
0.62%
-0.76%
-26.58%
0.00%
-1.25%
0.12%
-2.39%
0.94%
-0.97%
-26.58%
0.00%
-2.30%
0.10%
-5.27%
13.84%
0.10%
-5.27%
-13.84%
0.10%
-5.27%
-13.84%
0.10%
-5.27%
-13.84%
0.10%
-5.27%
-13.84%
0.02%
0.02%
0.02%
0.02%
0.02%
13. Appendix 5
Balance Sheet Projections (*Dollar figures in 000's)
Assets and Liabilities
Total assets
Cash and due from depository institutions
Interest-bearing balances
Securities
Federal funds sold & reverse repurchase agreements
Net loans & leases
Trading account assets
Bank premises and fixed assets
Other real estate owned
Goodwill and other intangibles
All other assets
30-Mar-12
30-Jun-12
30-Sep-12
30-Dec-12
9200202
488077
381956
2608770
0
5577565
0
83652
60137
20078
361923
9921707
540899
430271
2836582
0
5978715
0
115082
44537
23151
382742
9942706
539400
435610
2836582
0
6015872
0
114210
32698
25985
377958
9913329
537232
441016
2768788
0
6072121
0
113099
24006
28818
369265
Total liabilities and capital
Total liabilities
Total deposits
Deposits held in domestic offices
% insured
Federal funds purchased & repurchase agreements
Trading liabilities
Other borrowed funds
Subordinated debt
All other liabilities
9168755
8282996
6492403
6492403
0.9008
1055763
0
384253
245290
105288
9164964
8254784
6498994
6498994
0.9008
1055763
0
364021
245290
90716
9118811
8179661
6505592
6505592
0.9008
1005763
0
344855
245290
78161
9018315
8057291
6512197
6512197
0.9008
905763
0
326698
245290
67343
Total equity capital
Total bank equity capital
Perpetual preferred stock
Common stock
Surplus
Undivided profits
Noncontrolling interests in consolidated subsidiaries
885759
893759
0
1964627
61115
-1131983
0
910180
910180
0
1965020
61115
-1115955
0
939150
939150
0
1965413
61115
-1087378
0
961024
961024
0
1965806
61115
-1065897
0
Book Value Per Share
Tier 1 Capital
Shares Outstanding
Average Total Assets
14.26
11.48474823
14.64
15.09
15.42
10.94319971 11.26765992 11.56426801
62119703
62181822
62244004
62306248
9,196,719.7
9,560,954.9
9,932,206.7
9,928,017.7
14. Appendix 6
Earnings and Profitability Summary Ratios
Q1 2012
Percent of Average Assets:
4.43
1.15
3.28
1.14
3.67
0.33
0.43
0.16
0.58
0.58
0.58
0.58
Interest Income (TE)
- Interest Expense
Net Interest Income (TE)
+ Noninterest Income
- Noninterest Expense
- Provision: Loan & Lease Losses
Pretax Operating Income (TE)
+ Realized Gains/Losses Sec
Pretax Net Operating Income (TE)
Net Operating Income
Net Income Adjusted Sub S
Net Income
Q2 2012
Q3 2012 Q4 2012
Postmerger
4.56
4.53
4.51
1.14
1.13
1.12
3.42
3.40
3.38
1.32
1.38
1.44
3.89
3.86
3.83
0.13
0.12
0.12
0.71
0.79
0.87
0.00
0.00
0.00
0.71
0.79
0.87
0.71
0.79
0.87
0.71
0.79
0.87
0.71
0.79
0.87
Appendix 7
Income Projections
30-Mar-12
30-Jun-12
30-Sep-12
30-Dec-12
*Dollar figures in thousands
(Quarterly)
(Quarterly)
(Quarterly)
(Quarterly)
Total interest income
Total interest expense
Net interest income
101862
24848
77013
Provision for loan and lease losses
Total noninterest income
Total noninterest expense
Pre-tax net operating income
Securities gains (losses)
Applicable income taxes
Income before extraordinary items
Extraordinary gains - net
Net income attributable to bank
2909.839077
26225.39294
84300.47997
16028
0
0
16028
0
16028
135042
112622
111671
29137
28238
24959
105906
84384
86712
100.776549 1168.098043 1109.703384
38121.5478 34269.9941 35644.5951
115551.213 96005.24991 94925.94041
28577
21481
26321
0
0
0
0
0
0
28577
21481
26321
0
0
0
28577
21481
26321
Net income attributable to
noncontrolling interests
Net income attributable to bank and
noncontrolling interests
Cash dividends
0
0
0
0
16028
0
28577
0
21481
0
26321
0
Sale, conversion, retirement of
capital stock, net
Net operating income
16028
28577
21481
26321
0.26
0.46
0.35
0.42
Earnings per share
15. Appendix 8
Peer Group Analysis
FIRST MIDWEST BANK
UMPQUA BANK
MB FINANCIAL BANK, NA
PRIVATEBANK AND TRUST CO.
NATIONAL PENN BANK
CITIZENS BANK
BANNER BANK
COLUMBIA STATE BANK
UNITED BANKSHARES, INC
Composite Capital
Portfolio
Financials
Commercial
Size
Regional
3.81
4.83
3.54
2.55
4.52 4.29
4.60
3.72
4.33
2.75
2.77
4.93 4.04
4.75
3.70
4.59
2.73
3.03
3.79 4.74
4.62
3.60
4.50
3.04
2.58
4.3 3.80
4.81
3.58
4.81
2.55
3.23
3.43 4.58
3.74
3.52
3.70
2.45
3.14
3.48 4.97
4.44
3.50
4.74
3.44
2.75
4.15 2.17
4.64
3.36
4.91
2.9
2.55
4.26 2.34
4.14
3.48
4.55
3.01
2.99
3.43 3.84
3.91
Peer Group Analysis
FIRST MIDWEST BANK
UMPQUA BANK
MB FINANCIAL BANK, NA
PRIVATEBANK AND TRUST CO.
NATIONAL PENN BANK
CITIZENS BANK
BANNER BANK
COLUMBIA STATE BANK
UNITED BANKSHARES, INC
Weight
11.81%
11.53%
11.46%
11.17%
11.08%
10.90%
10.84%
10.41%
10.78%
P/E
10.23
13.01
12.51
13.64
14.2
9.21
36.04
17.66
15.55
B/V
0.9
1.5
1.1
0.9
1.5
0.8
0.6
1.4
2.5
Ticker
FMBI
UMPQ
MBFI
PVTB
NPBC
CRBC
BANR
COLB
UBSI
Appendix 9
Regional Outlook
Sterling
Banner
Citizens Bank
Columbia
First Midwest
Santa Barbara
Umpqua
Susquehanna
Iberia
MB Financial
National Penn
Private Bank
United Bank
GDP Growth
Unemployment
Ranking
2.06%
9.47%
2.04%
8.78%
4.64
2.76%
9.90%
4.44
2.78%
8.47%
4.14
1.90%
10.10%
4.60
1.80%
11.30%
3.95
2.48%
9.55%
4.75
2.92%
7.81%
3.74
2.23%
8.10%
4.23
1.91%
10.08%
4.62
3.00%
7.89%
3.74
1.94%
9.73%
4.81
3.34%
8.57%
3.91
State
IL
OR
IL
IL
PA
MI
WA
WA
VA
Avg. Assets
Net Income
8,033,595
50,245
11,597,279
58,125
9,884,447
20,483
12,329,198
51,821
8,575,566
71,045
9,429,809
-3,053
4,069,828
2,173
4,385,387
34,361
7,192,199
53,274
16. Appendix 10
Financial Comparison Ratings
Sterling/FIB
Wght
United
Score Banner Score Columbia
Score
Earnings and Profitability
Percent of Average Assets:
+ Noninterest Income
0.89
- Noninterest Expense
3.61
- Provision: Loan & Lease Losses
0.31
10%
10%
10%
10%
10%
10%
97.29
10%
Interest Income (TE)
4.51
- Interest Expense
1.07
Net Interest Income (TE)
3.44
0.23
0.91
0.62
1.00
0.96
0.64
0.75
4.65
0.73
3.93
0.32
3.23
0.95
0.97
0.69
0.88
0.36
0.90
0.33
5.53
0.36
5.18
1.21
4.70
0.15
0.82
0.34
0.66
0.73
0.77
0.49
90.34
0.93
93.66
0.96
86.14
0.89
79.88
0.96
72.05
0.93
78.16
0.99
4.11
0.66
3.46
0.85
2.32
Margin Analysis:
Avg Earning Assets to Avg Assets
Avg Int-Bearing Funds to Avg
Assets
77.07
Loan & Lease Analysis:
4.74
10%
1.36
0.29
2.51
0.53
6.00
0.79
Liquidity
Net Non Core Fund Dep New
$250M
21.60
5.64
Net Loans & Leases to Assets
61.42
10%
10%
70.03
0.26
0.88
6.27
72.54
0.29
0.85
0.31
58.43
0.01
0.95
10.01
0.91
11.60
0.95
11.21
0.98
-Total
Capitalization
Tier One Leverage Capital
11
2.99
4.55
Comparison Score
Capital Score
Financial Comparison Ratings
Sterling/FIB
Wght
PVTB
Score
2.75
4.74
Umpqua
Score
2.55
4.91
MBFI
Score
Earnings and Profitability
Percent of Average Assets:
+ Noninterest Income
0.89
- Noninterest Expense
3.61
- Provision: Loan & Lease Losses
0.31
10%
10%
10%
10%
10%
10%
97.29
10%
Interest Income (TE)
4.51
- Interest Expense
1.07
Net Interest Income (TE)
3.44
3.93
0.49
3.45
0.54
2.07
1.10
0.87
0.46
1.00
0.61
0.57
0.28
4.42
0.61
3.81
0.41
2.64
0.63
0.98
0.57
0.90
0.46
0.73
0.49
4.02
0.59
3.43
1.54
3.09
1.51
0.89
0.55
1.00
0.58
0.86
0.20
96.33
0.99
88.57
0.91
87.55
0.90
89.00
0.87
82.01
0.94
80.37
0.96
Margin Analysis:
Avg Earning Assets to Avg Assets
Avg Int-Bearing Funds to Avg
Assets
77.07
Loan & Lease Analysis:
-Total
Liquidity
Net Non Core Fund Dep New
$250M
4.74
10%
3.63
0.77
2.28
0.48
8.29
0.57
21.60
10%
13.06
0.60
9.46
0.44
13.05
0.60
17. Net Loans & Leases to Assets
61.42
10%
72.89
0.84
55.27
0.90
57.29
0.93
9.89
0.90
9.53
0.87
10.09
0.92
Capitalization
Tier One Leverage Capital
11
2.58
4.50
Comparison Score
Capital Score
Financial Comparison Ratings
Sterling/FIB
Wght
Citizens
Score
2.77
4.33
NPBC
Score
3.03
4.59
FMBI
Score
Earnings and Profitability
Percent of Average Assets:
+ Noninterest Income
0.89
- Noninterest Expense
3.61
- Provision: Loan & Lease Losses
0.31
10%
10%
10%
10%
10%
10%
97.29
10%
Interest Income (TE)
4.51
- Interest Expense
1.07
Net Interest Income (TE)
3.44
4.40
0.97
3.43
0.83
2.84
1.75
0.98
0.91
1.00
0.94
0.79
0.18
4.31
0.94
3.37
1.06
2.58
0.20
0.96
0.88
0.98
0.84
0.72
0.65
4.19
0.39
3.80
1.14
2.90
0.77
0.93
0.37
0.91
0.78
0.80
0.40
95.50
0.98
92.65
0.95
88.91
0.91
86.57
0.89
82.37
0.94
81.37
0.95
Margin Analysis:
Avg Earning Assets to Avg Assets
Avg Int-Bearing Funds to Avg
Assets
77.07
Loan & Lease Analysis:
4.74
10%
2.07
0.44
1.21
0.26
3.91
0.83
Liquidity
Net Non Core Fund Dep New
$250M
21.60
Net Loans & Leases to Assets
61.42
10%
10%
10.87
58.92
0.50
0.96
13.80
58.64
0.64
0.95
-5.88
63.26
-0.27
0.97
8.14
0.74
10.59
0.96
10.63
0.97
-Total
Capitalization
Tier One Leverage Capital
11
3.14
3.70
Comparison Score
Capital Score
Appendix 11
Projected EPS
Target PE Ratio
PE Weight
PE Target Price
Total Target Price
$
$
1.49
13.99
20%
20.85
19.46
Projected Book
Target PBV Ratio
Price BV Weight
BV Target Price
$
15.42
1.24
80%
19.12
3.23
4.81
2.55
4.83
18. Disclosures:
Ownership and material conflicts of interest:
The author(s), or a member of their household, of this report does not hold a financial interest in the securities of this company.
The author(s), or a member of their household, of this report does not know of the existence of any conflicts of interest that might bias the content or
publication of this report.
Receipt of compensation:
Compensation of the author(s) of this report is not based on investment banking revenue.
Position as a officer or director:
The author(s), or a member of their household, does not serve as an officer, director or advisory board member of the subject company.
Market making:
The author(s) does not act as a market maker in the subject company’s securities.
Ratings guide:
Banks rate companies as either a BUY, HOLD or SELL. A BUY rating is given when the security is expected to deliver absolute returns of 15% or greater
over the next twelve month period, and recommends that investors take a position above the security’s weight in the S&P 500, or any other relevant index.
A SELL rating is given when the security is expected to deliver negative returns over the next twelve months, while a HOLD rating implies flat returns over
the next twelve months.
Disclaimer:
The information set forth herein has been obtained or derived from sources generally available to the public and believed by the author(s) to be reliable, but
the author(s) does not make any representation or warranty, express or implied, as to its accuracy or completeness. The information is not intended to be used
as the basis of any investment decisions by any person or entity. This information does not constitute investment advice, nor is it an offer or a solicitation of
an offer to buy or sell any security. This report should not be considered to be a recommendation by any individual affiliated with [Society Name], CFA
Institute or the CFA Institute Research Challenge with regard to this company’s stock.