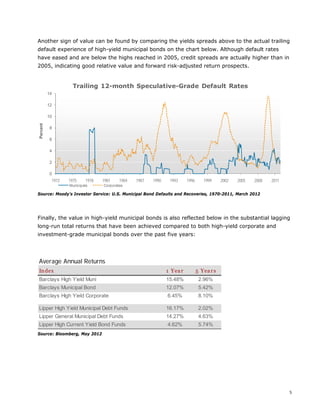
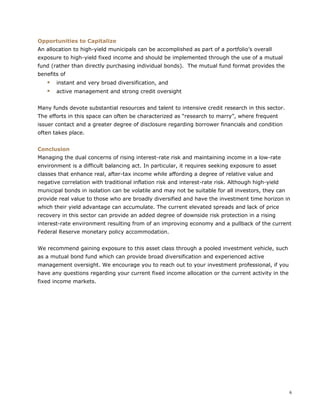
1
Fixed Income Update
The Case for High-Yield Municipal Bonds
Anthony Tanner, CFA®
, Senior Investment Manager May 29, 2012
Barkha Punjabi, CFA®
, Investment Manager
After several years, most fixed income investors don’t need to be reminded that bond yields are
at historically low levels. The Federal Reserve’s unusually accommodative monetary policy, now
in its third year, is the primary driver of this record low interest-rate environment. Its policy is
reflected in the current Federal Funds rate, manifesting itself in record low yields across the
investment-grade bond spectrum. This policy strategy has affected tax-exempt and taxable
sectors alike, leaving fixed-income investors few options to preserve purchasing power over the
longer term. Eventually, this monetary policy accommodation will be removed and the Fed
Funds rate will rise—most likely when the economy has gained sufficient strength such that it
no longer needs nearly-free money to sustain it.
In this uncertain market environment, bond investors need to identify fixed-income sectors
that:
 offer some degree of insulation from rising interest rates and
 provide a sufficient amount of current income to cushion potential price declines
Diversifying fixed income assets with an allocation in sectors with these features can offer a
degree of insulation from rising rates. We believe that high-yield municipal bonds may offer
that advantage. In this Fixed Income Update, we examine the composition of this less-
transparent and often misunderstood fixed-income sector, the nature of its return and risk
attributes and then discuss how high-yield municipal bonds can enhance the risk-adjusted total
return prospects of a bond portfolio.
Basics of High-Yield Municipal Bonds
What are high-yield municipal bonds comprised of? As of 2011, the municipal bond market has
grown to approximately $3.75 trillion, with the high-yield sector comprising a relatively small
subset of that market—about 10 percent. Despite its relatively small size, the high-yield
municipal bond sector is comprised of a much greater breadth of borrower than most investors
may be aware of. It is a highly diversified landscape in terms of the number of issues,
purposes, investment quality and geographic locations that it encompasses.
What are the primary types of high-yield municipal bonds? Many unrated or non-investment
grade municipal bond issuers fall into two categories:
2
Non Profit / Civic Organizations—besides better known sectors such as healthcare and
education, this sector includes local charitable organizations and human services
providers (which can encompass a broad range of service mandates). Consider one of
the larger established charities in your own community that has been around for 25 or
more years. There’s a good chance some of the financing for the buildings and facilities
in which they operate was accomplished through a small municipal bond issue.
Private activity issuers—small, profit-making businesses that are qualified to borrow
money with a tax-exempt bond issued through a local industrial development agency-
and choose to do so rather than obtaining a traditional loan from a bank. Private activity
issuers tend to be well-established business concerns with stable business lines,
recurring revenues, and consistent operating histories.
Ratings
Unlike high-yield corporate bonds, an important distinction of their high-yield counterparts in
the municipal bond market is that over half of these bonds are issued without a rating. This is
an important distinction because many financial solvent, credit-worthy issuers often choose to
forego obtaining a rating on their bond issues. By saving the cost of fees typically paid to the
rating agencies to obtain a credit rating, issuers can often attain a lower overall financing cost
through an unrated issue.
0
5
10
15
20
25
Aaa Aa1 Aa2 Aa3 A1 A2 A3 Baa1 Baa2 Baa3 Ba1 Ba2 Ba3 B1 B2 B3 Caa1 Caa2 Caa3 Ca C
Percent
Ratings Distributions: Municipals vs. Corporates
Year End 2011
Municipals Corporates
Moody’s Investor Service: U.S. Municipal Bond Defaults and Recoveries, 1970-2011, March 2012
The table above illustrates that only about three percent of rated municipal bonds actually
receive a rating below investment grade, whereas almost one-third of the corporate bond
market is rated BB or lower.
3
Municipal bonds have significantly lower default rates than corporate bonds. Across the entire
municipal bond universe, the actual default experience has historically been quite low. The table
below compares the cumulative 10-year default rate of both municipal and corporate bonds:
Moody's Average Cumulative 10-Year Default Rate 1970-2011
Munis Corporates
All Investment Grade 0.08% 2.61%
All Speculative Grade 7.94% 33.69%
All Rated 0.13% 11.17%
Average Principal Recovery 65% 49%
Source: Moody’s Investor Service: U.S. Municipal Bond Defaults and Recoveries, 1970-2011, March 2012
Even after the 2008 financial crisis, default rates for municipal bonds remain substantially lower
than those for equivalent-rated corporate bonds, and principal recovery for those municipals
who default is higher. Despite a dire outlook, defaults (i.e. bonds that missed payments) in the
municipal bond market actually declined by 44 percent from $4.3 billion in par value in 2010 to
$2.4 billion in 2011. This represents 0.065 percent of all municipal bonds outstanding.1
Looking
at only the speculative municipal sector during the credit crisis, the average one-year default
rate for the period starting in 2008 increased only to 2.1 percent, from an average of 1.2
percent for the period 1970-2011.2
While we do acknowledge portions of the high-yield municipal bond sector remain highly
susceptible to credit volatility, we believe investing through a mutual fund vehicle allows access
to active management and a large and diversified portfolio, mitigating some of these risks.
Low Correlation to other Asset Classes
High-yield municipal bonds have correlation characteristics that can actually help improve fixed
income portfolio diversification and reduce interest rate risk. High-yield municipal bonds have
had historically low correlations to U.S. and international equities. Due to the unique credit risks
in each of the segments, correlation between high-yield municipal bonds and corporate bonds is
also low. Overall both sectors have a lower sensitivity to changes in interest rates, unlike
Treasurys and investment-grade corporate bonds.
What is very surprising about high-yield municipal bonds as an asset class is that, unlike
traditional fixed-rate investment-grade bonds, they have actually exhibited positive correlation
with inflation. This reflects the fact that in some previous inflationary (rising interest rate /
falling bond price) periods, high-yield municipal bonds actually appreciated in value.
This unusual positive correlation to rising inflation rates can create a significant risk-reduction
benefit when this asset class is added to an existing investment-grade bond portfolio.
1
Source: BofA Merrill Lynch Study, 2012, Nuveen Investments.
2
Source: Moody’s Investor Service: U.S. Municipal Bond Defaults and Recoveries, 1970-2011, March 2012.
4
Morningstar Fund Classes - 15 Year Correlation to Inflation 1995-2010
Fu nds Correlation
High Yield Muni +0.21
TIPS +0.11
Intermediate Bond -0.06
Long Term Bond -0.18
Source: DWS, Morningstar as of 12/31/10
Today’s Value in High-Yield Municipal Bonds
Since peaking after the last round of Fed Funds increases in summer of 2006, investment-
grade bond yields have dropped steadily (and prices have risen) significantly. As a result yields
throughout the investment-grade municipal spectrum and most taxable bond sectors are now
at all time lows. The one fixed income asset class that has not participated to the same degree
has been high-yield municipal bonds. This can be attributed to the continued wide level of credit
spreads in the high-yield municipal market, which are primarily the result of market yields
which remain above (and prices that remain below) pre-credit crisis levels.
The high-yield municipal bond sector has participated in the broad municipal bond market rally
of the past year with the Barclays Capital High Yield Muni Index returning 5.4 percent in the
first quarter and 15.48 percent in the last twelve months. Even with this strong showing,
current high-yield municipal spreads remain not only attractively above long run averages, but
are triple the lows reached in mid-2007 at the peak of the last economic recovery (and Federal
Reserve tightening cycle).
0
100
200
300
400
500
600
700
1995 1996 1998 1999 2000 2001 2002 2003 2005 2006 2007 2008 2009 2010 2012
BasisPoints
High Yield Municipal Index Spread to
Investment Grade Municipal Index
Yield Spread
3/31/12 Spread = 372 bpsAvg: 274 bps
Min: 113 bps
Max: 636 bps
Std Dev: 110 bps
Source: Barclays, Municipal Indices Monthly, April 2012
5
Another sign of value can be found by comparing the yields spreads above to the actual trailing
default experience of high-yield municipal bonds on the chart below. Although default rates
have eased and are below the highs reached in 2005, credit spreads are actually higher than in
2005, indicating good relative value and forward risk-adjusted return prospects.
0
2
4
6
8
10
12
14
1972 1975 1978 1981 1984 1987 1990 1993 1996 1999 2002 2005 2008 2011
Percent
Trailing 12-month Speculative-Grade Default Rates
Municipals Corporates
Source: Moody’s Investor Service: U.S. Municipal Bond Defaults and Recoveries, 1970-2011, March 2012
Finally, the value in high-yield municipal bonds is also reflected below in the substantial lagging
long-run total returns that have been achieved compared to both high-yield corporate and
investment-grade municipal bonds over the past five years:
Average Annual Returns
Index 1 Year 5 Years
Barclays High Yield Muni 15.48% 2.96%
Barclays Municipal Bond 12.07% 5.42%
Barclays High Yield Corporate 6.45% 8.10%
Lipper High Yield Municipal Debt Funds 16.17% 2.02%
Lipper General Municipal Debt Funds 14.27% 4.63%
Lipper High Current Yield Bond Funds 4.62% 5.74%
Source: Bloomberg, May 2012
6
Opportunities to Capitalize
An allocation to high-yield municipals can be accomplished as part of a portfolio’s overall
exposure to high-yield fixed income and should be implemented through the use of a mutual
fund (rather than directly purchasing individual bonds). The mutual fund format provides the
benefits of
 instant and very broad diversification, and
 active management and strong credit oversight
Many funds devote substantial resources and talent to intensive credit research in this sector.
The efforts in this space can often be characterized as “research to marry”, where frequent
issuer contact and a greater degree of disclosure regarding borrower financials and condition
often takes place.
Conclusion
Managing the dual concerns of rising interest-rate risk and maintaining income in a low-rate
environment is a difficult balancing act. In particular, it requires seeking exposure to asset
classes that enhance real, after-tax income while affording a degree of relative value and
negative correlation with traditional inflation risk and interest-rate risk. Although high-yield
municipal bonds in isolation can be volatile and may not be suitable for all investors, they can
provide real value to those who are broadly diversified and have the investment time horizon in
which their yield advantage can accumulate. The current elevated spreads and lack of price
recovery in this sector can provide an added degree of downside risk protection in a rising
interest-rate environment resulting from of an improving economy and a pullback of the current
Federal Reserve monetary policy accommodation.
We recommend gaining exposure to this asset class through a pooled investment vehicle, such
as a mutual bond fund which can provide broad diversification and experienced active
management oversight. We encourage you to reach out to your investment professional, if you
have any questions regarding your current fixed income allocation or the current activity in the
fixed income markets.
7
Disclosures
Wells Fargo Wealth Management provides products and services through Wells Fargo Bank, N.A. and its various
affiliates and subsidiaries.
The information and opinions in this report were prepared by Wells Fargo Wealth Management. Information and
opinions have been obtained or derived from sources we consider reliable, but we cannot guarantee their accuracy or
completeness. Opinions represent Wells Fargo Wealth Management’s opinion as of the date of this report and are for
general information purposes only. Wells Fargo Wealth Management does not undertake to advise you of any change in
its opinions or the information contained in this report. Wells Fargo & Company affiliates may issue reports or have
opinions that are inconsistent with, and reach different conclusions from, this report.
Past performance does not indicate future results. The value or income associated with a security may fluctuate. There
is always the potential for loss as well as gain. Investments discussed in this presentation are not insured by the
Federal Deposit Insurance Corporation and may be unsuitable for some investors depending on their specific
investment objectives and financial position.
Asset allocation and diversification do not assure or guarantee better performance and cannot eliminate the risk of
investment losses. Your individual allocation may be different than the strategic long-term allocation above due to your
unique individual circumstances, but is targeted to be in the allocation ranges detailed. The asset allocation reflected
above may fluctuate based on asset values, portfolio decisions, and account needs.
This report is not an offer to buy or sell or solicitation of an offer to buy or sell any securities mentioned. Wells Fargo &
Company and/or its affiliates or may trade for their own accounts, be on the opposite side of customer orders, or have
a long or short position in the securities mentioned herein.
Wells Fargo & Company and its affiliates do not provide legal advice. Please consult your legal advisors to determine
how this information may apply to your own situation. Whether any planned tax result is realized by you depend on the
specific facts of your situation at the time your tax preparer submits your return.
Fixed income securities are subject to availability and market fluctuation. These securities may be worth less than the
original cost upon redemption. Certain high-yield/high-risk bonds carry particular market risks and may experience
greater volatility in market value than investment grade corporate bonds. Government bonds and Treasury bills are
guaranteed by the U.S. government and, if held to maturity, offer a fixed rate of return and fixed principal value.
Income from municipal securities is generally free from federal taxes and state taxes for residents of the issuing state.
While the interest income is tax-free, capital gains, if any, will be subject to taxes. Income for some investors may be
subject to the federal Alternative Minimum Tax (AMT).
Yields are subject to change with economic conditions. Yield is only one factor that should be considered when making
an investment decision. Treasuries are guaranteed by the U.S. government and, if held to maturity, offer a fixed rate of
return and fixed principal value. Interest income from U.S. Treasury and some government agency securities is
generally subject to federal income taxation, but may be exempt from some state and local taxes. Most federal agency
bonds are not backed by the full faith and credit of the federal government, however, they may offer some type of
guarantee by the issuing agency.
© 2012 Wells Fargo Bank, N.A. All rights reserved.

The Case for High Yield Muni Bonds

  • 1.
    1 Fixed Income Update TheCase for High-Yield Municipal Bonds Anthony Tanner, CFA® , Senior Investment Manager May 29, 2012 Barkha Punjabi, CFA® , Investment Manager After several years, most fixed income investors don’t need to be reminded that bond yields are at historically low levels. The Federal Reserve’s unusually accommodative monetary policy, now in its third year, is the primary driver of this record low interest-rate environment. Its policy is reflected in the current Federal Funds rate, manifesting itself in record low yields across the investment-grade bond spectrum. This policy strategy has affected tax-exempt and taxable sectors alike, leaving fixed-income investors few options to preserve purchasing power over the longer term. Eventually, this monetary policy accommodation will be removed and the Fed Funds rate will rise—most likely when the economy has gained sufficient strength such that it no longer needs nearly-free money to sustain it. In this uncertain market environment, bond investors need to identify fixed-income sectors that:  offer some degree of insulation from rising interest rates and  provide a sufficient amount of current income to cushion potential price declines Diversifying fixed income assets with an allocation in sectors with these features can offer a degree of insulation from rising rates. We believe that high-yield municipal bonds may offer that advantage. In this Fixed Income Update, we examine the composition of this less- transparent and often misunderstood fixed-income sector, the nature of its return and risk attributes and then discuss how high-yield municipal bonds can enhance the risk-adjusted total return prospects of a bond portfolio. Basics of High-Yield Municipal Bonds What are high-yield municipal bonds comprised of? As of 2011, the municipal bond market has grown to approximately $3.75 trillion, with the high-yield sector comprising a relatively small subset of that market—about 10 percent. Despite its relatively small size, the high-yield municipal bond sector is comprised of a much greater breadth of borrower than most investors may be aware of. It is a highly diversified landscape in terms of the number of issues, purposes, investment quality and geographic locations that it encompasses. What are the primary types of high-yield municipal bonds? Many unrated or non-investment grade municipal bond issuers fall into two categories:
  • 2.
    2 Non Profit /Civic Organizations—besides better known sectors such as healthcare and education, this sector includes local charitable organizations and human services providers (which can encompass a broad range of service mandates). Consider one of the larger established charities in your own community that has been around for 25 or more years. There’s a good chance some of the financing for the buildings and facilities in which they operate was accomplished through a small municipal bond issue. Private activity issuers—small, profit-making businesses that are qualified to borrow money with a tax-exempt bond issued through a local industrial development agency- and choose to do so rather than obtaining a traditional loan from a bank. Private activity issuers tend to be well-established business concerns with stable business lines, recurring revenues, and consistent operating histories. Ratings Unlike high-yield corporate bonds, an important distinction of their high-yield counterparts in the municipal bond market is that over half of these bonds are issued without a rating. This is an important distinction because many financial solvent, credit-worthy issuers often choose to forego obtaining a rating on their bond issues. By saving the cost of fees typically paid to the rating agencies to obtain a credit rating, issuers can often attain a lower overall financing cost through an unrated issue. 0 5 10 15 20 25 Aaa Aa1 Aa2 Aa3 A1 A2 A3 Baa1 Baa2 Baa3 Ba1 Ba2 Ba3 B1 B2 B3 Caa1 Caa2 Caa3 Ca C Percent Ratings Distributions: Municipals vs. Corporates Year End 2011 Municipals Corporates Moody’s Investor Service: U.S. Municipal Bond Defaults and Recoveries, 1970-2011, March 2012 The table above illustrates that only about three percent of rated municipal bonds actually receive a rating below investment grade, whereas almost one-third of the corporate bond market is rated BB or lower.
  • 3.
    3 Municipal bonds havesignificantly lower default rates than corporate bonds. Across the entire municipal bond universe, the actual default experience has historically been quite low. The table below compares the cumulative 10-year default rate of both municipal and corporate bonds: Moody's Average Cumulative 10-Year Default Rate 1970-2011 Munis Corporates All Investment Grade 0.08% 2.61% All Speculative Grade 7.94% 33.69% All Rated 0.13% 11.17% Average Principal Recovery 65% 49% Source: Moody’s Investor Service: U.S. Municipal Bond Defaults and Recoveries, 1970-2011, March 2012 Even after the 2008 financial crisis, default rates for municipal bonds remain substantially lower than those for equivalent-rated corporate bonds, and principal recovery for those municipals who default is higher. Despite a dire outlook, defaults (i.e. bonds that missed payments) in the municipal bond market actually declined by 44 percent from $4.3 billion in par value in 2010 to $2.4 billion in 2011. This represents 0.065 percent of all municipal bonds outstanding.1 Looking at only the speculative municipal sector during the credit crisis, the average one-year default rate for the period starting in 2008 increased only to 2.1 percent, from an average of 1.2 percent for the period 1970-2011.2 While we do acknowledge portions of the high-yield municipal bond sector remain highly susceptible to credit volatility, we believe investing through a mutual fund vehicle allows access to active management and a large and diversified portfolio, mitigating some of these risks. Low Correlation to other Asset Classes High-yield municipal bonds have correlation characteristics that can actually help improve fixed income portfolio diversification and reduce interest rate risk. High-yield municipal bonds have had historically low correlations to U.S. and international equities. Due to the unique credit risks in each of the segments, correlation between high-yield municipal bonds and corporate bonds is also low. Overall both sectors have a lower sensitivity to changes in interest rates, unlike Treasurys and investment-grade corporate bonds. What is very surprising about high-yield municipal bonds as an asset class is that, unlike traditional fixed-rate investment-grade bonds, they have actually exhibited positive correlation with inflation. This reflects the fact that in some previous inflationary (rising interest rate / falling bond price) periods, high-yield municipal bonds actually appreciated in value. This unusual positive correlation to rising inflation rates can create a significant risk-reduction benefit when this asset class is added to an existing investment-grade bond portfolio. 1 Source: BofA Merrill Lynch Study, 2012, Nuveen Investments. 2 Source: Moody’s Investor Service: U.S. Municipal Bond Defaults and Recoveries, 1970-2011, March 2012.
  • 4.
    4 Morningstar Fund Classes- 15 Year Correlation to Inflation 1995-2010 Fu nds Correlation High Yield Muni +0.21 TIPS +0.11 Intermediate Bond -0.06 Long Term Bond -0.18 Source: DWS, Morningstar as of 12/31/10 Today’s Value in High-Yield Municipal Bonds Since peaking after the last round of Fed Funds increases in summer of 2006, investment- grade bond yields have dropped steadily (and prices have risen) significantly. As a result yields throughout the investment-grade municipal spectrum and most taxable bond sectors are now at all time lows. The one fixed income asset class that has not participated to the same degree has been high-yield municipal bonds. This can be attributed to the continued wide level of credit spreads in the high-yield municipal market, which are primarily the result of market yields which remain above (and prices that remain below) pre-credit crisis levels. The high-yield municipal bond sector has participated in the broad municipal bond market rally of the past year with the Barclays Capital High Yield Muni Index returning 5.4 percent in the first quarter and 15.48 percent in the last twelve months. Even with this strong showing, current high-yield municipal spreads remain not only attractively above long run averages, but are triple the lows reached in mid-2007 at the peak of the last economic recovery (and Federal Reserve tightening cycle). 0 100 200 300 400 500 600 700 1995 1996 1998 1999 2000 2001 2002 2003 2005 2006 2007 2008 2009 2010 2012 BasisPoints High Yield Municipal Index Spread to Investment Grade Municipal Index Yield Spread 3/31/12 Spread = 372 bpsAvg: 274 bps Min: 113 bps Max: 636 bps Std Dev: 110 bps Source: Barclays, Municipal Indices Monthly, April 2012
  • 5.
    5 Another sign ofvalue can be found by comparing the yields spreads above to the actual trailing default experience of high-yield municipal bonds on the chart below. Although default rates have eased and are below the highs reached in 2005, credit spreads are actually higher than in 2005, indicating good relative value and forward risk-adjusted return prospects. 0 2 4 6 8 10 12 14 1972 1975 1978 1981 1984 1987 1990 1993 1996 1999 2002 2005 2008 2011 Percent Trailing 12-month Speculative-Grade Default Rates Municipals Corporates Source: Moody’s Investor Service: U.S. Municipal Bond Defaults and Recoveries, 1970-2011, March 2012 Finally, the value in high-yield municipal bonds is also reflected below in the substantial lagging long-run total returns that have been achieved compared to both high-yield corporate and investment-grade municipal bonds over the past five years: Average Annual Returns Index 1 Year 5 Years Barclays High Yield Muni 15.48% 2.96% Barclays Municipal Bond 12.07% 5.42% Barclays High Yield Corporate 6.45% 8.10% Lipper High Yield Municipal Debt Funds 16.17% 2.02% Lipper General Municipal Debt Funds 14.27% 4.63% Lipper High Current Yield Bond Funds 4.62% 5.74% Source: Bloomberg, May 2012
  • 6.
    6 Opportunities to Capitalize Anallocation to high-yield municipals can be accomplished as part of a portfolio’s overall exposure to high-yield fixed income and should be implemented through the use of a mutual fund (rather than directly purchasing individual bonds). The mutual fund format provides the benefits of  instant and very broad diversification, and  active management and strong credit oversight Many funds devote substantial resources and talent to intensive credit research in this sector. The efforts in this space can often be characterized as “research to marry”, where frequent issuer contact and a greater degree of disclosure regarding borrower financials and condition often takes place. Conclusion Managing the dual concerns of rising interest-rate risk and maintaining income in a low-rate environment is a difficult balancing act. In particular, it requires seeking exposure to asset classes that enhance real, after-tax income while affording a degree of relative value and negative correlation with traditional inflation risk and interest-rate risk. Although high-yield municipal bonds in isolation can be volatile and may not be suitable for all investors, they can provide real value to those who are broadly diversified and have the investment time horizon in which their yield advantage can accumulate. The current elevated spreads and lack of price recovery in this sector can provide an added degree of downside risk protection in a rising interest-rate environment resulting from of an improving economy and a pullback of the current Federal Reserve monetary policy accommodation. We recommend gaining exposure to this asset class through a pooled investment vehicle, such as a mutual bond fund which can provide broad diversification and experienced active management oversight. We encourage you to reach out to your investment professional, if you have any questions regarding your current fixed income allocation or the current activity in the fixed income markets.
  • 7.
    7 Disclosures Wells Fargo WealthManagement provides products and services through Wells Fargo Bank, N.A. and its various affiliates and subsidiaries. The information and opinions in this report were prepared by Wells Fargo Wealth Management. Information and opinions have been obtained or derived from sources we consider reliable, but we cannot guarantee their accuracy or completeness. Opinions represent Wells Fargo Wealth Management’s opinion as of the date of this report and are for general information purposes only. Wells Fargo Wealth Management does not undertake to advise you of any change in its opinions or the information contained in this report. Wells Fargo & Company affiliates may issue reports or have opinions that are inconsistent with, and reach different conclusions from, this report. Past performance does not indicate future results. The value or income associated with a security may fluctuate. There is always the potential for loss as well as gain. Investments discussed in this presentation are not insured by the Federal Deposit Insurance Corporation and may be unsuitable for some investors depending on their specific investment objectives and financial position. Asset allocation and diversification do not assure or guarantee better performance and cannot eliminate the risk of investment losses. Your individual allocation may be different than the strategic long-term allocation above due to your unique individual circumstances, but is targeted to be in the allocation ranges detailed. The asset allocation reflected above may fluctuate based on asset values, portfolio decisions, and account needs. This report is not an offer to buy or sell or solicitation of an offer to buy or sell any securities mentioned. Wells Fargo & Company and/or its affiliates or may trade for their own accounts, be on the opposite side of customer orders, or have a long or short position in the securities mentioned herein. Wells Fargo & Company and its affiliates do not provide legal advice. Please consult your legal advisors to determine how this information may apply to your own situation. Whether any planned tax result is realized by you depend on the specific facts of your situation at the time your tax preparer submits your return. Fixed income securities are subject to availability and market fluctuation. These securities may be worth less than the original cost upon redemption. Certain high-yield/high-risk bonds carry particular market risks and may experience greater volatility in market value than investment grade corporate bonds. Government bonds and Treasury bills are guaranteed by the U.S. government and, if held to maturity, offer a fixed rate of return and fixed principal value. Income from municipal securities is generally free from federal taxes and state taxes for residents of the issuing state. While the interest income is tax-free, capital gains, if any, will be subject to taxes. Income for some investors may be subject to the federal Alternative Minimum Tax (AMT). Yields are subject to change with economic conditions. Yield is only one factor that should be considered when making an investment decision. Treasuries are guaranteed by the U.S. government and, if held to maturity, offer a fixed rate of return and fixed principal value. Interest income from U.S. Treasury and some government agency securities is generally subject to federal income taxation, but may be exempt from some state and local taxes. Most federal agency bonds are not backed by the full faith and credit of the federal government, however, they may offer some type of guarantee by the issuing agency. © 2012 Wells Fargo Bank, N.A. All rights reserved.