This document presents the design of a pre-stressed concrete bridge between Interstate Highway 10 and State Highway 99 in Texas to improve traffic flow. The design includes pre-stressed concrete girders, concrete deck slabs, and abutments following AASHTO specifications. In addition to the structural design, the document discusses project management aspects such as scheduling, cost estimation, and risk management for the construction of the bridge.


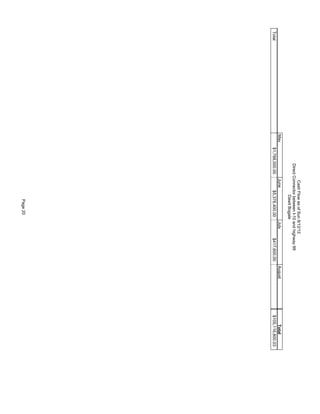
![Prepared by: Dawit Bogale Submitted to: Dave Mukerman
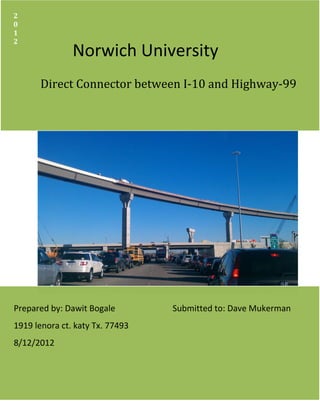
Capstone project 2012
10
1. Introduction
1.1. Background
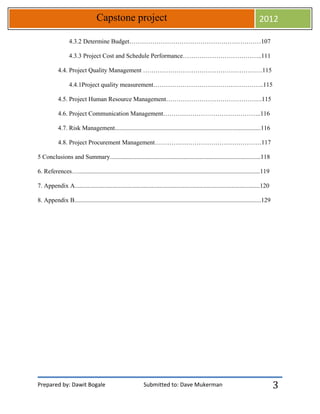
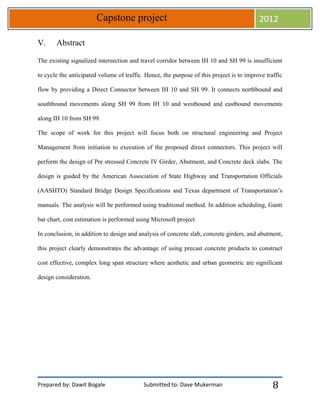
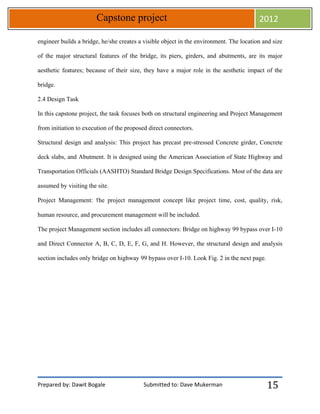
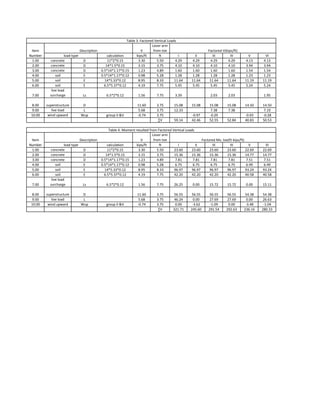
The project is located at the intersection of State Highway (SH) 99 and Interstate Highway (IH)
10 in Harris County, Texas. These two high-speed highways intersect at a grade separated
interchange. The existing frontage roads provide northbound and southbound movements along
SH 99 from IH 10 and westbound and eastbound movements along IH 10 from SH 99. This
project would provide fully directional direct connectors (DCs) between these two facilities in
addition to the existing frontage road system. In order to connect between IH 10 and SH 99,
motorists are required to travel through at grade signalized intersection. The existing signalized
intersection and travel corridor is insufficient to cycle the anticipated volume of traffic. Hence,
there is a delay and interrupted connection that reduces local and regional transportation system
mobility [8]. Highway 99 N
I-10 W I-10 E
Highway 99 S
Fig. 1 Project Location](https://image.slidesharecdn.com/3f2a44db-1d80-49e7-ae93-9cce7e06d379-150402132200-conversion-gate01/85/Capstone-project-11-320.jpg)
![Prepared by: Dawit Bogale Submitted to: Dave Mukerman
Capstone project 2012
14
removes a number of design limitations conventional concrete places on span and load and
permits the building of bridges with longer unsupported spans. This allows designing and
building lighter and shallower concrete structures without sacrificing strength. [2]
Pre-stressed concrete structure can be produced through pre-tensioning or post-tensioning. In
pre-tensioning, the steel is stretched before the concrete is placed. High-strength steel tendons
are placed between two abutments and stretched to percentage required of their ultimate strength.
Concrete is poured into molds around the tendons and allowed to cure. Once the concrete reaches
the required strength, the stretching forces are released. As the steel reacts to regain its original
length, the tensile stresses are translated into a compressive stress in the concrete. In post-
tensioning, the steel is stretched after the concrete hardens. Concrete is cast around, but not in
contact with steel. In many cases, ducts are formed in the concrete unit using thin walled steel
forms. Once the concrete has hardened to the required strength, the steel tendons are inserted and
stretched against the ends of the unit and anchored off externally, placing the concrete into
compression. [2]
2.3 Importance of Bridges in Archtecture
The fact that bridges last many generations and become symbols of a particular city makes them
special for their designers and users. During the design, sizes and aesthetic appearance are
chosen carefully because it shows the culture of the time and the ambition of the civilizations
which built them. Bridges have a significant place in human civilization. Hence, the design of
bridge is not as easy as the design of an ordinary structure. The success of the bridge comes not
only with its function but its visual beauty. Bridges are highly visible elements in city life. The
function, stability, stiffness and strength were the primary concerns of the designer. However,
with the advancement of civilization, aesthetic parameters started to be considered. When an](https://image.slidesharecdn.com/3f2a44db-1d80-49e7-ae93-9cce7e06d379-150402132200-conversion-gate01/85/Capstone-project-15-320.jpg)
![Prepared by: Dawit Bogale Submitted to: Dave Mukerman
Capstone project 2012
18
3. Structural Analysis and Design of pre-stressed concrete Bridges
3.1. Bridge Loading
The design of any component of bridge is based on a set of loading conditions which the
component must withstand. The various types of loading which need to be considered can
broadly be classified as permanent, or temporary.[1] Permanent loads are those due to the weight
of the structure itself and of any other immovable loads that are constant in magnitude and
permanently attached to the structure. They act on the bridge throughout its life. Temporary
loads are those loads that vary in position and magnitude and act on the bridge for short period of
time such as live loads, wind loads and water loads etc. [4]. Some of these are:
1. Permanent loads
dead load of structure
superimposed dead loads
2. Temporary loads
vehicular live loads
pedestrian live loads
impact loads
wind loads
earth quake loads
In order to form a consistent basis for design, AASHTO has developed a set of standard loading
condition, which is taken in to account while designing a bridge. These loads are factored and
combined to produce extreme adverse effect on the member being designed.](https://image.slidesharecdn.com/3f2a44db-1d80-49e7-ae93-9cce7e06d379-150402132200-conversion-gate01/85/Capstone-project-19-320.jpg)
![Prepared by: Dawit Bogale Submitted to: Dave Mukerman
Capstone project 2012
19
3.1.1 Dead Load
The dead load from superstructure is the aggregate weight of all structural elements and
nonstructural parts of the bridge above the bearing. This would include the main supporting
girders, the deck, parapets and road surfacing. The dead load from substructure is the weight of
all structural elements of the bridge between the lowest levels of the structure till the bearing.
This would include the abutment, foundation, and pier.
3.1.2 Live Loads
The live load for bridges means a load that moves along the length of the span that consists of
the weight of the applied moving load of vehicles and pedestrians. The traffic over a highway
bridge consists of a multitude of different types of vehicles. To form a consistent basis for
design, standard loading conditions are applied to the design model of structure. These standard
loadings are specified in Standard specification of American Association of State Highway and
transportation Officials (AASHTO).
The highway live loadings on bridge consist of standard trucks or lane loads that are equivalent
to truck trains. Two systems of loading are provided: H-loading and HS loading. The number
after H or HS indicates the gross weight in tons of the truck or tractor. The design truck is
designated as HS 25 consisting of 10 kip front axle and two 40 kip rear axles. The design
tandem consists of a pair of 32-kip axles spaced 4 ft. apart. However, for spans longer than 40 ft.
the tandem loading do not govern, thus only the truck load is investigated [1].
The lane load consists of a load of 0.8klf uniformly distributed in the longitudinal direction. The
design of the deck slab is based on HS 25 loading; hence, 20 kip wheel load will govern the
design.](https://image.slidesharecdn.com/3f2a44db-1d80-49e7-ae93-9cce7e06d379-150402132200-conversion-gate01/85/Capstone-project-20-320.jpg)
![Prepared by: Dawit Bogale Submitted to: Dave Mukerman
Capstone project 2012
20
3.1.3 Dynamic Load Allowance (Impact)
The truckloads on bridges are applied not gently and gradually but rather violently, causing
stress increase. In order to account the dynamic effect of sudden loading of vehicle on to a bridge
structure, additional loads called impact loads must be considered. These are taken into account
by increasing the static effects of design truck or tandem, with the exceptions of centrifugal and
breaking forces, by the Dynamic Load Allowance. The factor to be applied to the static load shall
be taken as: (1 + IM/100). The dynamic load allowance shall not be applied to pedestrian loads
or to the design lane load. [3]
3.1.4 Wind Load
Wind forces are extremely complicated, but through a series of simplifications are reduced to an
equivalent static force applied uniformly over the exposed faces of the bridge (both super and
sub-structures) that are perpendicular to the longitudinal axis. AASHTO specifies that the
assumed wind velocity should be 100 mph. For a common slab-on-stringer bridge this is usually
a pressure of 50psf, and a minimum of 300p/lf. These forces are applied at the center of gravity
of the exposed regions of the structure.
AASHTO recommends the following for common slab-on-stringer bridges:
1) Wind force on structures (W): a) transverse loading = 50psf b) longitudinal loading = 12psf
2) Wind force on live load (WL): a) transverse loading = 100psf b) longitudinal loading = 40psf
The transverse and longitudinal loads are placed simultaneously for both the structure and the
live load (AASHTO 3.15.2.1.3).
For the usual girder having span lengths less than 125ft, the transverse wind loading on the
superstructure can be taken as 50lbf/ft2, and the longitudinal wind loading can be taken as
12lbf/ft2. [AASHTO 3.15.2.1.3]](https://image.slidesharecdn.com/3f2a44db-1d80-49e7-ae93-9cce7e06d379-150402132200-conversion-gate01/85/Capstone-project-21-320.jpg)
![Prepared by: Dawit Bogale Submitted to: Dave Mukerman
Capstone project 2012
21
Wind forces are resisted by the bracing systems for a through bridge. The bracing systems are
neither analyzed nor designed in this thesis since the load is considered insignificant.
3.1.5 Earthquake Loading
When earthquakes occur, bridges can be subject to large lateral displacements from the ground
movement at the base of the structure. In many areas of the United States, the risk of earthquakes
is low. Since city of Houston lies not within the seismic zone, the risk of earthquakes is less.
Bridge earthquake loads depend on a number of factors, including the earthquake magnitude, the
seismic response of soil at the site, and the dynamic response characteristics (stiffness and
weight distribution) of the structure. Hence, it can be ignored for this capstone project.
3.1.6 Earth Pressure
In this capstone project, earth pressure is the lateral pressure generated by fill material acting on
abutments. The magnitude of earth pressure depends on the physical properties of the soil, the
interaction at the soil-structure interface, and the deformations in the soil-structure system. From
AASHTO 5.5.2, an equivalent fluid weight of 35lb/ft3 is more commonly used (sandy backfill
with a unit weight of approximately 120lb/ft3). The earth pressure acting on abutment is
increased when vehicle live loads occur in the vicinity of the structure. When vehicle traffic can
come within a horizontal distance from the top of a retaining structure equal to one-half its
height, a live load surcharge of 2 feet of fill is added to compensate for vehicle loads (AASHTO
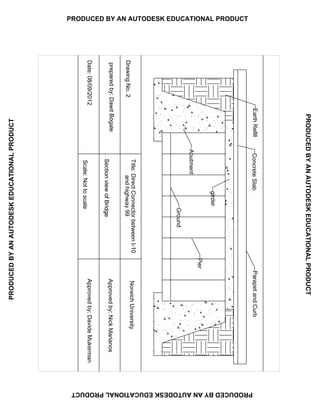
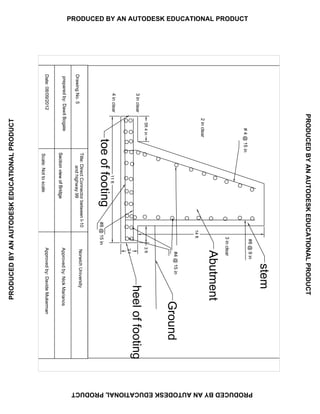
3.20.3). The resulting load distribution on the structure is trapezoidal is as shown in drawing no.
10. [1]](https://image.slidesharecdn.com/3f2a44db-1d80-49e7-ae93-9cce7e06d379-150402132200-conversion-gate01/85/Capstone-project-22-320.jpg)
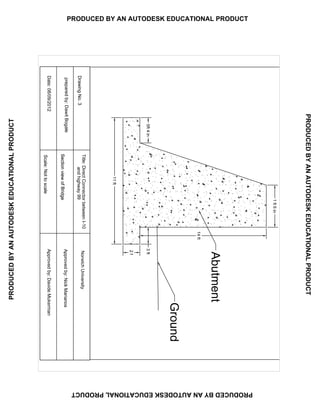
![Prepared by: Dawit Bogale Submitted to: Dave Mukerman
Capstone project 2012
24
3.2.1. Super-structure Analysis and Design
DESIGN PARAMETERS
The bridge considered for this design has a span length of 80 ft. (center-to-center (c/c) pier
distance), a total width of 42 ft. and total roadway width of 39 ft. The bridge superstructure
consists of slab design, five AASHTO IV Girders spaced 9 ft. center-to-center, designed to act
compositely with 9 in. thick cast-in-place (CIP) concrete deck. The wearing surface thickness is
0.5 in., which includes the thickness of any future wearing surface.
3.2.1.1 Slab Analysis and Design
The overall width of the bridge is 42ft. The clear road way width is 39ft. The road way is a
concrete slab 9 in thick, with a concrete strength of fc’=4 kips/in2 and steel reinforcement equal
to Fy= 60 kips/in2. The top width of girder spaced 9 ft. apart is 20 in. The future wearing surface
is 0.03 kips/ft3.
Determine the effective slab span length:
The effective slab span length S is the clear span plus one half the stringer top widths
[AASHTO 3.24.1.2(b)] S = 9 ft. + 10/12 ft. =9.83 ft.
Determine minimum thickness of the slab:
[AASHTO Table 8.9.2] tmin = (S+10)/30 = (9.83+10)/30 *12 in/ft. = 7.9 in
Assumed slab thickness is t= 7.9 +.5=8.4
Use 9 in](https://image.slidesharecdn.com/3f2a44db-1d80-49e7-ae93-9cce7e06d379-150402132200-conversion-gate01/85/Capstone-project-25-320.jpg)
![Prepared by: Dawit Bogale Submitted to: Dave Mukerman
Capstone project 2012
25
Determine factored load
Group loading combinations for load factor design are
[AASHTO Table 3.22.1A] Group I =ɤ*(βD*D + βL(L+I))
= 1.3(1*D+1.67(L+I))
= 1.3D + 2.17(L+I)
Determine the factored dead loads
WD= 1.3(deck slab + FWS)
= 1.3(9in*(1/12)*.15kip/ft3
+ 0.03kip/ft2
)
= 0.185kip/ft2
WD = 0.185kip/ft per foot of width of slab
WC+P = 1.3(curb and parapet)
= 1.3*3.37ft2
*(0.15kip/ft3
)
= 0.657 kip/ft.
Determine the factored live plus impact loads.
The design truck is designated as HS 25 consisting of 10 kip front axle and two 40 kip rear axles.
The design tandem consists of a pair of 32-kip axles spaced 4 ft. apart. However, for spans
longer than 40 ft. the tandem loading does not govern, thus only the truck load is investigated.](https://image.slidesharecdn.com/3f2a44db-1d80-49e7-ae93-9cce7e06d379-150402132200-conversion-gate01/85/Capstone-project-26-320.jpg)
![Prepared by: Dawit Bogale Submitted to: Dave Mukerman
Capstone project 2012
26
The lane load consists of a load of 0.8klf uniformly distributed in the longitudinal direction. The
design of the deck slab is based on HS 25 loading; hence, 20 kip wheel load will govern the
design.[1]
[AASHTO 3.8.2] The live load impact is:
I= 50/ (L+125) = 50/ (9ft + 125) = 0.37
The maximum impact load allowed is 0.3.
The factored wheel plus impact load is
PL+I = 2.17(L+I) = 2.17*(20kips + 0.3*20kips) = 56.4 kips
Analyze for factored moment.
For continuous spans, the factored positive and negative dead load moments are assumed to be
MD= (WD S2
)/10 = ((0.185 Kip/ft2
)*(9.83ft)2
)/10
MD =1.79ft-kips/ft. width of slab
Based on AASHTO 3.24.3.1 in slabs continuous over three or more supports, a continuity factor
of 0.8 is applicable. The factored positive and negative live load plus impact moments are:
[AASHTO 3.24.3.1 & Equation 3-15 ] ML+I= O.8*((S+2)/32)*PL+I
= 0.8((9.83+2)/32)*56.4
= 16.68 ft.-kips/ft. width of slab](https://image.slidesharecdn.com/3f2a44db-1d80-49e7-ae93-9cce7e06d379-150402132200-conversion-gate01/85/Capstone-project-27-320.jpg)
![Prepared by: Dawit Bogale Submitted to: Dave Mukerman
Capstone project 2012
27
The total factored positive and negative moments are:
Mu = MD+ML+I
= 1.79ft-kips + 16. 68 ft.-kips
= 18.47 ft.-kips/ft. width of slab
[AASHTO3.24.5.] For cantilever spans, the factored negative dead load moment is;
MD= ((WDS2
)/2) + MC+P*L
AASHTO 3.24.1.2 S= 3ft – (10/12) ft. = 2.17ft
L= 2.17ft-0.66ft = 1.51ft
MD= (((0.185 kips/ft2
)*(2.17ft)2
)/2) +(0.657 kip/ft2
)*1.51ft
= 1.43 ft.-kips/ft. width of slab
[AASHTO 3.24.2.1] The center line of the wheel will be placed 1 ft. from the face of the curb.
[AASHTO 3.24.5] Each wheel on the slab perpendicular to traffic is distributed over a width of
[AASHTO Equation 3.17] E= 0.8X + 2.17 = (0.8*(0.58ft.)) + 2.17 ft. = 2.63 ft.
Where X= distance in feet from wheel load to point of support
X= I [2.17ft. - ((12+2+7+12)/12)] I = 0.58 ft.
[AASHTO 3.24.5.1] The factored negative wheel load plus impact moment is
ML+I = PL+ I(X/E)](https://image.slidesharecdn.com/3f2a44db-1d80-49e7-ae93-9cce7e06d379-150402132200-conversion-gate01/85/Capstone-project-28-320.jpg)
![Prepared by: Dawit Bogale Submitted to: Dave Mukerman
Capstone project 2012
28
= (56.4 kip)*(0.58ft/2.63)
= 12.44ft.-kips/ft. width of slab
The total factored negative moment is
Mu= MD + ML+ I
= 1.43 ft.-kips + 12.44 ft.-kips
= 13.87ft.-kips/ft. width of slab
Due to the short overhang, the live load acting at a distance on one foot from the barrier face
does not act on the overhang. Therefore, this case need not be investigated.
Design for moment
The compressive strength of the concrete at 28 days is f’c = 4000lbf/in2
. The specified minimum
yield point of the steel is Fy = 60000lbf/in2
. Determine the maximum and minimum steel
reinforcement needed.
[AASHTO 8.16.3.1 & 8.16.3.2] The maximum ratio of tension reinforcement is
[AASHTO 8.16.3.1.1] ρ max = 0.75ρb = 0.75* ρb
Where, β =0.85-0.025= 0.825; fc’=4000lbf/in2
[AASHTO 8.16.2.7]
ρb =( (0.85β1fc’)/Fy)*(87000/(87000+Fy) [AASHTO 8.16.3.2.2]
ρb =( (0.85*0.825*4000)/60000)*(87000/(87000+60000)](https://image.slidesharecdn.com/3f2a44db-1d80-49e7-ae93-9cce7e06d379-150402132200-conversion-gate01/85/Capstone-project-29-320.jpg)
![Prepared by: Dawit Bogale Submitted to: Dave Mukerman
Capstone project 2012
29
ρb =0.028
ρ max = 0.75ρb = 0.75*0.028 = 0.021
Determine the areas of positive and negative steel. [AASHTO 8.16.3.2 & Equation 8-16]
ΦMn = ΦAs Fy(d- (⍺/2))
⍺= (As*Fy)/ (0.85*fc’*b)
⍺= (As*60kips/in2
)/ (0.85*4kips/in 2
*12in)
⍺= 1.47*As
Assume No. 7 steel rebar,
d= 9in – 0.5in for integral wearing surface – 2.0 in for cover – 0.44in
d= 6.06in
[AASHTO 8.16.1.2] Φ=0.9 for flexure
Mu= Φ*Mn for continuous spans
Mu= 18.47*12(in/ft.)= Φ*Mn = 0.9*As*(60kips/in2
)*(6.06in-(1.47/2)*As)
221.64= 327.24As - 39.69As2
As2
-8.245*As + 5.584 = 0
As=0.745 in2
/ft. of slab width](https://image.slidesharecdn.com/3f2a44db-1d80-49e7-ae93-9cce7e06d379-150402132200-conversion-gate01/85/Capstone-project-30-320.jpg)
![Prepared by: Dawit Bogale Submitted to: Dave Mukerman
Capstone project 2012
30
Use #7@9in (As= 0.8in2
/ft.)
ρ= As/bd = 0.8in2
/(12in*6.06in)= 0.011< ρmax=0.021 ok
Check moment capacity
⍺=(As*Fy)/(0.85*fc’*b)= (0.8in2
*60kips/in2
)/(0.85*4 kips/in2
*12in)
= 1.18in
⍺/2 = 0.588in
ΦMn= 0.9*0.8*60*(6.06in-0.588in)(1ft/12in)
= 19.7 ft-kips/ft of slab width
Mu= 18.47 ft-kips/ft of slab width [ < ΦMn, so ok]
Check minimum steelIn a flexure member where tension reinforcement is required by analysis,
the minimum reinforcement provided shall be adequate to develop a moment capacity at least
1.2times the cracking moment. [AASHTO 8.17.1]
[AASHTO Equation 8-62] ΦMn≥1.2 Mcr
[AASHTO 8.13.3 & Equation 8-2] Mcr= fr*Ig/yt
fr=modulus of rupture= 7.5(√fc') for normal weight concrete
fc= 4000lbf/in2
Ig= moment of inertia](https://image.slidesharecdn.com/3f2a44db-1d80-49e7-ae93-9cce7e06d379-150402132200-conversion-gate01/85/Capstone-project-31-320.jpg)
![Prepared by: Dawit Bogale Submitted to: Dave Mukerman
Capstone project 2012
31
Yt= distance from centroidal axis to extreme fiber in tension
ΦMn≥ 1.2Mcr
Mcr= fr*Ig/yt= (7.5 ) *((12in)(9in)3
)/4.5in)*(1ft/12in)(1kip/ft)
Mcr= 6.404 ft.-kips/ft.
1.2 Mcr=1.2*6.404ft-kips = 7.68ft-kips/ft. [≤ΦMn=19.47 ft.-kips/ft. ok
Distribution Reinforcement
Reinforcement traverse to main steel reinforcement is placed in the bottom of all slabs. The
amount shall be a percentage of the main reinforcement required as determined in the following
formula. [AASHTO 3.24.10]
[AASHTO 3.24.10.2 & Equation 3-22] The percentage is 220/ (√S), with a maximum of 67%
= 220/ (√9.83ft) =70.17% [67%maximum allowed]
As= 0.67*0.7in2
= 0.47 in2
/ ft.
Use #6@9in (As= 0.59in2
/ft.) in the bottom and perpendicular to the main reinforcement in the
middle half of the slab span. 50% of the specified distribution reinforcement is used in the outer
quarters of the slab span. [AASHTO 3.24.10.3]
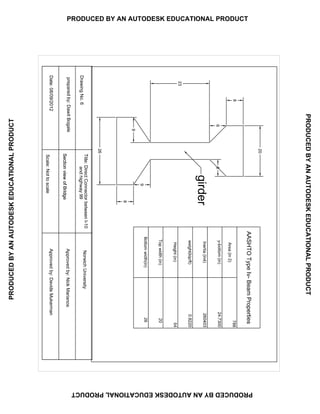
5. Design for shear and bond
Slabs designed for bending moment in accordance with AASHTO sec.3.24.3 (wheel loads) are
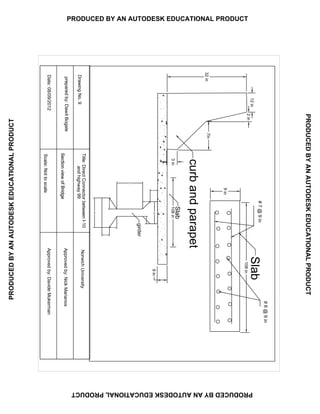
considered satisfactory in bond and shear. Fig. 4 shows slab and curb detail in the next page.](https://image.slidesharecdn.com/3f2a44db-1d80-49e7-ae93-9cce7e06d379-150402132200-conversion-gate01/85/Capstone-project-32-320.jpg)
![Prepared by: Dawit Bogale Submitted to: Dave Mukerman
Capstone project 2012
36
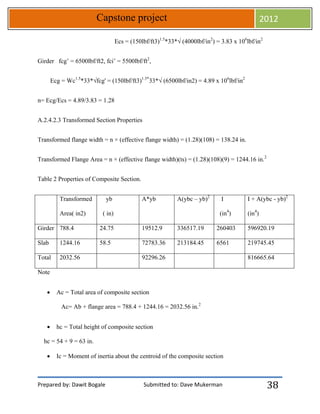
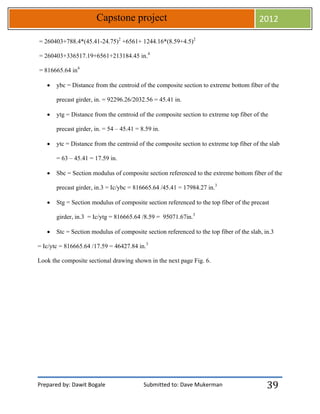
A.2.4 CROSS SECTION PROPERTIES FOR A TYPICAL GIRDER
A.2.4.1 NON-COMPOSITE SECTION
The section properties of an AASHTO Type IV girder are provided in the following table.
Table 1 Section Properties of AASHTO Type IV Girder
yt (in) yb (in) Area(in2) I (in4) Wt/lf (lbs)
29.25 24.75 788.4 260403 821
Where:
I = Moment of inertia about the centroid of the non-composite precast girder = 260,403 in.4
yb = Distance from centroid to the extreme bottom fiber of the non-composite precast girder =
24.75 in.
yt = Distance from centroid to the extreme top fiber of the non-composite precast girder = 29.25
in.
Sb = Section modulus referenced to the extreme bottom fiber of the non-composite precast
girder, in.3 = I/yb = 260,403/24.75 = 10,521.33 in.3
St = Section modulus referenced to the extreme top fiber of the non-composite precast girder,
in.3 = I/ yt = 260,403/29.25 = 8902.67 in.3
COMPOSITE SECTION
Effective Flange Width
[AASHTO 9.8.3.2] The effective flange width is lesser of:](https://image.slidesharecdn.com/3f2a44db-1d80-49e7-ae93-9cce7e06d379-150402132200-conversion-gate01/85/Capstone-project-37-320.jpg)
![Prepared by: Dawit Bogale Submitted to: Dave Mukerman
Capstone project 2012
37
Case 1: 0.25 span length of girder:
= 80(12 in. /ft.)/ 4 = 240 in.
Case 2: 12 × (effective slab thickness) + (greater of web thickness or one half top flange width):
= 12(9) + 0.5(20) = 118 in.
[0.5 × (girder top flange width) = 10 in. > web thickness = 8 in.]
Case 3: Average spacing of adjacent girders:
= (9 ft.)(12 in. /ft.) = 108 in. (controls)
Effective flange width = 108 in.
A.2.4.2.2Modular Ratio between Slab and Girder Concrete
The modular ratio between the slab and girder concrete is used for service load design
calculations. For the flexural strength limit design, shear design, and deflection calculations, the
actual modular ratio based on optimized concrete strengths is used.
n = Ecs for slab/ Ecg for girder
where n is the modular ratio between slab and girder concrete, and
Ec is the elastic modulus of concrete.
Slab concrete fcs’ = 4000lbf/ft2
,
[AASHTO Equation 10-68] Ecs = Wc1.5
*33*√fcs'](https://image.slidesharecdn.com/3f2a44db-1d80-49e7-ae93-9cce7e06d379-150402132200-conversion-gate01/85/Capstone-project-38-320.jpg)
![Prepared by: Dawit Bogale Submitted to: Dave Mukerman
Capstone project 2012
41
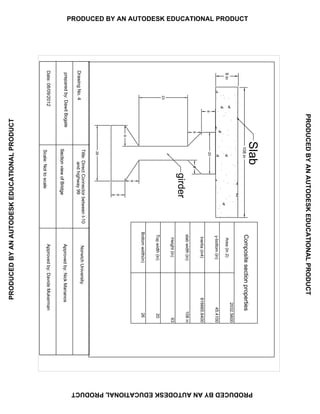
SHEAR FORCES AND BENDING MOMENTS
The self-weight of the girder and the weight of the slab act on the non-composite simple span
structure, while the weight of the barriers, future wearing surface, live load, and dynamic load
act on the composite simple span structure. [2]
Shear Forces and Bending Moments due to Dead Load
Dead Loads
Dead loads acting on the non-composite structure:
Self-weight of the girder = 0.821 kip/ft.
Weight of cast-in-place deck on each girder = (0.150kcf) (9 in.) (9 ft.)/ (12 in./ft.)
= 1.012 kips/ft.
Total dead load on non-composite section = 0.821 + 1.012 = 1.833 kips/ft.
Superimposed Dead Loads
The superimposed dead loads placed on the bridge, including loads from railing and wearing
surface can be distributed uniformly among all girders.
Weight of 0.5 in. wearing surface = 0.03 kips/ft2
. This load is applied over the entire clear
roadway width of 39 ft.-0 in.
DFWS= (FWS)*9ft
= (0.03kip/ft2
)*9ft](https://image.slidesharecdn.com/3f2a44db-1d80-49e7-ae93-9cce7e06d379-150402132200-conversion-gate01/85/Capstone-project-42-320.jpg)
![Prepared by: Dawit Bogale Submitted to: Dave Mukerman
Capstone project 2012
43
Determine the wind load, Wsuper, on the superstructure transmitted to the substructure. For the
usual girder having span lengths less than 125ft, the transverse wind loading on the
superstructure can be taken as 50lbf/ft2
, and the longitudinal wind loading can be taken as
12lbf/ft2
. [AASHTO 3.15.2.1.3]
The height exposed to wind is
= 54 in (girder) + 9in (slab) + 32in (curb and parapet)
=95 in or 7.92ft
The longitudinal wind loading is
= 80 ft. * 7.92 ft. * 0.012 kip/ft2
= 7.6kips (at 7.92/2= 3.96 ft.)
The longitudinal (horizontal) wind loading of the superstructure is
WH= 7.6 kips/80ft
= 0.095 kips/ft. (including wind load on the girder)
The vertical wind loading of the superstructure is
= 7.6 kips*3.96ft/80ft
= 0.376 kips (including wind load on girder)
WV = 0.376 kips/ 80 ft. = 0.0047 kip/ft. [negligible]](https://image.slidesharecdn.com/3f2a44db-1d80-49e7-ae93-9cce7e06d379-150402132200-conversion-gate01/85/Capstone-project-44-320.jpg)
![Prepared by: Dawit Bogale Submitted to: Dave Mukerman
Capstone project 2012
44
The height exposed to wind is
= 54 in (girder) + 9in (slab) + 6ft (wind load on vehicle acts)
=11.25 ft.
The longitudinal wind loading is
= 80 ft. * 0.04 kip/ft.
= 3.2kips (at 11.25/2= 5.625 ft.)
The longitudinal (horizontal) wind loading of the superstructure is
WLH= 3.2 kips/80ft
= 0.04 kips/ ft. (including wind load on the girder)
The vertical wind loading of the superstructure is
WLV = 3.2 kips*3.96ft/80ft
= 0.079 kips (including wind load on girder)
the maximum lateral moment due to the factored wind loading is computed as follows:
M = WL2
/10 =
A longitudinal force of 5% of the live load in all lanes is located 6ft above floor slab. For HS 25
loading, the longitudinal force is
= 3 lanes*[80ft*(0.64kip/ft.*1.25) +(26kips*1.25)]*0.05](https://image.slidesharecdn.com/3f2a44db-1d80-49e7-ae93-9cce7e06d379-150402132200-conversion-gate01/85/Capstone-project-45-320.jpg)
![Prepared by: Dawit Bogale Submitted to: Dave Mukerman
Capstone project 2012
45
= 14.475 kips
The horizontal force is
LFH = 14.475 kip/80 ft. =0.18 kip/ft.
Determine the live load distribution
[AASHTO 3.12.1]
The reduction in load intensity for three traffic lanes loaded is 90%. The transverse distribution
of wheel loads for beam design for an interior beam is
= S/5.5 [AASHTO Table 3.23.1]
= 9ft. /5.5 = 1.45
This distribution factor will be applied for HS loading.
Determine impact load [AASHTO 3.8.2]
I= 50/ (L+125) = 50/(80+125) = 0.244 [3]
Determine service loads moment and shear
The moment at mid span due to the weight of the beam is
M0 = WL2
/8 = (0.821 * 802
)/8 = 656.8 ft.-kips
The moment at mid span due to the slab dead load per beam is
MD = (WD*L2
)/8 = (1.012*802
)/8 = 809.6 ft.-kips](https://image.slidesharecdn.com/3f2a44db-1d80-49e7-ae93-9cce7e06d379-150402132200-conversion-gate01/85/Capstone-project-46-320.jpg)
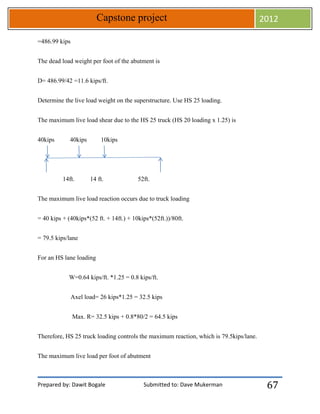
![Prepared by: Dawit Bogale Submitted to: Dave Mukerman
Capstone project 2012
47
40kips 40kips 10kips
14ft. 14 ft. 52ft.
Fig. 7 Maximum live load shear
The live load reaction at A is
= 40 kips + (40kips*(52 ft. + 14ft.) + 10kips*(52ft.))/80ft.
= 79.5 kips
For an HS lane loading
W=0.64 kips/ft *1.25 = 0.8 kips/ft
Axel load= 26 kips*1.25 = 32.5 kips
Max. R= 32.5 kips + 0.8*80/2 = 64.5 kips
Therefore, HS 25 truck loading controls the maximum reaction, which is 79.5kips/lane.
The maximum live load shear with impact for each beam is
VL+I = (79.5 kips/2 wheel lines)*1.45*1.244
= 71.7 kips
Factored loads are used for designing structural members using the load factor concept. Group
loading combinations for load factor design are given by [AASHTO 3.22.1A; and foot notes]](https://image.slidesharecdn.com/3f2a44db-1d80-49e7-ae93-9cce7e06d379-150402132200-conversion-gate01/85/Capstone-project-48-320.jpg)
![Prepared by: Dawit Bogale Submitted to: Dave Mukerman
Capstone project 2012
48
Group I =1.3(1D + (1.67) (L+I))
Group II =1.3(1D + 1W)
Group III =1.3(1D + 1L+0.3W+1WL)
Group IV =1.3(1D + 1L)
Group V =1.25(1D + 1W)
Group VI =1.25(1D + 1L+0.3W+1WL)
For the strength limit state, wind on the structure is considered for the Strength III and Strength
V Limit States. Due to the magnitude of the live load stresses, Strength III will clearly not
control for this design. Therefore, for this design, group I control the design factor load.
Calculate the factored moment and shear
Mu = 1.3(1D + (1.67) (L+I))
= 1.3*[656.8+809.6+377.6+ (1.67)*(1313.23)]
=5248.22 ft.-kips
Vu = 1.3(1D +1.67*(L+I))
= 1.3(92.12 kips + 1.67*(71.7kips))
= 275.42 kips
Allowable concrete stresses for I-beam girders [AASHTO 9.15.2]](https://image.slidesharecdn.com/3f2a44db-1d80-49e7-ae93-9cce7e06d379-150402132200-conversion-gate01/85/Capstone-project-49-320.jpg)
![Prepared by: Dawit Bogale Submitted to: Dave Mukerman
Capstone project 2012
49
[AASHTO 9.15.2.1 & 9.15.2.2]
Compression (pretension members) before losses due to creep and shrinkage,
fci=0.6 f’ci= 0.6*5500lbf/in2
= 3300psi
Tension (with no bonded reinforcement) before losses due to creep and shrinkage,
fti =200lbf/in2
or )
[AASHTO 9.15.2.2]
Compression stresses after losses, fcs= 0.4f’cg= 0.4*6500lbf/in2
= 2600lbf/in2
Tension after losses, fts = ) = √ ) = 483.7 lbf/in2
For severe corrosive exposure conditions, fts= ) = 241.87 lbf/in2
Calculate pre-stress force and eccentricity
The temporary stress limits before losses due to creep and shrinkage are as follows.
For compression,
fcs= 0.4f’cg= 0.4*6500lbf/in2
= 2600lbf/in2
For tension,
fts= ) = √ )= 556 lbf/in2
Allowable stresses after losses are as follows.](https://image.slidesharecdn.com/3f2a44db-1d80-49e7-ae93-9cce7e06d379-150402132200-conversion-gate01/85/Capstone-project-50-320.jpg)
![Prepared by: Dawit Bogale Submitted to: Dave Mukerman
Capstone project 2012
50
For compression,
fcs= 0.4f’cg= 0.4*6500lbf/in2
= 2600lbf/in2
For tension,
fts= )= √ )= 242 lbf/in2
N.B: A 25% loss of pre-stress force is assumed in the straight tendons. It will be assumed that the
critical stresses are the initial tensile stress at the top of the beam at the bearing and the final
tensile stress at the bottom of the beam at mid-span.
For initial tensile stress at the top of beam at bearing,
fti= Pi/Ab + Pie/St
Substituting values for the stresses and section properties gives
300 lbf/in2
= -Pi/788.4 + Pi *e/8902.67 -------------------------------------------------------Equation 1.
For final tensile stress at the bottom of the beam at midspan,
fts = (-Pe/Ab) – (Pe* e/Sb) +( MO+D/Sb) +(( Ms+ML+I)/Sbc)
242= (-0.75Pi/ 788.4) – (0.75Pi*e/10,521.33) + [((656.8 ft.-kips+809.6 ft.-kips)/ 10,521.33) +
((377.6 kip- ft. +1313.23 kip- ft.) / 17984.27 in.3)]*12*1000 -----------------------------Equation 2.
Solving Equation 1 and 2 simultaneously gives
Pi=1,348,630 lbf; e= 13.27 in
[AASHTO 9.15.1] The amount of force taken by one ½ in, seven-wire strand at 70% of ultimate](https://image.slidesharecdn.com/3f2a44db-1d80-49e7-ae93-9cce7e06d379-150402132200-conversion-gate01/85/Capstone-project-51-320.jpg)
![Prepared by: Dawit Bogale Submitted to: Dave Mukerman
Capstone project 2012
51
stress f’s is
F=As*fsi
Where, fsi = 0.7*f’s
F= O.153 in2
*0.7*270000 = 28920lbf
The number of strands required is
N = 1348630/28920 = 46.63 ≅ [USE 47 STRANDS]
For 47 strands, the initial pre-stressing force is
Pi = 28920lbf*47 = 1359240lbf
Try the following pattern
Number of strands 5 5 5 5 3 3 3 2 2 2 2 2 2 2 2 2
Distance from
bottom fiber
2 4 6 8 10 12 14 16 18 20 22 24 26 28 30 32
Strand eccentricity at mid-span after strand arrangement
ec = 24.75 –[(5(2 + 4 + 6+8) +3(10+12+14)+ 2(16+18+20+22+24+26+28+30+32))/47]
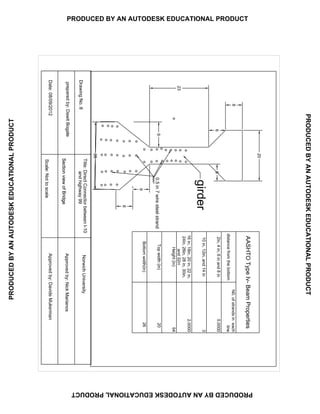
= 24.75- 13.62 in. = 11.11 in
Look Fig. 8 cross sectional view drawing no.8 strand arrangement in the next page.](https://image.slidesharecdn.com/3f2a44db-1d80-49e7-ae93-9cce7e06d379-150402132200-conversion-gate01/85/Capstone-project-52-320.jpg)
![Prepared by: Dawit Bogale Submitted to: Dave Mukerman
Capstone project 2012
53
Check the assumed pre-stress loss
The loss of pre-stress will be determined using the modified Bureau of Public Roads formula.[1]
Total loss of pre-stress is
=6000lbf/in2 + 16fcs + 0.04fsi
fsi = 0.7*f’s = 0.7*270000 = 189,000 lbf/in2
fcs= Pi/Ab + (Pi*e2 – Mo*e)/IB
fcs=[1359240lbf / 788.4in2] +[ [(1359240kips*11.112
) – (656.8 ft.-kips*12000*11.11in)]/
260403in4
]
fcs=1724.05 + 308.02 = 2032.07lbf/in2
Total loss of pre-stress is
=6000lbf/in2 +16*2032.07lbf/in2 +0.04*189000lbf/in2 =46073.1lbf/in2
The percentage loss is =(46073.1/189000)*100% = 24.4% < 25% assumed; therefore minimum
loss of 25% assumed is conservative.
The effective pre-stress loss force after losses is
Pe = (1-0.25)*1359240lbf = 1019430lbf
Determine the critical stresses at support and mid-span
Initial stresses before losses at support for the basic beam section are](https://image.slidesharecdn.com/3f2a44db-1d80-49e7-ae93-9cce7e06d379-150402132200-conversion-gate01/85/Capstone-project-54-320.jpg)
![Prepared by: Dawit Bogale Submitted to: Dave Mukerman
Capstone project 2012
54
Pi/Ab = 1359240lbf/788.4 in2
= -1724.47lbf/in2 [compression]
Pi*e/St = 1359240lbf * 11.11in/8902.67 in3
m= 1696.25lbf/in2 [tension]
Pi*e/Sb = 1359240lbf*11.11in / 10521.33 in3
= -1435.29lbf/in2 [compression]
Check the allowable stresses
[AASHTO 9.15.2.1 &9.15.2.2]
For compression at the beam base, allowable concrete stress = fci
Fci= 0.6*f’ci = 0.6*5500lbf/ in2 = 3300lbf/in2 [> -3159.76 lbf/in2 = (-1724.47-1435.29) lbf/in2,
ok]
For tension, to be conservative, allowable concrete stress fti lesser of 200lbf/in2 or
√ = 222.5 lbf/in2
fti=200lbf/in2 [>-28.22 lbf/in2 =( -1724.47+1696.25) lbf/in2]
Final stresses after losses at mid span are as follows.
The stress in the basic beam section at girder base is
= -Pe/Ab – Pe*e/Sb
= -1019430/788.4 – 1019430*11.11/10521.33
= -1293.04 – 1076.47
= -2369.51 lbf/in2 [compression]](https://image.slidesharecdn.com/3f2a44db-1d80-49e7-ae93-9cce7e06d379-150402132200-conversion-gate01/85/Capstone-project-55-320.jpg)
![Prepared by: Dawit Bogale Submitted to: Dave Mukerman
Capstone project 2012
55
The stress at the top of the girder is
f= -Pe/Ab + Pe*e/St
= -1293.04 + 1019430*11.11/8902.67
= -20.85lbf/in2 [compression]
Due to the beam and slab weight, the stress at the top of the girder is
=-MO+D/St = -((656.8 +809.6)/8902.67)*12*1000 = -1976.58lbf/in2 [compression]
The stress at the girder base is
= MO+D/Sb = -((656.8 +809.6)/10521.33)*12*1000 = 1672.49lbf/in2 [tension]
Due to the superimposed dead load (parapet and curb) plus live load, the stress in the composite
section at slab top is
f= -Ms+ML+I/Stc = - ((377.6 +1313.23)/ 46427.84)*12*1000 = -437.02lbf/in2 [compression]
The stress in the composite section at the girder base is
f=Ms+ML+I/Sbc = ((377.6 +1313.23)/ 17984.27)*12*1000 = 1128.21lbf/in2 [compression]
Check the allowable stresses in the girder after losses.
[AASHTO 9.15.2.2] For compression at the beam base, allowable concrete stress =
fcs= 0.4*f’cg = 0.4*5500lbf/ in2 = 2600lbf/in2 [> -2210.85lbf/in2 , ok]
[AASHTO 9.15.2.2] For tension,](https://image.slidesharecdn.com/3f2a44db-1d80-49e7-ae93-9cce7e06d379-150402132200-conversion-gate01/85/Capstone-project-56-320.jpg)
![Prepared by: Dawit Bogale Submitted to: Dave Mukerman
Capstone project 2012
56
fts= 6√(f’cg = 6√(6500 lbf)/in2 = 483.7lbf/in2(>431.19lbf/in2 ok)
Check the stress in the slab
[AASHTO 8.15.2.1.1] fcs allowable compressive stress in concrete (slab)
fcs= 0.4*f’cs= 0.4*4000 = 1600 lbf/in2
fslab = (Ms +ML+I)/Stc = -((377.6 +1313.23)/ 46427.84)*12*1000 = -437.02 lbf/in2
[compression]
[<1600lbf/in2, so ok]
Check moment capacity by Load factor design. First, determine whether the beam section is
flanged or rectangular.
[AASHTO 9.17.2] ⍺= As*f*su/0.85fc,slab b
f’c,slab= f’cs=4000lbf/in2
[AASHTO 9.17.4.1] f*su=average stress in pre-stressing steel at ultimate load
f*su=f’s(1-(ɤ/β1)(ρ*f’s/f’c))
[AASHTO 9.1.2] ɤ*= 0.4 for steel relieved steel [AASHTO 9.1.2]
[AASHTO 8.16.2.7] β1=0.85-0.05*(500/1000)=0.825 [AASHTO 8.16.2.7]
f’s=270000lbf/in2
ρ*=As/bd = 47*0.153/(108*(63-13.62)) = 0.00135](https://image.slidesharecdn.com/3f2a44db-1d80-49e7-ae93-9cce7e06d379-150402132200-conversion-gate01/85/Capstone-project-57-320.jpg)
![Prepared by: Dawit Bogale Submitted to: Dave Mukerman
Capstone project 2012
57
f*su=(270000lbf/in2)*(1-[(0.4/0.825)*(0.00135*270000/4000)])
= 258070.91lbf/in2
⍺= (47*0.153*258070.91)/(0.85*4000*108)
= 5.05 in
Since ⍺<9 in, the effective thickness of the slab, the beam is rectangular.
The moment capacity by load factor design is
ΦMn= Φ(A*sf*su d(1-0.6(ρ*fsu*/f’c))) [AASHTO 9.1.7.2]
[AASHTO 9.14] Φ=1 for flexure in pre-stressed concrete members for load factor design
ΦMn= 1(47*0.153*258070.91*(63-13.63)(1-0.6(0.00135*258070.91*/4000)))
= 104420290.04in-lbf
= 8701.69ft-kips
Determine the design moment by the load factor method (Group I loading)
Mu=1.3D + 2.17(L+I)
= 1.3(Mo+MD+Ms) + 2.17(ML+I)
= 1.3(656.8+809.6+377.6) + 2.17(1313.23)
= 5246.91 ft-kips [<ΦMn =8701.69ft-kips ok]
[AASHTO 9.18.1] The pre-stress steel’s reinforcement index cannot exceed 0.36β1.](https://image.slidesharecdn.com/3f2a44db-1d80-49e7-ae93-9cce7e06d379-150402132200-conversion-gate01/85/Capstone-project-58-320.jpg)
![Prepared by: Dawit Bogale Submitted to: Dave Mukerman
Capstone project 2012
58
Ρ*f*su/f’c = 0.00135*258070.91/4000
= 0.087 [<0.36β1=0.36*0.825=0.297, ok]
Determine the minimum amount of pre-stressing steel that will be necessary.
[AASHTO 9.18.2] The total amount of pre-stressing reinforcement shall be adequate to develop
an ultimate moment at the critical section of at least 1.2 times the cracking moment M*cr.
ΦMn≥ 1.2 M*cr
M*cr= (fr+fpe)Sbc – Md/nc((Sc/Sb) -1)
Md/nc = non-composite dead load moment
= Mo + MD + Ms
= 656.8+809.6+377.6
= 1844 ft-kips
[AASHTO 9.15.2.3] fr= √ = = 604.67lbf/in2
fpe= Peffect/Ab + Peffect*e/Sb – Mo/Sb
Peffect = Pi*0.75 = (0.7f’sA*s)*0.75
= 0.7*270*0.153*42*0.75
= 910.89kips
fpe = 910.89/788.4 + 910.89*11.11/10521.33 – 656.8*12/10521.33](https://image.slidesharecdn.com/3f2a44db-1d80-49e7-ae93-9cce7e06d379-150402132200-conversion-gate01/85/Capstone-project-59-320.jpg)
![Prepared by: Dawit Bogale Submitted to: Dave Mukerman
Capstone project 2012
59
= 1.155 + 0.962 -0.749
= 1.37kips/in2
M*cr. = (0.6047+1.37)* 17984.27 – 1844*((17984.27 /10521.33) -1)
= 2959.46 – 1307.98
= 1651.48 ft-kips
1.2M*cr. = 1.2*1651.48 = 1981.776 ft.-kips [<ΦMn = 8701.69ft-kips, ok]
Design for shear
Shear design for straight fully bonded strands pre-stressed beams will be in accordance with
Article 9.20 of the AASHTO Specifications.
Vu ≤ Φ*(Vc + Vs) [AASHTO Equation 9-26]
The shear stress at the support is
The maximum live load and impact load shear is
VL+I= (79.5 kips/ 2 wheel lines)*1.45*1.244= 71.7kips
The maximum dead load shear is
VO+D+S = (0.821kip/ft. + 1.012kip/ft. + 0.472kip/ft.)*40ft.
= 92.12 kips at each support
Calculate shear stress at the quarter point](https://image.slidesharecdn.com/3f2a44db-1d80-49e7-ae93-9cce7e06d379-150402132200-conversion-gate01/85/Capstone-project-60-320.jpg)
![Prepared by: Dawit Bogale Submitted to: Dave Mukerman
Capstone project 2012
60
[AASHTO 9.20.2.1 & 9.20.2.2] The shear strength of concrete, Vc, shall be the lesser of Vci or
Vcw.
Vci= 0.6(√’fc) b’ d + Vd + ViMcr/Mmax
b’= 8in
d= yt+e= 29.25 in + 11.11 in = 40.39 in
From shear force diagram, since dead load is uniform, the shear force at quarter point equals half
of the support shear force.
Vd= ½(92.12) = 46.06 kips
The factored shear force due to externally applied loads occurring simultaneously with Mmax is
Vi= 1.3*1.67(L+I)
= 1.3*1.67*53.69
= 116.56 kips
Mcr = (Ic/yb)( 6√f’cg + fpe – fd)
Moments at quarter point are (Wo+WD = WL). For beam weight (W) and slab weight (WD),
MO+D = (WL/2)(L/4) – (WL/4)(L/8)
= WL2
/8 – WL2
/32
= 3(WL) 2
/32](https://image.slidesharecdn.com/3f2a44db-1d80-49e7-ae93-9cce7e06d379-150402132200-conversion-gate01/85/Capstone-project-61-320.jpg)
![Prepared by: Dawit Bogale Submitted to: Dave Mukerman
Capstone project 2012
61
= (3/32)*(0.821 + 1.012)*802
= 1099.8 ft.-kips
For the superimposed dead load, Ws(parapet/curb),
Ms= (3/32)*(Ws) 2
= (3/32)*(0.472)* 802
= 283.2 ft-kips
fpe= 1.37 kips.in2
The stress due to the un-factor dead load at the quarter point in the beam span is
fd= (MO+D/Sb) + (Ms/Sbc)
= (1099.8/10521.33 + 283.2/17984.27)*12in/ft
= 1.44 kips/in2
Mcr = (816665.64 /45.41)*[( 6√6500 *1/1000) +1.37 – 1.44]*1/12
= 620.06 ft- kips
The maximum factored moment due to externally applied load at quarter point is
Mmax = ML+I
= 1.3*1.67(L+I)
= 2.17*(1012.73)](https://image.slidesharecdn.com/3f2a44db-1d80-49e7-ae93-9cce7e06d379-150402132200-conversion-gate01/85/Capstone-project-62-320.jpg)
![Prepared by: Dawit Bogale Submitted to: Dave Mukerman
Capstone project 2012
62
= 2197.62 ft.-kips
Vci= (0.6*(√6500)* 8*40.39)*1/1000 + 46.06 + 116.56*620.06/2197.62
= 15.63 + 46.06 + 32.89
= 94.58 kips
Vc = Vci = 94.58 kips
Vc, min = 1.7*√f’c *b’ *d
= 1.7*((√6500)*1/1000)*8*40.39
= 44.27 kips
d≥ 0.8h = 0.8*54 in = 43.2 in [ d=40.39 ≅ 0.8h, hence so close ok]
Vu ≤ Φ(Vc +Vs)
Vu= 1.3(1D +1.67(L+I))
= 1.3(46.06 + 1.67(53.69))
= 176.44 kips
For load factor design, Φ=0.9 for shear[AASHTO 9.14]
Vu/Φ = 176.44/0.9 = 196.04 kips
Vs= Vu/Φ – Vc = 196.04 – 94.58 = 101.46 kips
[AASHTO 9. 20.3.1] Check Vs ≤ 8*√f’cg b’ *d = 8*(√6500* 1/1000)*8*40.39 = 208.41 kips](https://image.slidesharecdn.com/3f2a44db-1d80-49e7-ae93-9cce7e06d379-150402132200-conversion-gate01/85/Capstone-project-63-320.jpg)
![Prepared by: Dawit Bogale Submitted to: Dave Mukerman
Capstone project 2012
63
Vs= 101.46 kips ≤ 208.41kips ok
For grade 60 No. 4 vertical stirrups, the spacing required
[AASHTO Equation 9-30] S = (Av * fsy * d) / Vs
= 0.4*60*40.39/ 101.46
= 9.55 in [use 10 in spacing]](https://image.slidesharecdn.com/3f2a44db-1d80-49e7-ae93-9cce7e06d379-150402132200-conversion-gate01/85/Capstone-project-64-320.jpg)
![Prepared by: Dawit Bogale Submitted to: Dave Mukerman
Capstone project 2012
66
Dead loads of super structure on the abutment:
Self-weight of the girder = 0.821 kip/ft.
Weight of cast-in-place deck on each girder = (0.150kcf) (9 in.) (9 ft.) / (12 in./ft. )
= 1.012 kips/ft.
For the end block and diaphragm,
= 42ft*2.75ft*1.5ft*0.15kip/ft3
= 25.99 kip
Future wearing surface
DFWS= (FWS)*9ft
= (0.03kip/ft2)*9ft
= 0.27 kip/ft./girder
WC+P = (curb and parapet) for one girder
= 3.37ft2*(0.15kip/ft3)*2/5
= 0.202 kip/ft. / girder
Total dead load of super structure
=([0.821(beam) + 1.012(slab) + 0.27(wearing surface) + 0.202(curb and parapet)]*5*80/2) +
25.99(end block and diaphragm)](https://image.slidesharecdn.com/3f2a44db-1d80-49e7-ae93-9cce7e06d379-150402132200-conversion-gate01/85/Capstone-project-67-320.jpg)
![Prepared by: Dawit Bogale Submitted to: Dave Mukerman
Capstone project 2012
68
= (3lanes * 79.5 kips/lane)/42ft.
=5.68 kips/ft.
Determine the lateral earth pressure
An equivalent fluid weight of 35lbf/ft3
is assumed for determining the lateral earth pressure. The
effect of passive pressure due to soil in front of the abutment is neglected.
[AASHTO 3.20.3 &5.5.2] Alive load surcharge pressure equal to 2 ft. of earth will be added to
the approach.[1]
= 2ft*35lbf/ft3
= 70lbf/ft2
A lateral pressure due to the earth back fill is
= (5.37ft + 16ft)*35lbf/ft3
= 747.95lbf/ft2
The load due to earth and live load surcharge is as follows
Ls= 0.07*21.37 =1.5 kips/ft.
E = 0.5*0.748*21.23 = 7.98 kips/ft.
In the next page, Fig. 10 shows Sectional view of Live load and Earth pressure on Abutment.](https://image.slidesharecdn.com/3f2a44db-1d80-49e7-ae93-9cce7e06d379-150402132200-conversion-gate01/85/Capstone-project-69-320.jpg)
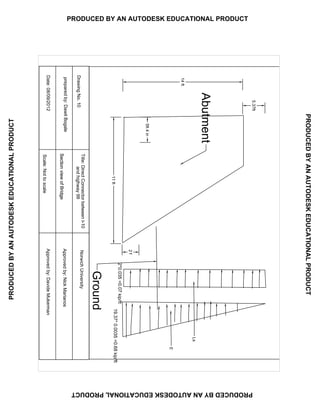
![Prepared by: Dawit Bogale Submitted to: Dave Mukerman
Capstone project 2012
70
Wind load (W and WL).
Wind forces are extremely complicated, but through a series of simplifications are reduced to an
equivalent static force applied uniformly over the exposed faces of the bridge (both super and
sub-structures) that are perpendicular to the longitudinal axis.
AASHTO specifies that the assumed wind velocity should be 100 mph. For a common slab-on-
stringer bridge this is usually a pressure of 50psf, and a minimum of 300 plf. These forces are
applied at the center of gravity of the exposed regions of the structure.
AASHTO recommends the following for common slab-on-stringer bridges:
1) Wind force on structures (W): a) transverse loading = 50psf b) longitudinal loading = 12psf
2) Wind force on live load (WL): a) transverse loading = 100psf b) longitudinal loading = 40psf
The transverse and longitudinal loads are placed simultaneously for both the structure and the
live load (AASHTO 3.15.2.1.3).
Determine the wind load, Wsuper, on the superstructure transmitted to the substructure. For the
usual girder having span lengths less than 125ft, the transverse wind loading on the
superstructure can be taken as 50lbf/ft2, and the longitudinal wind loading can be taken as
12lbf/ft2. [AASHTO 3.15.2.1.3]
The height exposed to wind is
= 54 in (girder) + 9in (slab) + 32in (curb and parapet)
=95 in or 7.92ft](https://image.slidesharecdn.com/3f2a44db-1d80-49e7-ae93-9cce7e06d379-150402132200-conversion-gate01/85/Capstone-project-71-320.jpg)
![Prepared by: Dawit Bogale Submitted to: Dave Mukerman
Capstone project 2012
71
The distance of the center of gravity of the superstructure area above the top of the abutment is
= (7.92ft/2) +0.12(bearing) = 4.08 ft
The longitudinal wind loading is
= 80 ft. * 7.92 ft. * 0.012 kip/ft2
= 7.6kips (at 7.92/2= 3.96 ft.)
This force transmitted to the substructure through the bearings.
[AASHTO 3.15.2.1.3] The longitudinal (horizontal) wind loading of the superstructure is
W super (H) = 7.6 kips/42ft abutment width
= 0.18 kips/ft
The vertical wind loading of the superstructure is
= 7.6 kips*4.08ft/80ft
= 0.388 kips (including wind load on girder)
Wsuper(V) = 0.388 kips/ 42 ft. = 0.009 kip/ft. [negligible]
[AASHTO 3.15.2.2] Determine the wind load on sub-structure, Wsub.
A wind loading of 40ft/ft2 will act perpendicular to the exposed stem of the abutment. The
horizontal wind loading at 10ft(= (12ft/2)+2ft+2ft) above the base of the abutment footing is
Wsub(H)= (0.04kip/ft2)*12ft = 0.48kip/ft. [exposed stem=12ft]](https://image.slidesharecdn.com/3f2a44db-1d80-49e7-ae93-9cce7e06d379-150402132200-conversion-gate01/85/Capstone-project-72-320.jpg)
![Prepared by: Dawit Bogale Submitted to: Dave Mukerman
Capstone project 2012
72
[AASHTO 3.15.3] Determine the upward wind load, Wup.
The upward force will be 20 lbf/ft2
of horizontal area for group II and V combinations and 6
lbf/ft2 for group III and VI combinations.
For group II and V, the uplift is
Wup= (80ft*39ft*0.02kip/ft2)/(2*42) = 0.743kip/ft
Whereas, roadway width =39ft
Slab width= 42ft = abutment width
Overall beam length = 80ft
For groups III and VI, the uplift is
Wup= (80ft*39ft*0.006kip/ft2)/(2*42) =0.222 kip/ft
[AASHTO 3.15.2.1.2 & 8.3.15.2.1.3] Determine the wind load, WL, transmitted to the
substructure by the wind load on the moving live load.
The longitudinal wind loading on the live load is taken as 0.04 kip/ft and acts at a point 6ft.
above the deck.
The height exposed to wind is
= 54 in (girder) + 9in (slab) + 6ft (wind load on vehicle acts)+ 0.12(bearing)
=11.37 ft](https://image.slidesharecdn.com/3f2a44db-1d80-49e7-ae93-9cce7e06d379-150402132200-conversion-gate01/85/Capstone-project-73-320.jpg)
![Prepared by: Dawit Bogale Submitted to: Dave Mukerman
Capstone project 2012
73
The longitudinal wind loading is
= 80 ft. * 0.04 kip/ft
= 3.2kips (at 11.37/2= 5.685 ft.)
The longitudinal (horizontal) wind loading of the superstructure transmitted through bearing.
The reaction at support
= 3.2kips*11.37/80ft = 0.455kip
The horizontal wind loading at the top of the abutment,
WLH= 3.2 kips/42ft
= 0.076 kips/ ft. (including wind load on the girder)
The vertical wind loading at the top of the abutment is
WLV = 0.455 kips/42ft
= 0.011 kips/ft width
[AASHTO Fig. 3.7.6B & 8.3.9] A longitudinal force of 5% of the live load in all lanes is located
6ft above floor slab. For HS 25 loading, the longitudinal force is
= 3 lanes*[80ft*(0.64kip/ft*1.25)+(26kips*1.25)]*0.05
= 14.475 kips
The horizontal force is](https://image.slidesharecdn.com/3f2a44db-1d80-49e7-ae93-9cce7e06d379-150402132200-conversion-gate01/85/Capstone-project-74-320.jpg)
![Prepared by: Dawit Bogale Submitted to: Dave Mukerman
Capstone project 2012
74
LFH = 14.475 kip/42 ft. =0.345 kip/ft.
The reaction at support is
= 14.475*11.37/80 = 2.057kips
The vertical force at the top of the abutment is
LFV= 2.057/42 = 0.049 kip/ft width [negligible]
[AASHTO 3.16] Determine the temperature force, Tf, due to friction.
The longitudinal force due to friction at expansion bearings, which is transmitted to both
abutments through the superstructure, is assumed to be 10% (coefficient of friction) of the dead
load reaction.
The friction force is
Tf =( 0.1)*(6.55 kips/ft)= 0.655kip/ft.
The service loads and moments due to the loads are summarized in Table 1.
Perform a stability analysis and bearing pressure check (service load design).
[AASHTO 3.3.6] The density of the normal weight concrete is 150lbf/ft3. The density of the
compacted earth fill is 120lbf/ft3. To compensate for incidental field adjustments in the location
of bearings, a 2 in longitudinal eccentricity from the theoretical centerline of bearing will be
used.
Ls= lateral pressure from 2 ft of soil for live load surcharge](https://image.slidesharecdn.com/3f2a44db-1d80-49e7-ae93-9cce7e06d379-150402132200-conversion-gate01/85/Capstone-project-75-320.jpg)
![Prepared by: Dawit Bogale Submitted to: Dave Mukerman
Capstone project 2012
75
= 2 ft.*0.035kip/ft3 * 21.37ft
=1.5kips/ft.
E= lateral earth pressure
= 21.37ft*0.035kip/ft3*21.37ft*0.5
= 7.98kips/ft.
To create the maximum pressure under the toe and the minimum pressure under the heel of the
footing, an eccentricity of 2in to the left for vertical forces will be used.
Check against sliding and overturning.
The factor of safety against sliding is
[AASHTO 5.5.5 & Table 5.5.2B]
FSs= f*∑V/∑H= 0.6*∑V/∑H≥1.5 [Assuming friction factor of 0.6]
The minimum factor of safety against sliding is 1.5.
The factor of safety against overturning is 2 for footings set on soil.
The location of the resultant soil pressure from the toe is given by
Ẋ= ((∑Mv,toe - ∑MH)/∑V)
The eccentricity of the resultant soil pressure is given by
eB= (B/2)-Ẋ](https://image.slidesharecdn.com/3f2a44db-1d80-49e7-ae93-9cce7e06d379-150402132200-conversion-gate01/85/Capstone-project-76-320.jpg)
![Prepared by: Dawit Bogale Submitted to: Dave Mukerman
Capstone project 2012
76
For eB < B/6, the pressure under the footing is given by
qt=(∑V/B)(1+(6*eB/B)) at toe
qt=(∑V/B)(1-(6*eB/B)) at heel
[AASHTO 5.5.5 & 4.4.7] For footing set on soil, the location of the resultant soil pressure should
be with in the middle one-third of the base.
The safe bearing capacity of the gravel sand foundation material is assumed to be 8.5 kips/ft2.
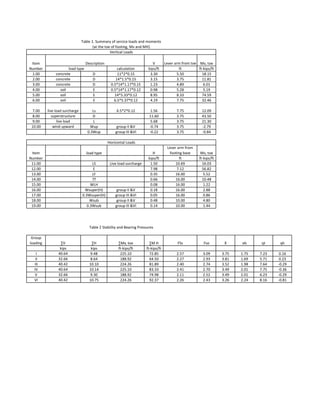
Table 3 shows service loads and service load moments at the toe of the footing in the next page.
Table 4 shows stability and bearing pressure in the next pressure.
The minimum values of the factor of safety against sliding and overturning from Table 4 are:
FSs, min= 2.11 from group V loading [>1.5, ok]
FSo, min= 2.43 from group VI loading [>2, ok]
The eccentricity of the resultant soil pressure, ∑V, is
eB, max = 2.24 ft from group VI loading [> B/6 = 11/6=1.83FT]
Check soil pressure qt, max = 8.16 kips/ft2 from group VI loading
[<safe bearing capacity = 8.5 kips/ft, ok]](https://image.slidesharecdn.com/3f2a44db-1d80-49e7-ae93-9cce7e06d379-150402132200-conversion-gate01/85/Capstone-project-77-320.jpg)
![Prepared by: Dawit Bogale Submitted to: Dave Mukerman
Capstone project 2012
78
3.2.2.1 Analyze and design for footing (Load factor design)
Factored loads and moments resulting from the factored loads are given in Tables 5-8 .The
factored bearing pressure under the footing at toe qt and heel qh for various group loading
combinations are summarized in Table 9.
Group I loading is critical for the toe of the footing. The factored shear and moment at the front
of the stem for this loading are assuming d=21.37in or 1.63 ft
Vu= (((10.94+9.55)/2)-0.39)*(3-1.63)
= 13.5kips/ft [at a distance d from the face of the stem]
Mu= (((7.9-0.39)*3*1.5 + 0.5*(10.94-7.9)*3*2
= 52.035 ft-kips/ft
Design the footing using strength criteria for concrete and steel of f’c=3000lbf/in2 and Fy =
60000lbf/in2.
[AASHTO 8.16.2.7 & 8.16.3] Calculate the maximum and minimum steel reinforcement
ρb= ((0.85β1f’c/Fy)*(87000/(87000+Fy))
= ((0.85*0.85*3000/60000)*(87000/ (87000+60000))
= 0.02138
ρmax= 0.75*ρb = 0.75*0.02138 = 0.016](https://image.slidesharecdn.com/3f2a44db-1d80-49e7-ae93-9cce7e06d379-150402132200-conversion-gate01/85/Capstone-project-79-320.jpg)
![Prepared by: Dawit Bogale Submitted to: Dave Mukerman
Capstone project 2012
82
3.2.2.1.1 Design for the toe.
It will be safe and conservative to neglect compression reinforcement in the design calculation.
For a singly reinforced section, the ultimate moment is
ΦMn = ΦAsFy(d-(⍺/2))
[AASHTO 8.16.1.2.2] Φ=0.9 for flexure
⍺= ((As*Fy)/ (0.85*f’c*b))
[AASHTO 8.22.1] Use d= 24in- 4 in cover – 0.5 in for 0.5 diameter of steel assumed =
19.5 in.
⍺= ((As*60)/(0.85*3*12))= 1.96 As
⍺/2 = 0.98As
Mu = ΦMn
(52.035 ft-kip/ft)*12 in/ft = 0.9 As*60(19.5in- 0.98As)
As2
– 19.9As + 11.8 = 0
As=19.29 in2 or 0.61 in2 [Since As should be less than 1, As=0.61 in2 is correct answer]
ρ= As/bd = 0.61/12*19.5 = 0.0026 [<ρmax = 0.016 ok]
Use #8@15 in( As= 0.62in2)
Check minimum steel
[AASHTO 8.17.1] The minimum reinforcement provided shall be adequate to develop a factored
moment capacity at least 1.2 times the cracking moment, unless the area of reinforcement
provided is at least one third greater than that required by analysis.](https://image.slidesharecdn.com/3f2a44db-1d80-49e7-ae93-9cce7e06d379-150402132200-conversion-gate01/85/Capstone-project-83-320.jpg)
![Prepared by: Dawit Bogale Submitted to: Dave Mukerman
Capstone project 2012
83
ΦMn ≥ 1.2Mcr
⍺= ((0.62*60)/(0.85*3*12)) = 1.216 in
⍺/2 = 0.608 in
ΦMn = 0.9*0.62*60*(19.5-0.608)/12 =52.71ft-kips/ft
The cracking moment, Mcr, is determined by the transformed area method.
Mcr = fr*I/ c
fr=modulus of rupture= 7.5(√fc') for normal weight concrete wc=150 lbf/ft3
fc= 4000lbf/in2
I= Icg= moment of inertia
c= distance from centroid axis to extreme fiber in tension
[AASHTO 8.7.1 & 8.7.2] Ec = 33*wc 1.5
(√fc')
= 33 1501.5
(√3000)
= 3,320,560.95lbf/in2
Es = 29,000,000 lbf/in2
n= 29,000,000 / 3,320,560.95 = 8.7 ≅ 9
The transformed area is
(n-1)*As= (9-1)*0.62 = 4.96 in2
Ac +As = 12*24 + 4.96 = 292.96 in2
Taking moment about the bottom and solving the equation,
292.96*yb = 288*12 +4.96*4.5
yb = 11.87in from bottom
The moment of inertia about the neutral axis is](https://image.slidesharecdn.com/3f2a44db-1d80-49e7-ae93-9cce7e06d379-150402132200-conversion-gate01/85/Capstone-project-84-320.jpg)
![Prepared by: Dawit Bogale Submitted to: Dave Mukerman
Capstone project 2012
84
Icg= (1/12)(12*243
) + 288*(12-11.87)2
+ 4.96(11.87 – 4.5)2
= 14100 in4
[AASHTO 8.15.2.1.1] fr=modulus of rupture= 7.5(√fc') = 7.5(√3000) =410.79lbf/in2
Mcr = fr*I/ c = (0.411*14100/11.87) /(12) = 40.68 ft.-kips/ft.
1.2Mcr = 1.2*40.68 = 48.82 ft.-kips/ft. [< ΦMn = 52.71 ft- kips/ft., ok]
Use #8@ 15 in.
[AASHTO 8.16.1.2.2 & Equation 8-49] Check shear at a distance d from the face of the stem.
The ultimate shear capacity without shear reinforcement is
ΦVc=Φ*2(√fc') *bw*d
= 0.85*2(√3000) *12*19.5 in
= 21788.4 lbf [> Vu from group I loading (=13.5kips/ft.) at a distance d from face of stem,
ok]
3.2.2.1.2 Design for the heel
Group VI loading is critical for the heel of the footing. The factored shear and moment at the
back of the stem for this loading are as follows.
w=1.25(21.35ft)(0.12) + 2ft* 0.15= 3.506
Vu = (3.506kips/ft2)*5.33ft – 0.5*4.424*4.341
= 9.082 kips/ft
Mu =3.506*4.341*2.67 – 0.5*4.424*4.341*(4.341/3)
= 26.74 ft-kips/ft
[AASHTO 8.22.1] For the heel steel design, use d= 24-3-0.5in for ½ diameter of steel
assumed=20.5in
⍺= ((As*60)/(0.85*3*12)) = 1.96As
⍺/2 = 0.98As](https://image.slidesharecdn.com/3f2a44db-1d80-49e7-ae93-9cce7e06d379-150402132200-conversion-gate01/85/Capstone-project-85-320.jpg)
![Prepared by: Dawit Bogale Submitted to: Dave Mukerman
Capstone project 2012
85
The moment in the heel at the back of the stem from group VI loading was 26.74ft-kips/ft
Mu = ΦMn = ΦAsFy(d-(⍺/2))
26.74ft-kips*12in/ft = 0.9*As*60*(20.5-0.98As)
As2
– 20.918As + 6.063 = 0
As= 20.624 in2 or 0.294 in2
As= 0.294 in2/ft
ρ= 0.294/12*20.5 = 0.0012[<ρmax = 0.016 ok]
Try 7@16in, As= 0.45 in2
Check minimum steel
⍺= ((0.45*60)/(0.85*3*12)) = 0.882 in
⍺/2 = 0.441 in
ΦMn = 0.9*0.45*60*(20.5-0.441)/12 =40.62ft-kips/ft
The transformed area is
(n-1)*As= (9-1)*0.45 = 3.6 in2
Ac +As = 12*24 + 3.6 = 291.6 in2
Taking moment about the top and solving the equation,
291.6*yt = 288*12 +3.6*3.5
yb = 11.895 in from top
The moment of inertia about the neutral axis is
Icg= (1/12)(12*243
) + 288*(12-11.895)2
+ 3.6(11.895 – 3.5)2
= 14080.89 in4
fr=modulus of rupture= 7.5(√fc') = 7.5(√3000) =410.79 lbf/in2
Mcr = fr*I/ c = (0.411*14080.89/11.895) / (12) = 40.54 ft-kips/ft
1.2Mcr = 1.2*40.54 = 48.65 ft-kips/ft [> ΦMn = 40.62 ft- kips/ft, not ok, increase the amount of](https://image.slidesharecdn.com/3f2a44db-1d80-49e7-ae93-9cce7e06d379-150402132200-conversion-gate01/85/Capstone-project-86-320.jpg)
![Prepared by: Dawit Bogale Submitted to: Dave Mukerman
Capstone project 2012
86
stee]
Try #8@ 15 in., As =0.62 in2
⍺= ((0.62*60)/(0.85*3*12)) = 1.216 in
⍺/2 = 0.608 in
Mu = ΦMn = ΦAsFy(d-(⍺/2))
= 0.9*0.62*60*(20.5-0.608)
= 55.5 ft-kips/ft
The transformed area is
(n-1)*As= (9-1)*0.62 = 4.96 in2
Ac +As = 12*24 + 4.96 = 292.96 in2
Taking moment about the top and solving the equation,
292.96*yt = 288*12 +4.96*3.5
yb = 11.86 in from top
The moment of inertia about the neutral axis is
Icg= (1/12)(12*243
) + 288*(12-11.86)2 + 4.96*(11.86 – 3.5)2 = 14176.3 in4
fr=modulus of rupture= 7.5(√fc') = 7.5(√3000) =410.79 lbf/in2
Mcr = fr*I/ c = (0.411*14176.3/11.86) /(12) = 40.94 ft-kips/ft
1.2Mcr = 1.2*40.94 = 49.13 ft-kips/ft [< ΦMn = 55.5 ft- kips/ft, ok]
Use 8@15 in, As= 0.62 in2
Check shear in the heel at the back of the stem. The ultimate shear capacity without shear
reinforcement is [AASHTO 8.16.1.2.2]
ΦVc=Φ*2(√fc') *bw*d
= 0.85*2(√3000) *12*20.5 = 22900lbf/ft = 22.9 kips/ft [> Vu from group VI loading](https://image.slidesharecdn.com/3f2a44db-1d80-49e7-ae93-9cce7e06d379-150402132200-conversion-gate01/85/Capstone-project-87-320.jpg)
![Prepared by: Dawit Bogale Submitted to: Dave Mukerman
Capstone project 2012
87
(=9.082kips/ft) at a distance d from face of stem, ok]
3.2.2.1.3 Design for stem
Analyze for the stem
The stem will be designed for combined axial load and bending. To compensate for incidental
field adjustments in the location of bearings for for vertical loads, a 2in longitudinal eccentricity
from the theoretical centerline of bearing will be used. This 2 in eccentricity will produce the
maximum or minimum moment at the stem base.[1]
Determine the minimum axial load and maximum moment with a 2 in eccentricity toward the
stem front face from the bearing point as follows.
Factored loads are used for designing structural members using the load factor concept. Group
loading combinations for load factor design are given by AASHTO 3.22.1A; and foot notes
βD = 0.75 because of designing members for minimum axial load and maximum moment, and
βE = 0.75 for lateral earth pressure.
Group I =1.3(0.75*D +0.75EVERTICAL+ 1.67(L+LS) +1.3ELATERAL)
Group II =1.3(0.75*D +0.75EVERTICAL+ 1W +1.3ELATERAL)
Group III =1.3(0.75*D +0.75EVERTICAL+ 1L+LS+0.3W+1WL+1.3ELATERAL +1LF)
Group IV =1.3(0.75*D +0.75EVERTICAL +1L+LS +1T+1.3ELATERAL)
Group V =1.25(0.75*D +0.75EVERTICAL+ 1W+1W +1T+0.75ELATERAL)
Group VI =1.25(0.75*D +0.75EVERTICAL+ 1L+LS +0.3W+1WL+1T+0.75ELATERAL +1LF)
The minimum axial load and corresponding moment are
∑V= Pu= 15.68 kips/ft see Table
∑M = Mu= 95.51 ft- kips/ft see Table
The maximum moment and corresponding axial load are](https://image.slidesharecdn.com/3f2a44db-1d80-49e7-ae93-9cce7e06d379-150402132200-conversion-gate01/85/Capstone-project-88-320.jpg)
![Prepared by: Dawit Bogale Submitted to: Dave Mukerman
Capstone project 2012
88
∑V= Pu= 23.78 kips/ft see Table
∑M = Mu= 119.34 ft- kips/ft see Table
The maximum shear is
∑H= Vu= 14.06 kips/ft see Table
Determine the maximum axial load and minimum moment with a 2 in eccentricity toward the
stem rear face from the bearing point. [AASHTO Table 3.22.1A]
βD = 1 because of designing members for maximum axial load and minimum moment, and
βE = 1 for vertical earth pressure
βE = 0.75 for lateral earth pressure.
Group I =1.3(1D +1EVERTICAL+ 1.67(L+LS) +1.3ELATERAL)
Group II =1.3(1D +1EVERTICAL+ 1W +1.3ELATERAL)
Group III =1.3(1D +1EVERTICAL+ 1L+LS+0.3W+1WL+1.3ELATERAL +1LF)
Group IV =1.3(1D +1EVERTICAL +1L+LS +1T+1.3ELATERAL)
Group V =1.25(1D +1EVERTICAL+ 1W +1T+1.3ELATERAL)
Group VI =1.25(1D +1EVERTICAL+ 1L+LS +0.3W+1WL+1T+1.3ELATERAL +1LF)
The maximum axial load and corresponding moment are
∑V= Pu= 35.97 kips/ft see Table
∑M = Mu= 110.94 ft- kips/ft see Table
The minimum moment and corresponding axial load are
∑V= Pu= 21.22 kips/ft see Table
∑M = Mu= 54.82 ft- kips/ft see Table
The maximum shear is
∑H= Vu= 14.06 kips/ft see Table](https://image.slidesharecdn.com/3f2a44db-1d80-49e7-ae93-9cce7e06d379-150402132200-conversion-gate01/85/Capstone-project-89-320.jpg)
![Prepared by: Dawit Bogale Submitted to: Dave Mukerman
Capstone project 2012
91
Design for stem f’c= 3000 lbf/in2
and Fy= 60000lbf/in2
Reinforcement for stem will be designed for bending only as a singly reinforced beam. The
section will then be checked for combined axial force and bending, neglecting the front faces
reinforcing steel.
Use d= 32in – 3 in cover – 0.5 in for ½ steel assumed= 28.5 in
d’’ =(32/2)-3.5 = 12.5 in
⍺= ((As*60)/(0.85*3*12)) = 1.96As
⍺/2 = 0.98As
Mu = ΦMn = ΦAsFy(d-(⍺/2))
119.34ft-kips*12in/ft = 0.9*As*60*(28.5-0.98As)
As2
– 29.08As + 27.06 = 0
As= 28.12 in2
or 0.96 in2
As= 0.96 in2/ft
Try #8@9 in, As= 1.05 in2
ρ= 0.96/12*28.5 = 0.0028[<ρmax = 0.016 ok]
Use, #8@ 9 in, As= 1.05 in
Check for the combined axial force and bending.
The AASHTO equations for pure compression and balanced conditions neglect the slight change
of location for plastic centroid when compression steel is used. The footing and wing walls brace
the abutment stem, so slenderness effects will not have to be considered.
[AASHTO 8.16.4.2.1, Equation 8-31 & 8-30]
For pure compression (As=Ast),](https://image.slidesharecdn.com/3f2a44db-1d80-49e7-ae93-9cce7e06d379-150402132200-conversion-gate01/85/Capstone-project-92-320.jpg)
![Prepared by: Dawit Bogale Submitted to: Dave Mukerman
Capstone project 2012
92
ΦPo= Φ(0.85*f’c*(Ag-Ast)+Ast*Fy)
= Φ (0.85*f’c*(Ag-Ast)+Ast*Fy)
= 0.7[0.85*3[12*32-1.05] + 1.05*60]
= 715.49 kips/ft
ΦPn(max)= 0.8*715.49 = 572.39 kips/ft [0.8 is the minimum eccentricity for a tied column]
[AASHTO 8.16.4.2.3, Equation 8-32 & 8-33]
For balanced conditions,
ΦPb= Φ(0.85*f’c*b*ab +Asf’s - Ast*Fy)
ΦMb= (0.85*f’c*b*ab[d - d’’- (ab/2)] +A’s*f’s[d- d’ – d’’] + As*Fy*d’’)
ab= (87000/(87000+Fy))β1d [AASHTO Equation 8-34]
fs= 87000(1-(d’/d)[(8700+Fy)/87000]) ≤ Fy
As= 1.05 in2
A’s= f’s=0 [assumed a singly reinforced stem section]
ab = (87000/(87000+60000)*0.85*28.5
= 14.34 in
ΦPb= 0.7*(0.85*3*12*14.34 +0 – 1.05*60)
= 263.06 kips/ft.
ΦMb= (0.85*f’c*b*ab[d - d’’- (ab/2)] +A’s*f’s[d- d’ – d’’] + As*Fy*d’’)
= 0.7(0.85*3*12*14.34*(28.5-12.5- (14.34/2)) + 1.05*60*12.5)
= 3263.5in- kips/ft
[AASHTO 8.16.4.2.2, Equation 8-16 &17]
For pure bending,](https://image.slidesharecdn.com/3f2a44db-1d80-49e7-ae93-9cce7e06d379-150402132200-conversion-gate01/85/Capstone-project-93-320.jpg)
![Prepared by: Dawit Bogale Submitted to: Dave Mukerman
Capstone project 2012
93
⍺= AsFy/0.85*f’c*b = 1.05*60/0.85*3*12 = 2.06 in
⍺/2 = 1.03 in
ΦMn = 0.9*1.05*60*(28.5-0.75)/12
= 131.12 ft-kips/ft
Check minimum steel for bending
The transformed area is
(n-1)*As= (9-1)*1.05 = 8.4 in2
Ac +As = 12*32 + 8.4 = 392.4 in2
Taking moment about the bottom and solving the equation,
392.4*yb = 384*16 + 8.4*3.5
yb = 15.73 in from bottom
The moment of inertia about the neutral axis is
Icg= (1/12)(12*323
) + 384*(16-15.73)2
+ 4.96*(15.73 – 3.5)2
= 34052.41 in4
fr=modulus of rupture= 7.5(√fc') = 7.5(√3000) =410.79 lbf/in2
Mcr = fr*I/ c = (0.411*34052.41/15.73) /(12) = 74.14 ft-kips/ft
1.2Mcr = 1.2*74.14 = 88.97 ft-kips/ft [< ΦMn = 131.12 ft- kips/ft, ok]
Use #8@9 in, As= 1.05 in2
Check for shear in the stem. The ultimate shear capacity without shear reinforcement is
ΦVc=Φ*2(√fc') *bw*d
= 0.85*2(√3000) *12*28.5 in
= 31844.59 lbf/ft
= 31.84 kips/ft](https://image.slidesharecdn.com/3f2a44db-1d80-49e7-ae93-9cce7e06d379-150402132200-conversion-gate01/85/Capstone-project-94-320.jpg)
![Prepared by: Dawit Bogale Submitted to: Dave Mukerman
Capstone project 2012
94
[> ∑H for group I loading (=14.06 kips/ft), ok]
Determine temperature and shrinkage reinforcement
[AASHTO 8.20.1] Reinforcement should be provided near exposed surfaces not otherwise
reinforced. The area provided shall be As (temperature and shrinkage)= 0.125 in2/ft. in each
direction.
Use # 4@ 15 in (As= 0.16 in2
).
Fig. 12 shows the abutment reinforcement detail.](https://image.slidesharecdn.com/3f2a44db-1d80-49e7-ae93-9cce7e06d379-150402132200-conversion-gate01/85/Capstone-project-95-320.jpg)
![Prepared by: Dawit Bogale Submitted to: Dave Mukerman
Capstone project 2012
97
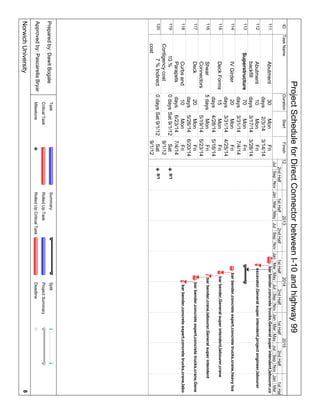
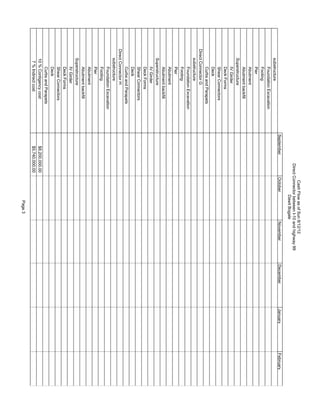
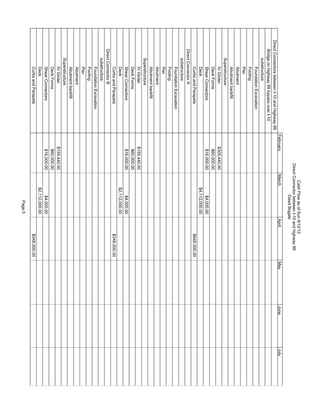
Project Management
“Project management has five process groups as mentioned in PMBOK Gide, namely: project
initiation, project planning, project execution, project monitoring and control, and project
closure.” [7] Success of any project depends upon how best the activities are managed from
conception till completion. To be successful in a project management, a project manager must
achieve the project objectives by managing the four basic elements of a project: resource, time,
money, and scope. Hence, to manage this direct connector project, the assigned project manager
has to manage by combing effectively the following key elements:
Resources: people, equipment, material
Time: task durations, dependencies, critical path
Money: costs, contingencies, profit
Scope: project size, goals, requirements
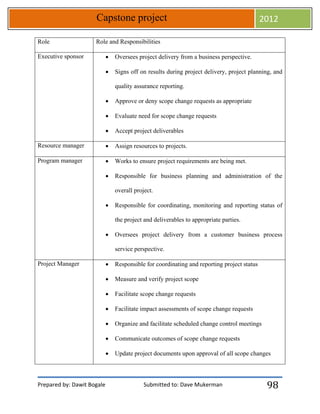
4.1. Project Scope Management
Project scope management clearly defines all roles and responsibilities. For this direct connector
project the role and responsibilities of the Executives Sponsors, Resource Manager, Program
Manager, Project Manager, Customer Service, Team Leader, and Project Team is defined as
shown below which plays key roles in managing the scope of this project. All the teams and
responsible personnel must be aware of their responsibilities in order to ensure that work
performed on the project is within the established scope throughout the entire duration of the
project.
The following table summarizes the roles and responsibilities of the scope management of this
project.](https://image.slidesharecdn.com/3f2a44db-1d80-49e7-ae93-9cce7e06d379-150402132200-conversion-gate01/85/Capstone-project-98-320.jpg)
![Prepared by: Dawit Bogale Submitted to: Dave Mukerman
Capstone project 2012
99
Customer
representative
Attend design sessions
Review and comment on draft system.
Participate as needed in other project related meetings.
Team Lead Measure and verify project scope
Validate scope change requests
Participate in impact assessments of scope change requests
Communicate outcomes of scope change requests to team
Facilitate team level change review process
Team Member Participate in defining change resolutions
Evaluate the need for scope changes and communicate them to the
project manager as necessary
The Project Manager, Sponsor and Stakeholders will establish and approve documentation for
measuring project scope which includes deliverable quality checklists and work performance
measurements. Proposed scope changes may be initiated by the Project Manager, Stakeholders or
any member of the project team. The Project Manager will submit the scope change request to
the Change Control Board and Project Sponsor for acceptance. After approval of scope changes,
the Project Manager will update all project documents and communicate the scope change to all
stakeholders. The Project Sponsor is responsible for the acceptance of the final project
deliverables and project scope. [6]
4.1.1 Define Scope
The scope of the project management in the Direct Connector between I-10 and highway 99
Bridge project includes:](https://image.slidesharecdn.com/3f2a44db-1d80-49e7-ae93-9cce7e06d379-150402132200-conversion-gate01/85/Capstone-project-100-320.jpg)
![Prepared by: Dawit Bogale Submitted to: Dave Mukerman
Capstone project 2012
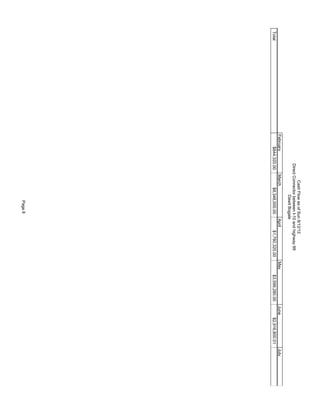
101
important for project manager and project team because it provides the basis for planning and
managing project schedules, costs, resources, and changes. In WBS, project team will know what
is expected from them and will see their big picture, and where their portions of the project. If
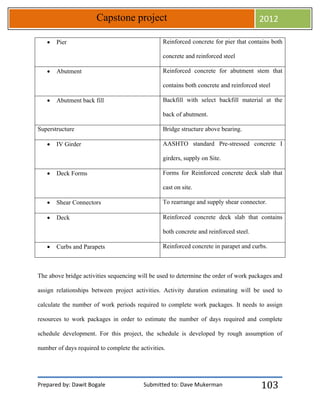
the whole team acts together, it reduces or eliminate that could cause change. Hence, WBS will
make better quality, easier management, and everyone see the whole project. [7]
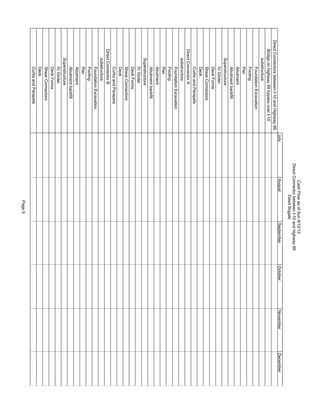
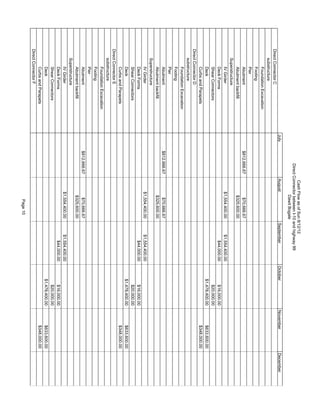
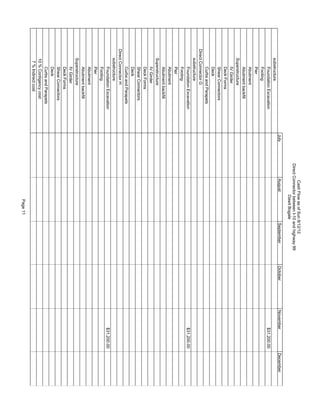
Description Represent
Bridge Work Break down structure
substructure A
Foundation Excavation A.1
Footing A.2
Pier A.3
Abutment A.4
Abutment back fill A.5
Superstructure B
IV Girder B.1
Deck Forms B.2
Shear Connectors B.3
Deck B.4
Curbs and Parapets B.5](https://image.slidesharecdn.com/3f2a44db-1d80-49e7-ae93-9cce7e06d379-150402132200-conversion-gate01/85/Capstone-project-102-320.jpg)
![Prepared by: Dawit Bogale Submitted to: Dave Mukerman
Capstone project 2012
102
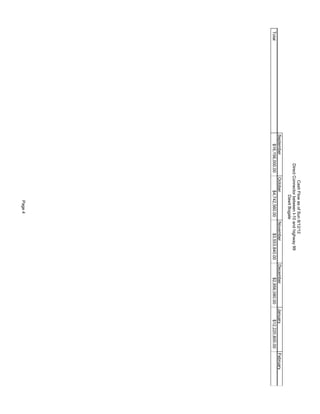
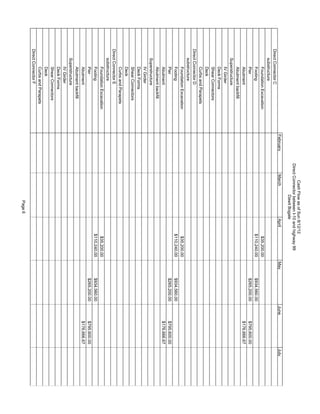
4.2. Project Time Management
In this capstone project, project time management of bridge demands that manager to reorient all
the resources in such a way that the project is completed without any time/cost overrun. Project
Schedule is prepared based Critical Path Method (CPM) along with major milestone and Bar
Charts. [7] The project schedule is an important part of any project as they provide the project
team, sponsor, and stakeholders a picture of the project’s status at any given time.
Using work break down structure created previously, the project schedules is prepared with MS
Project 2007. After developing a preliminary project schedule, it will be reviewed by the project
team and any resources assigned to project tasks. The project team and resources must agree to
the proposed work package assignments, durations, and schedule. Once this is achieved the
project sponsor will review and approve the schedule and it will then be base lined.
4.2.1 Define Activities, Sequence Activities, and develop schedule
The project manager will be responsible for facilitating work package definition, sequencing, and
estimating duration and resources with the project team. The activities listed in this capstone
bridge project are mentioned as follows:
Activities Definition
Bridge Work Break down structure
substructure Structure below the bearing of bridge
Foundation Excavation Excavation and disposal of Unsuitable Material
in and below confined excavations
Footing Reinforced concrete for foundation that
contains both concrete and reinforced steel](https://image.slidesharecdn.com/3f2a44db-1d80-49e7-ae93-9cce7e06d379-150402132200-conversion-gate01/85/Capstone-project-103-320.jpg)
![Prepared by: Dawit Bogale Submitted to: Dave Mukerman
Capstone project 2012
104
The project is scheduled using MS Project 2007 and validate the schedule with the project team,
stakeholders, and the project sponsor. The project team is responsible for participating in work
package definition, sequencing, and duration and resource estimating.
4.2.2 Schedule Changes and Thresholds
In this project the threshold limit are set by the project sponsor to establish the schedule
parameters within which the project is expected to operate. The activities which may potentially
cause a schedule change which exceeds these boundary conditions must have a schedule change
request submitted and approved by the sponsor before the schedule change is made. Any change
requests that do not meet these thresholds may be submitted to the project manager for approval.
Once the change request has been reviewed and approved the project manager is responsible for
adjusting the schedule and communicating all changes and impacts to the project team, project
sponsor, and stakeholders. [6]
4.2.3 Schedule Control
In this project, the status of the project will be reviewed and raised in the meeting on a bi-weekly
basis reporting schedule status in accordance with the project’s communications plan. The
project sponsor will maintain awareness of the project schedule status and review/approve any
schedule change requests submitted by the project manager.[6]](https://image.slidesharecdn.com/3f2a44db-1d80-49e7-ae93-9cce7e06d379-150402132200-conversion-gate01/85/Capstone-project-105-320.jpg)
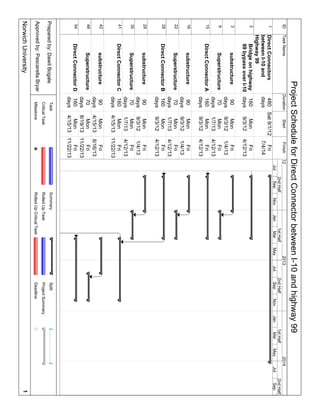
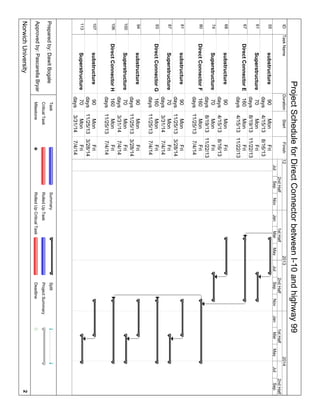
![Prepared by: Dawit Bogale Submitted to: Dave Mukerman
Capstone project 2012
107
4.3. Project Cost Management plan
The project cost management plan clearly defines how the costs on a project will be managed
throughout the project’s lifecycle. It sets the format and standards by which the project costs are
measured, reported and controlled. In this project as one of government work the manager will
get his budget fixed on monthly basis and performance will be measured using earned
value. The Project Manager is responsible for accounting for cost deviations and presenting the
Project Sponsor with options for getting the project back on budget. [7]
4.3.1 Estimate Cost
The project cost is estimated using the amount of resources required to accomplish the work
required to be performed. For this project, it needs a lot of cost to find out the cost estimation
based on output and current market condition. However, from the previous similar projects,
rough work is done as shown in the Table.
4.3.2 Project Budget
The budget for this project is detailed below. It includes fixed Costs, Material Costs, total
Project Cost, and management Reserve (7 % indirect costs and 10% contingency costs). This
project expected to receives fund from the federal and state highway administrations. Table 16
shows Project Budget in the next page.](https://image.slidesharecdn.com/3f2a44db-1d80-49e7-ae93-9cce7e06d379-150402132200-conversion-gate01/85/Capstone-project-108-320.jpg)
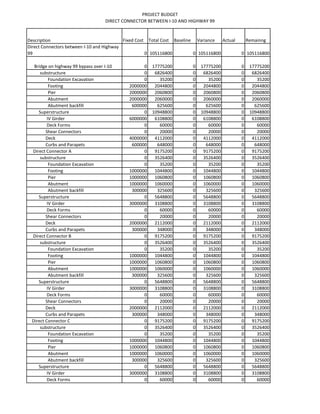
![Prepared by: Dawit Bogale Submitted to: Dave Mukerman
Capstone project 2012
111
4.3.3 Project Cost and Schedule Performance
Using Microsoft project Earned Value measurements, Schedule Variance (SV), Cost Variance
(CV), Schedule Performance Index (SPI) and Cost Performance Index (CPI), will be performed
to check the status. Appling these four measurements will provide enough insight for effective
management. Cost variances of +/- 0.1 in the cost and schedule performance indexes will change
the status of the cost to cautionary; since cost variances of +/- 0.2 in the cost and schedule
performance indexes will change the status of the cost to an alert stage, it will require corrective
action from the Project Manager in order to bring the cost and/or schedule performance indexes
below the alert level.[6]
Schedule Variance (SV) is a measurement of the schedule performance for a project. It’s
calculated by taking the Earned Value (EV) and subtracting the Planned Value (PV).
If SV is zero, then the project is perfectly on schedule.
If SV is greater than zero, the project is earning more value than planned thus it’s ahead
of schedule.
If SV is less than zero, the project is earning less value than planned thus it’s behind
schedule.
Cost Variance (CV) is a measurement of the budget performance for a project. CV is calculated
by subtracting Actual Costs (AC) from Earned Value (EV).
If CV is zero, then the project is perfectly on budget.
If CV is greater than zero, the project is earning more value than planned thus it’s under
budget.
If CV is less than zero, the project is earning less value than planned thus it’s over](https://image.slidesharecdn.com/3f2a44db-1d80-49e7-ae93-9cce7e06d379-150402132200-conversion-gate01/85/Capstone-project-112-320.jpg)
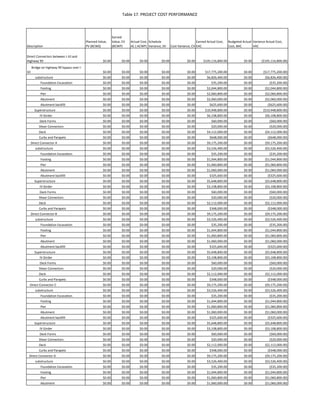
![Prepared by: Dawit Bogale Submitted to: Dave Mukerman
Capstone project 2012
115
4.4. Project Quality Management
The Quality Management Plan is an integral part of any project management plan. The purpose of the
Quality Management Plan is to describe how quality will be managed throughout the lifecycle of the
project. It ensures quality planning, assurance, and controls are all conducted [7]. All stakeholders should
be familiar with how quality will be planned, assured, and controlled. Training to staff should be provided
to update the quality control measure and it should become part of the work culture. At site laboratory be
established to check the quality of concrete. Tests are analyzed at site to produce the concrete of desirable
strength. Compaction of concrete is given more attention before final setting. Quality assurance on ground
improves the aesthetic of structures and must always be planned into a project in order to prevent
unnecessary rework, waste, cost, and time. The Texas department of transportation has a standardized
approach to quality; however, the approach must be defined and communicated to all project responsible
personnel’s.
4.4.1 Quality Control Measurements
In this project Quality Management Plan should contain a sample or useable table/log to be used in taking
tests and comparing them against Texas department of transportation standards/requirements. The most
important aspect of this log is to provide documentation of the findings. If actual measurements do not
meet the standards or requirements then some action must be taken.
4.5. Project Human Resource Management
Manager should put the engineers or responsible personnel’s to activities they can perform
better. The characteristic of each individual should be studied in detail to assign the suitable job.
The project is full of staff that will collect data, design the project, and construct the project.
There will be an office on the site equipped with computer, meeting halls, and required facility as
required by specification. It should provide a general description of what the plan includes and](https://image.slidesharecdn.com/3f2a44db-1d80-49e7-ae93-9cce7e06d379-150402132200-conversion-gate01/85/Capstone-project-116-320.jpg)
![Prepared by: Dawit Bogale Submitted to: Dave Mukerman
Capstone project 2012
116
explain how the project manager and project team can use the plan to help them manage the
project effectively.
In the human resources management plan, the project will use MS- project as a tool to aid in the
management of the project’s human resource activities throughout the project. Using project
organizational chart the Human Resource Plan provides a graphic display of the project tasks and
team members. The project manager will review each team member’s assigned work activities at
the onset of the project and communicate all expectations of work to be performed.
4.6. Project Communication Management
The purpose of the Communications Management Plan is to define the communication
requirements for the project and how information will be distributed [7]. In this project, there
should be good communication between the client, contractor and consultant for solving
problems that would occur throughout design or construction stage.
Most of a Project Manager’s time is spent communication. To communicate well in this project,
the project manager spent his time measuring and reporting on the performance of the project,
composing and reading emails, conducting meetings, writing the project plan, meeting with team
members, overseeing work being performed. It will serve as a guide for communications
throughout the life of the project and will be updated as communication needs change. Project
communication conducts meeting twice a month. It has a guide that explains communications
rules and how the meetings will be conducted, ensuring successful meetings. As a Project
Manager, it is best to take a proactive role in ensuring effective communications on this project.
4.7. Risk Management
The purpose of the risk management plan is to establish the framework in which the project team](https://image.slidesharecdn.com/3f2a44db-1d80-49e7-ae93-9cce7e06d379-150402132200-conversion-gate01/85/Capstone-project-117-320.jpg)
![Prepared by: Dawit Bogale Submitted to: Dave Mukerman
Capstone project 2012
117
will identify risks and develop strategies to mitigate or avoid those risks [7]. Risk managers will
provide status updates on their assigned risks in the bi-weekly project team meetings. In order to
determine the severity of the risks identified, a probability and impact factor was assigned to
each risk. During the bi-weekly project team meeting the Risk Manager for each risk will discuss
the status of that risk. Each risk manager will provide the status of their assigned risk at the bi-
weekly project team meeting for their risk’s planned timeframe.
4.8. Project Procurement Management
The purpose of the Procurement Management Plan is to define the procurement requirements for
the project and how it will be managed from developing procurement documentation through
contract closure. Better documentation will avoid any disputes during the currency and after
completion of contract. The Procurement Management Plan defines items to be procured with
justification statements and timelines, type of contract to be used, contract approval process,
decision criteria, establishing contract deliverables and deadlines, vendor Management, and
performance metrics for procurement activities. It will serve as a guide for managing
procurement throughout the life of the project and will be updated as acquisition needs change. It
clearly identifies the necessary steps and responsibilities for procurement from the beginning to
the end of a project [7].](https://image.slidesharecdn.com/3f2a44db-1d80-49e7-ae93-9cce7e06d379-150402132200-conversion-gate01/85/Capstone-project-118-320.jpg)
![IDTaskNameDurationStartFinish
1DirectConnectors
betweenI-10and
Highway99
480
days
Sat9/1/12Fri
7/4/14
2Bridgeonhighway
99bypassoverI-10
160
days
Mon
9/3/12
Fri
4/12/13
3substructure90
days
Mon
9/3/12
Fri
1/4/13
4Foundation
Excavation
10
days
Mon
9/3/12
Fri
9/14/12
5Footing20
days
Mon
9/17/12
Fri
10/12/12
6Pier20
days
Mon
10/15/12
Fri
11/9/12
7Abutment30
days
Mon
11/12/12
Fri
12/21/12
8Abutment
backfill
10
days
Mon
12/24/12
Fri
1/4/13
9Superstructure70
days
Mon
1/7/13
Fri
4/12/13
10IVGirder20
days
Mon
1/7/13
Fri
2/1/13
11DeckForms15
days
Mon
2/4/13
Fri
2/22/13
12Shear
Connectors
5daysMon
2/25/13
Fri
3/1/13
13Deck20
days
Mon
3/4/13
Fri
3/29/13
14Curbsand
Parapets
10
days
Mon
4/1/13
Fri
4/12/13
excavator[200%],Generalsuperintendent,labourer[500%],siteengineer,Trucks[350%]
barbender[300%],concreteexpert[300%],concretetrucks[300%],Generalsuperintendent,projectengineer
barbender,concreteexpert,concretetrucks,Generalsuperintendent,heavyloadtrucks,siteengineer
barbender,concretetrucks,Generalsuperintendent,labourer,concreteexpert
excavator,Generalsuperintendent,projectengineer,labourer
barbender,concreteexpert,concretetrucks,crane,heavyloadtrucks
barbender,Generalsuperintendent,labourer,crane
barbender,crane,labourer,Generalsuperintendent
barbender,concreteexpert,concretetrucks,crane,Generalsuperintendent,labourer,projecte
barbender,concreteexpert,concretetrucks,crane,labourer
JulSepNovJanMarMayJulSepNovJanMarMayJulSepNovJanMarMayJulSepNovJanMar
2ndHalf1stHalf2ndHalf1stHalf2ndHalf1stHalf2ndHalf1stHal
12201320142015
Task
CriticalTask
Milestone
Summary
RolledUpTask
RolledUpCriticalTask
Split
ProjectSummary
Deadline
ProjectScheduleforDirectConnectorbetweenI-10andhighway99
NorwichUniversity1
Preparedby:DawitBogale
Approvedby:PascarellaBryan](https://image.slidesharecdn.com/3f2a44db-1d80-49e7-ae93-9cce7e06d379-150402132200-conversion-gate01/85/Capstone-project-122-320.jpg)
![IDTaskNameDurationStartFinish
15DirectConnectorA160
days
Mon
9/3/12
Fri
4/12/13
16substructure90
days
Mon
9/3/12
Fri
1/4/13
17Foundation
Excavation
10
days
Mon
9/3/12
Fri
9/14/12
18Footing20
days
Mon
9/17/12
Fri
10/12/12
19Pier20
days
Mon
10/15/12
Fri
11/9/12
20Abutment30
days
Mon
11/12/12
Fri
12/21/12
21Abutment
backfill
10
days
Mon
12/24/12
Fri
1/4/13
22Superstructure70
days
Mon
1/7/13
Fri
4/12/13
23IVGirder20
days
Mon
1/7/13
Fri
2/1/13
24DeckForms15
days
Mon
2/4/13
Fri
2/22/13
25Shear
Connectors
5daysMon
2/25/13
Fri
3/1/13
26Deck20
days
Mon
3/4/13
Fri
3/29/13
27Curbsand
Parapets
10
days
Mon
4/1/13
Fri
4/12/13
28DirectConnectorB160
days
Mon
9/3/12
Fri
4/12/13
29substructure90
days
Mon
9/3/12
Fri
1/4/13
30Foundation
Excavation
10
days
Mon
9/3/12
Fri
9/14/12
excavator[200%],Generalsuperintendent,labourer[500%],siteengineer,Trucks[350%]
barbender[300%],concreteexpert[300%],concretetrucks[300%],Generalsuperintendent,projectengineer
barbender,concreteexpert,concretetrucks,Generalsuperintendent,heavyloadtrucks,siteengineer
barbender,concretetrucks,Generalsuperintendent,labourer,concreteexpert
excavator,Generalsuperintendent,projectengineer,labourer
barbender,concreteexpert,concretetrucks,crane,heavyloadtrucks
barbender,Generalsuperintendent,labourer,crane
barbender,crane,labourer,Generalsuperintendent
barbender,concreteexpert,concretetrucks,crane,Generalsuperintendent,labourer,projecte
barbender,concreteexpert,concretetrucks,crane,labourer
excavator[200%],Generalsuperintendent,labourer[500%],siteengineer,Trucks[350%]
JulSepNovJanMarMayJulSepNovJanMarMayJulSepNovJanMarMayJulSepNovJanMar
2ndHalf1stHalf2ndHalf1stHalf2ndHalf1stHalf2ndHalf1stHal
12201320142015
Task
CriticalTask
Milestone
Summary
RolledUpTask
RolledUpCriticalTask
Split
ProjectSummary
Deadline
ProjectScheduleforDirectConnectorbetweenI-10andhighway99
NorwichUniversity2
Preparedby:DawitBogale
Approvedby:PascarellaBryan](https://image.slidesharecdn.com/3f2a44db-1d80-49e7-ae93-9cce7e06d379-150402132200-conversion-gate01/85/Capstone-project-123-320.jpg)
![IDTaskNameDurationStartFinish
31Footing20
days
Mon
9/17/12
Fri
10/12/12
32Pier20
days
Mon
10/15/12
Fri
11/9/12
33Abutment30
days
Mon
11/12/12
Fri
12/21/12
34Abutment
backfill
10
days
Mon
12/24/12
Fri
1/4/13
35Superstructure70
days
Mon
1/7/13
Fri
4/12/13
36IVGirder20
days
Mon
1/7/13
Fri
2/1/13
37DeckForms15
days
Mon
2/4/13
Fri
2/22/13
38Shear
Connectors
5daysMon
2/25/13
Fri
3/1/13
39Deck20
days
Mon
3/4/13
Fri
3/29/13
40Curbsand
Parapets
10
days
Mon
4/1/13
Fri
4/12/13
41DirectConnectorC160
days
Mon
4/15/13
Fri
11/22/13
42substructure90
days
Mon
4/15/13
Fri
8/16/13
43Foundation
Excavation
10
days
Mon
4/15/13
Fri
4/26/13
44Footing20
days
Mon
4/29/13
Fri
5/24/13
45Pier20
days
Mon
5/27/13
Fri
6/21/13
46Abutment30
days
Mon
6/24/13
Fri
8/2/13
barbender[300%],concreteexpert[300%],concretetrucks[300%],Generalsuperintendent,projectengineer
barbender,concreteexpert,concretetrucks,Generalsuperintendent,heavyloadtrucks,siteengineer
barbender,concretetrucks,Generalsuperintendent,labourer,concreteexpert
excavator,Generalsuperintendent,projectengineer,labourer
barbender,concreteexpert,concretetrucks,crane,heavyloadtrucks
barbender,Generalsuperintendent,labourer,crane
barbender,crane,labourer,Generalsuperintendent
barbender,concreteexpert,concretetrucks,crane,Generalsuperintendent,labourer,projecte
barbender,concreteexpert,concretetrucks,crane,labourer
excavator[200%],Generalsuperintendent,labourer[500%],siteengineer,Trucks[350%]
barbender[300%],concreteexpert[300%],concretetrucks[300%],Generalsuperintendent
barbender,concreteexpert,concretetrucks,Generalsuperintendent,heavyloadtrucks
barbender,concretetrucks,Generalsuperintendent,labourer,concreteexpert
JulSepNovJanMarMayJulSepNovJanMarMayJulSepNovJanMarMayJulSepNovJanMar
2ndHalf1stHalf2ndHalf1stHalf2ndHalf1stHalf2ndHalf1stHal
12201320142015
Task
CriticalTask
Milestone
Summary
RolledUpTask
RolledUpCriticalTask
Split
ProjectSummary
Deadline
ProjectScheduleforDirectConnectorbetweenI-10andhighway99
NorwichUniversity3
Preparedby:DawitBogale
Approvedby:PascarellaBryan](https://image.slidesharecdn.com/3f2a44db-1d80-49e7-ae93-9cce7e06d379-150402132200-conversion-gate01/85/Capstone-project-124-320.jpg)
![IDTaskNameDurationStartFinish
47Abutment
backfill
10
days
Mon
8/5/13
Fri
8/16/13
48Superstructure70
days
Mon
8/19/13
Fri
11/22/13
49IVGirder20
days
Mon
8/19/13
Fri
9/13/13
50DeckForms15
days
Mon
9/16/13
Fri
10/4/13
51Shear
Connectors
5daysMon
10/7/13
Fri
10/11/13
52Deck20
days
Mon
10/14/13
Fri
11/8/13
53Curbsand
Parapets
10
days
Mon
11/11/13
Fri
11/22/13
54DirectConnectorD160
days
Mon
4/15/13
Fri
11/22/13
55substructure90
days
Mon
4/15/13
Fri
8/16/13
56Foundation
Excavation
10
days
Mon
4/15/13
Fri
4/26/13
57Footing20
days
Mon
4/29/13
Fri
5/24/13
58Pier20
days
Mon
5/27/13
Fri
6/21/13
59Abutment30
days
Mon
6/24/13
Fri
8/2/13
60Abutment
backfill
10
days
Mon
8/5/13
Fri
8/16/13
61Superstructure70
days
Mon
8/19/13
Fri
11/22/13
62IVGirder20
days
Mon
8/19/13
Fri
9/13/13
excavator,Generalsuperintendent,projectengineer,labourer
barbender,concreteexpert,concretetrucks,crane,heavyloadtrucks
barbender,Generalsuperintendent,labourer,crane
barbender,crane,labourer,Generalsuperintendent
barbender,concreteexpert,concretetrucks,crane,Generalsuperintendent
barbender,concreteexpert,concretetrucks,crane,labourer
excavator[200%],Generalsuperintendent,labourer[500%],siteengineer,Trucks[350%]
barbender[300%],concreteexpert[300%],concretetrucks[300%],Generalsuperintendent
barbender,concreteexpert,concretetrucks,Generalsuperintendent,heavyloadtrucks
barbender,concretetrucks,Generalsuperintendent,labourer,concreteexpert
excavator,Generalsuperintendent,projectengineer,labourer
barbender,concreteexpert,concretetrucks,crane,heavyloadtrucks
JulSepNovJanMarMayJulSepNovJanMarMayJulSepNovJanMarMayJulSepNovJanMar
2ndHalf1stHalf2ndHalf1stHalf2ndHalf1stHalf2ndHalf1stHal
12201320142015
Task
CriticalTask
Milestone
Summary
RolledUpTask
RolledUpCriticalTask
Split
ProjectSummary
Deadline
ProjectScheduleforDirectConnectorbetweenI-10andhighway99
NorwichUniversity4
Preparedby:DawitBogale
Approvedby:PascarellaBryan](https://image.slidesharecdn.com/3f2a44db-1d80-49e7-ae93-9cce7e06d379-150402132200-conversion-gate01/85/Capstone-project-125-320.jpg)
![IDTaskNameDurationStartFinish
63DeckForms15
days
Mon
9/16/13
Fri
10/4/13
64Shear
Connectors
5daysMon
10/7/13
Fri
10/11/13
65Deck20
days
Mon
10/14/13
Fri
11/8/13
66Curbsand
Parapets
10
days
Mon
11/11/13
Fri
11/22/13
67DirectConnectorE160
days
Mon
4/15/13
Fri
11/22/13
68substructure90
days
Mon
4/15/13
Fri
8/16/13
69Foundation
Excavation
10
days
Mon
4/15/13
Fri
4/26/13
70Footing20
days
Mon
4/29/13
Fri
5/24/13
71Pier20
days
Mon
5/27/13
Fri
6/21/13
72Abutment30
days
Mon
6/24/13
Fri
8/2/13
73Abutment
backfill
10
days
Mon
8/5/13
Fri
8/16/13
74Superstructure70
days
Mon
8/19/13
Fri
11/22/13
75IVGirder20
days
Mon
8/19/13
Fri
9/13/13
76DeckForms15
days
Mon
9/16/13
Fri
10/4/13
77Shear
Connectors
5daysMon
10/7/13
Fri
10/11/13
78Deck20
days
Mon
10/14/13
Fri
11/8/13
barbender,Generalsuperintendent,labourer,crane
barbender,crane,labourer,Generalsuperintendent
barbender,concreteexpert,concretetrucks,crane,Generalsuperintendent
barbender,concreteexpert,concretetrucks,crane,labourer
excavator[200%],Generalsuperintendent,labourer[500%],siteengineer,Trucks[350%]
barbender[300%],concreteexpert[300%],concretetrucks[300%],Generalsuperintendent
barbender,concreteexpert,concretetrucks,Generalsuperintendent,heavyloadtrucks
barbender,concretetrucks,Generalsuperintendent,labourer,concreteexpert
excavator,Generalsuperintendent,projectengineer,labourer
barbender,concreteexpert,concretetrucks,crane,heavyloadtrucks
barbender,Generalsuperintendent,labourer,crane
barbender,crane,labourer,Generalsuperintendent
barbender,concreteexpert,concretetrucks,crane,Generalsuperintendent
JulSepNovJanMarMayJulSepNovJanMarMayJulSepNovJanMarMayJulSepNovJanMar
2ndHalf1stHalf2ndHalf1stHalf2ndHalf1stHalf2ndHalf1stHal
12201320142015
Task
CriticalTask
Milestone
Summary
RolledUpTask
RolledUpCriticalTask
Split
ProjectSummary
Deadline
ProjectScheduleforDirectConnectorbetweenI-10andhighway99
NorwichUniversity5
Preparedby:DawitBogale
Approvedby:PascarellaBryan](https://image.slidesharecdn.com/3f2a44db-1d80-49e7-ae93-9cce7e06d379-150402132200-conversion-gate01/85/Capstone-project-126-320.jpg)
![IDTaskNameDurationStartFinish
79Curbsand
Parapets
10
days
Mon
11/11/13
Fri
11/22/13
80DirectConnectorF160
days
Mon
11/25/13
Fri
7/4/14
81substructure90
days
Mon
11/25/13
Fri
3/28/14
82Foundation
Excavation
10
days
Mon
11/25/13
Fri
12/6/13
83Footing20
days
Mon
12/9/13
Fri
1/3/14
84Pier20
days
Mon
1/6/14
Fri
1/31/14
85Abutment30
days
Mon
2/3/14
Fri
3/14/14
86Abutment
backfill
10
days
Mon
3/17/14
Fri
3/28/14
87Superstructure70
days
Mon
3/31/14
Fri
7/4/14
88IVGirder20
days
Mon
3/31/14
Fri
4/25/14
89DeckForms15
days
Mon
4/28/14
Fri
5/16/14
90Shear
Connectors
5daysMon
5/19/14
Fri
5/23/14
91Deck20
days
Mon
5/26/14
Fri
6/20/14
92Curbsand
Parapets
10
days
Mon
6/23/14
Fri
7/4/14
93DirectConnectorG160
days
Mon
11/25/13
Fri
7/4/14
94substructure90
days
Mon
11/25/13
Fri
3/28/14
barbender,concreteexpert,concretetrucks,crane,labourer
excavator[200%],Generalsuperintendent,labourer[500%],siteengineer,T
barbender[300%],concreteexpert[300%],concretetrucks[300%],Gene
barbender,concreteexpert,concretetrucks,Generalsuperintenden
barbender,concretetrucks,Generalsuperintendent,labourer,co
excavator,Generalsuperintendent,projectengineer,labourer
barbender,concreteexpert,concretetrucks,crane,heavyloa
barbender,Generalsuperintendent,labourer,crane
barbender,crane,labourer,Generalsuperintendent
barbender,concreteexpert,concretetrucks,crane,Gene
barbender,concreteexpert,concretetrucks,crane,labo
JulSepNovJanMarMayJulSepNovJanMarMayJulSepNovJanMarMayJulSepNovJanMar
2ndHalf1stHalf2ndHalf1stHalf2ndHalf1stHalf2ndHalf1stHal
12201320142015
Task
CriticalTask
Milestone
Summary
RolledUpTask
RolledUpCriticalTask
Split
ProjectSummary
Deadline
ProjectScheduleforDirectConnectorbetweenI-10andhighway99
NorwichUniversity6
Preparedby:DawitBogale
Approvedby:PascarellaBryan](https://image.slidesharecdn.com/3f2a44db-1d80-49e7-ae93-9cce7e06d379-150402132200-conversion-gate01/85/Capstone-project-127-320.jpg)
![IDTaskNameDurationStartFinish
95Foundation
Excavation
10
days
Mon
11/25/13
Fri
12/6/13
96Footing20
days
Mon
12/9/13
Fri
1/3/14
97Pier20
days
Mon
1/6/14
Fri
1/31/14
98Abutment30
days
Mon
2/3/14
Fri
3/14/14
99Abutment
backfill
10
days
Mon
3/17/14
Fri
3/28/14
100Superstructure70
days
Mon
3/31/14
Fri
7/4/14
101IVGirder20
days
Mon
3/31/14
Fri
4/25/14
102DeckForms15
days
Mon
4/28/14
Fri
5/16/14
103Shear
Connectors
5daysMon
5/19/14
Fri
5/23/14
104Deck20
days
Mon
5/26/14
Fri
6/20/14
105Curbsand
Parapets
10
days
Mon
6/23/14
Fri
7/4/14
106DirectConnectorH160
days
Mon
11/25/13
Fri
7/4/14
107substructure90
days
Mon
11/25/13
Fri
3/28/14
108Foundation
Excavation
10
days
Mon
11/25/13
Fri
12/6/13
109Footing20
days
Mon
12/9/13
Fri
1/3/14
110Pier20
days
Mon
1/6/14
Fri
1/31/14
excavator[200%],Generalsuperintendent,labourer[500%],siteengineer,
barbender[300%],concreteexpert[300%],concretetrucks[300%],Gene
barbender,concreteexpert,concretetrucks,Generalsuperintenden
barbender,concretetrucks,Generalsuperintendent,labourer,co
excavator,Generalsuperintendent,projectengineer,labourer
barbender,concreteexpert,concretetrucks,crane,heavyloa
barbender,Generalsuperintendent,labourer,crane
barbender,crane,labourer,Generalsuperintendent
barbender,concreteexpert,concretetrucks,crane,Gene
barbender,concreteexpert,concretetrucks,crane,labo
excavator[200%],Generalsuperintendent,labourer[500%],siteengineer,T
barbender[300%],concreteexpert[300%],concretetrucks[300%],Gene
barbender,concreteexpert,concretetrucks,Generalsuperintenden
JulSepNovJanMarMayJulSepNovJanMarMayJulSepNovJanMarMayJulSepNovJanMar
2ndHalf1stHalf2ndHalf1stHalf2ndHalf1stHalf2ndHalf1stHal
12201320142015
Task
CriticalTask
Milestone
Summary
RolledUpTask
RolledUpCriticalTask
Split
ProjectSummary
Deadline
ProjectScheduleforDirectConnectorbetweenI-10andhighway99
NorwichUniversity7
Preparedby:DawitBogale
Approvedby:PascarellaBryan](https://image.slidesharecdn.com/3f2a44db-1d80-49e7-ae93-9cce7e06d379-150402132200-conversion-gate01/85/Capstone-project-128-320.jpg)