2. International Journal of Management (IJM), ISSN 0976 – 6502(Print), ISSN 0976 –
6510(Online), Volume 4, Issue 1, January- February (2013)
is calculated to be between 0 and 1, as 1 representing efficient unit. In this research the
authors make use of DEA in cement industry to find out the Capital Structure Management
efficiency.
II. REVIEW OF LITERATURE
Chakraborty (2010) employed two performance measures, including ratio of profit
before interest, tax and depreciation to total assets and ratio of cash flows to total assets and
two leverage measures, including ratio of total borrowing to assets and ratio of liability and
equity, and reported a negative relation between these ones.
Ebaid (2009) investigates the impact of capital structure choice on performance of 64
firms from 1997-2005 in the Egyptian capital market. He employs three accounting –based
measures including ROA, ROE and gross profit margin, and concludes capital structure
choices, generally, has a weak –to- no impact on firm performance.
Ong Tze San and Boon Heng Teh (2011) focused on construction companies which
are listed in Main Board of Bursa Malaysia from 2005-2008, the result shows that there is a
relationship between capital structure and corporate performance and there is also evidence
that shows that no relationship between the variables have been investigated.
Puwanenthiren Pratheepkanth. (2011) analyzed the capital structure and its impact on
financial performance capacity during 2005 to 2009 of Business companies in Sri Lanka. The
results shown the relationship between the capital structure and financial performance is
negative.
Saad (2010). The argument about the capital structure started in the early of 1950
Chakra borty (2010) suggested that in the perfect market, financing strategies do not affect
the value of the firm, but later they argue that firm value can be increased by changing the
capital structure because of tax advantage of debts Modigliani and Miller (1963).
Ali Saeedi and Mahmoodi (2011)examines the relationship between capital structure
and firm performance the study used sample of 320 firms listed on Tehran Stock exchange
over the period 2002- 2009. Expect all of the financial companies and banks, the study uses
four performance measures (including ROA, ROE, EPS and Tobin’s Q) as dependent
variable and three capital structures (including long- term debt short –term debt and total debt
ratio) as independent variable. The study indicated that firm performances, which is measured
by EPS and Tobin’s Q, is significantly and positively associated with capital structure, while
reported a negative relation between capital structure and ROA, and no significant
relationship between ROE and Capital structure.
Zertun and Tian (2007) investigated the effect which capital structure has had on
corporate performance using a panel data sample representing of 167 Jordanian companies
during 1989- 2003. The study showed that a firm’s capital structure had significantly negative
impact on the firm’s performance measures, in both the accounting and market’s measures.
Chen and Manso (2010) emphasize that incorporating macroeconomic risk can
increase agency costs of debt substantially.
Morellec and Schuerhoff (2011) focus on the implications of asymmetric information
on the financing and timing of corporate investment.
Hackbarth and Mauer (2011) study the relation between the priority structure of
corporate debt and firms' investment and financing decisions.
Nadeem and Wang (2010) investigate the influencing factors on capital structure
decisions. They find positive significant relationship between capital structure and firm’s
size.
191
3. International Journal of Management (IJM), ISSN 0976 – 6502(Print), ISSN 0976 –
6510(Online), Volume 4, Issue 1, January- February (2013)
III. METHODOLOGY
The pooled data collection is to assess the impact of regulation on performance of
cement companies in Tamil Nadu over the time horizon viz., 1996-97 to 2005-06. The
approach to macroeconomic variables is time series. The design of the study is based on the
secondary sources of information on financial data. The secondary data is practically, a
quantitative method that requires standardized information in order to define or describe
variables or to study the relationships between the variables. The data was tested for
suitability using simple statistical tools such as standard deviation, standard error of the
sample. Due to non- accessibility of sensitive company data, the effect of window
dressing could not be ascertained. However , Data was accepted as these were frequently
inspected by SEBI and Institute of Charted Accountants of India . The study, it was felt,
will be useful if the random sample drawn from the population of cement industry in the state
of Tamil Nadu. T he present study includes India Cements Limited (ICL), Dalmia Cement
(Bharat) Limited (DCL), Madras Cements Limited (MCL) and Chettinadu Cement
Corporation Limited (CCCL). Data first analyzed and experimented using non-
parametric econometric Data Envelopment Analysis (DEA) programming approach for
Scale efficiency.
IV. RESULTS AND DISCUSSION
Table 1.Capital Structure Efficiency Score of India Cements Limited, Dalmia Cement
(Bharat) Limited, Madras Cements Limited, Chettinadu Cement Corporation Limited
and Sample Total of cement industry in Tamil Nadu.
Efficiency Scores
Year/ ICL DCL MCL CCCL Sample
Company Industry
1996 1.0000 1.0000 1.0000 0.9163 0.9508
1997 0.9271 0.7014 0.7227 1.0000 1.0000
1998 1.0000 0.7476 0.9199 1.0000 1.0000
1999 0.5561 0.8036 1.0000 0.7595 0.5358
2000 0.5424 0.7584 0.9058 0.8756 0.5385
2001 0.4913 0.7987 0.7936 1.0000 0.4912
2002 0.3836 1.0000 0.5022 0.5931 0.4195
2003 0.3448 1.0000 0.5258 0.7321 0.3524
2004 1.0000 1.0000 0.5760 0.6122 0.8752
2005 0.9925 0.5781 1.0000 0.6235 0.6276
Inputs: Secured Loan,Un Secured Loan and Current Liabilities
Output: Share Holders Wealth
Model : output oriented model
Scale : Constant returns- to- Scale
Source: Published Annual Reports of the companies, KonSI DEA Analysis for
Benchmarking Software Professional Version.
192
4. International Journal of Management (IJM), ISSN 0976 – 6502(Print), ISSN 0976 –
6510(Online), Volume 4, Issue 1, January- February (2013)
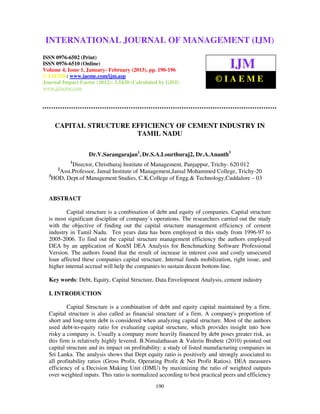
1. Capital Structure Efficiency of India Cements Limited (ICL)
Table 1 and Bar chart in figure 1 reveal the efficiency scores of ICL. The efficient years
(1996, 1998 and 2004) have scores one. DEA measures efficiency of a Decision Making Unit
(DMU) by maximizing the ratio of weighted outputs over weighted inputs. This ratio is
normalized according to best practical peers and efficiency is calculated to be between 0 and
1, as 1 representing efficient unit. The value 0.3448 is the inefficient score of the year 2003
means that its output can simultaneously be increased by a factor of 190.02%. From the Data
Envelopment Analysis , the conclusion drawn that the ICL has efficiently utilized their debts
like secured loan, unsecured loan and current liabilities to maximize the return in the form of
shareholders fund except during the years 1997,1999-2003 and 2005 . The Data
Envelopment Analysis states that the ICL is also not that much efficient company in so for as
Capital Structure efficiency is concerned. Cost of funds is playing an important role in
inefficient capital structure management.
Fig.1. Capital Structure Efficiency of India Cements Limited (ICL)
Efficie ncy s cor e of India ce me nts limite d
1.0
0.8
efficiency score
0.6
0.4
0.2
0.0
1996 1997 1998 1999 2000 2001 2002 2003 2004 2005
ye ar
2. Capital Structure Efficiency of DalmiaCement (Bharat) Limited (DCL)
Table 1 and Bar chart in figure2 reveal efficiency scores of DCL. The efficient years (1996,
2002, 2003 and 2004) have scores one. The value 0.5781 is the inefficient score of the year
2005 means that its output can simultaneously be increased by a factor of 72.98%. From the
above Data Envelopment Analysis, the conclusion drawn that, the DCL has efficiently
utilized their debts like secured loan, unsecured loan and current liabilities to maximize the
return in the form of shareholders fund except during the years 1997, 1997-2001 and 2005.
The Data Envelopment analysis states that the DCL is also had least efficient company in so
for as capital structure efficiency is concerned. Cost of funds is playing an important role in
debt efficiency.
193
5. International Journal of Management (IJM), ISSN 0976 – 6502(Print), ISSN 0976 –
6510(Online), Volume 4, Issue 1, January- February (2013)
Fig.2. Capital Structure Efficiency of DalmiaCement (Bharat) Limited (DCL)
E f fic ie n c y o f D a lm ia C e m e n t ( B h a r a t) L im ite d
1 .0
0 .8
Efficiency Score
0 .6
0 .4
0 .2
0 .0
1996 1997 1998 1999 2000 2001 2002 2003 2004 2005
Year
3. Capital Structure Efficiency of Madras Cements Limited (MCL)
Table 1 and Bar chart in figure 3 reveal the efficiency scores of MCL. The efficient years
(1996, 1999 and 2005) have scores one. The value 0.5022 is the inefficient score of the year
2002 means that its output can simultaneously be increased by a factor of 99.98% From the
above Data Envelopment Analysis, the conclusion drawn that the MCL has efficiently
utilized their debts like secured loan, unsecured loan and current liabilities to maximize the
return in the form of shareholders fund except during the years 1997, 1998 and 2000-2004.
The Data Envelopment Analysis clearly states that the MCL is also had less efficient
company in so for as capital structure efficiency is concerned. Cost of funds is playing an
important role in debt management.
Fig.3. Capital Structure Efficiency of Madras Cements Limited (MCL)
E ff ic i e n c y S c o r e o f M a d r a s C e m e n ts L im ite d
1 .0
0 .8
Efficiency Score
0 .6
0 .4
0 .2
0 .0
1996 1997 1998 1999 2000 2001 2002 2003 2004 2005
Year
194
6. International Journal of Management (IJM), ISSN 0976 – 6502(Print), ISSN 0976 –
6510(Online), Volume 4, Issue 1, January- February (2013)
4. Capital Structure Efficiency of Chettinadu Cement Corporation Limited (CCCL)
Table 1 and Bar chart in figure 4 reveal the efficiency scores of CCCL. The efficient years (1997,
1998 and 2001) have scores one. The value 0.5931 is the inefficient score of the year 2003 means that
its output can simultaneously be increased by a factor of 68.60% From the above Data Envelopment
Analysis, the conclusion drawn that, the CCCL has efficiently utilized their debts like secured loan,
unsecured loan and current liabilities to maximize the return in the form of shareholders fund except
during the years 1996, 1999, 2000, and 2002 - 2005.
Fig.4. Capital Structure Efficiency of Chettinadu Cement Corporation Limited (CCCL)
E ffic ie n c y S c o r e o f C h e tti n a d u C e m e n t C o r p o r a tio n L im ite d
1 .0
0 .8
Efficiency Score
0 .6
0 .4
0 .2
0 .0
1996 1997 1998 1999 2000 2001 2002 2003 2004 2005
Year
5. Capital Structure Efficiency of Cement Industry in Tamil Nadu
Table 1 and Bar chart in figure 5 reveal efficiency score of sample total of cement industry in Tamil
Nadu. The efficient years (1997 and 1998) have scores one. The value 0.3524 is the inefficient score
of the year 2003 means that its output can simultaneously be increased by a factor of 183.76%. From
the above Data Envelopment Analysis, the conclusion drawn that, the cement industry in Tamil Nadu
has efficiently utilized their debts like secured loan, unsecured loan and current liabilities to maximize
the return in the form of shareholders fund except during the years 1996, and 1999 - 2005.
Fig.5. Capital Structure Efficiency for the Sample Total of Tamil Nadu Cement Industry
E ffic ie n c y fo r th e S a m p le T o ta l o f T a m il N a d u C e m e n t In d u s tr y
1 .0
0 .8
Efficiency Score
0 .6
0 .4
0 .2
0 .0
1996 1997 1998 1999 2000 2001 2002 2003 2004 2005
Year
195
7. International Journal of Management (IJM), ISSN 0976 – 6502(Print), ISSN 0976 –
6510(Online), Volume 4, Issue 1, January- February (2013)
V. CONCLUSION
From the above Data Envelopment Analysis, the conclusion drawn that, the cement
industry in Tamil Nadu efficiently utilized their debts like secured loan, unsecured loan and
current liabilities to maximize the return in the form of shareholders fund except during the
years 1996 and1999-2005. This can be seen through raise in secured loan as resulted in fall
in unsecured loan and vice versa till 2000. There has been increase the level of secured loan
mobilized which has declined in operation and high cost unsecured loan moreover restriction
on public deposits mobilization. The inefficient operations can be seen through declining
profit. The high negative bottom-line during 2003 and 2004 is result of increase in interest
cost and costly unsecured loan. Internal funds mobilization, right issue, and higher internal
accruals will help the companies to sustain decent bottom-line.
REFERENCES
1) Ali Saeedi and Iman Mahmoodi, 2011. “Capital Structure and Firm Performance: Evidence
from Iranian Companies”. International Research Journal of Finance and Economics.
2) Banker RD, Charnes A, Cooper WW (1984). Some Models for Estimating Technical and
Scale Inefficiency in Data Envelopment Analysis. Manage. Sci., 30(9):1078-1092.
3) Chakraborty, I., 2010. “Capital structure in an emerging stock market: The case of India”,
Research in International Business and Finance, Vol. 24, pp. 295-314.
4) Charnes A, Cooper WW, Rhodes E (1978). Measuring the Efficiency of Decision Making
Units. Eur. J. Oper. Res., l: 2(6):429-444.
5) Chen, H., and G. Manso, 2010, Macroeconomic risk and debt overhang, Working Paper,
MIT.
6) Ebaid, E. I., 2009. “The impact of capital-structure choice on firm performance: empirical
evidence from Egypt”, The Journal of Risk Finance, Vol. 10, No. 5, pp. 477-487
7) Hackbarth, D., and D. Mauer, 2011, optimal priority structure, capital structure, and
investment, forthcoming, Review of Financial Studies.
8) Modigliani, F. F. & Miller, M. H. (1963). Corporation income taxes and the cost of capital:
acorrection. American Economic Review, 53(3), 433–443.
9) Morellec, E., and N. Schuerhoff, 2011, corporate investment and financing under asymmetric
information, Journal of Financial Economics 99: 262-288.
10) Nadeem, A. and Wang, Z. 2010. “Financing Behavior of Textile Firms in Pakistan”.
International Journal of Innovation, Management and Technology, Vol. 1, No. 2, June2010130-135.
11) Nimalathasan, B., Valeriu B., 2010 Capital Structure and Its Impact on Profitability: A Study
of Listed Manufacturing Companies in Sri Lanka (2010), Revista Tinerilor Economist/The Young
Economists Journal 13,55-61
12) Ong Tze San and Boon Heng Teh. 2011. “Capital Structure and Corporate Performance of
Malaysian Construction Sector”. International Journal of Humanities and Social Science, 1(2):28-36.
13) Puwanenthiren Pratheepkanth, 2011. “Capital Structure and Financial Performance: Evidence
from Selected Business Companies in Colombo Stock Exchange Sri Lanka”. Journal of Arts, Science
& Commerce.
14) Saad, N. M. (2010). Corporate Governance Compliances and the Effects to capital Structure.
International Journal of Economics and Financial, 2(1), 105-114.
15) Zeitun, R. and Tian, G., 2007. “Capital structure and corporate performance: evidence from
Jordan”, Australasian Accounting Business and Finance Journal, Vol. 1, pp. 40-45
16) Jyotsna Ghildiyal Bijalwan, “Corporate Governance System In India” International
Journal of Management (IJM), Volume 3, Issue 2, 2012, pp. 260-269, Published by IAEME.
196