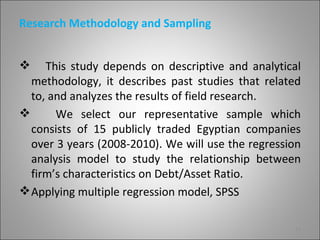
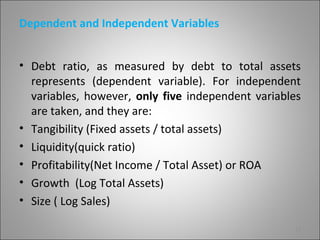
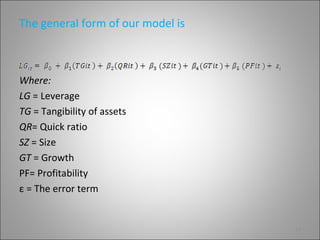
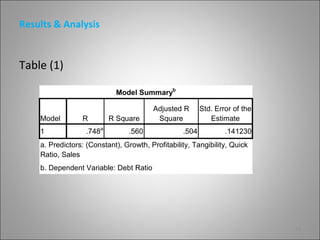
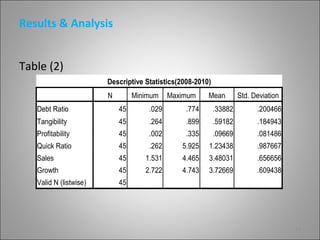
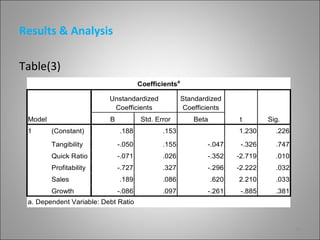
The Relationship between Capital Structure and
 Firm’s Characteristics: An Empirical Study on
             Egypt Stock Exchange


         Abdulhadi Alsheikh

             Supervised by

         Prof.Dr. Hatem Altaee
        Prof.Dr. Khaled AlJaefari

               July 2011
                                                 1
The Objective of the Research

  The objective of the research is to provide
some features and determinants of the capital
structure through the previous studies of
capital structure and to examine these
determinants of capital structure on a sample
of 15 Egyptian companies, we will show what
the most determinate is in common with other
studies that done in middle east market and
other international markets

                                            2
Contributions to the Research:


• It would provide empirical evidence to
  measure the determinants of capital structure
  in a growing market like Egypt.
• This study contributes to the literature by
  focusing only on three major sectors of the
  economy (Industry, Telecommunications, and
  Constructions )

                                              3
Limitations of the Research


• This paper studies examines the determinants of
  capital structure for only three years, due to the
  limited availability of data in Egypt stock exchange.
• Since the financial sectors have high leverage ratios
  like financial firms (Banks, and insurance companies)
  we exclude these companies from our research and
  we rely on non financial sectors (Industry,
  Telecommunications, and Constructions).

                                                      4
Literature Review

Asadi & Ravari (2009) indicate a further empirical evidence of the theories of
   capital structure and try to examine the factors that affect Debt ratios in
   Islamic Republic of Iran. They used data from Tehran Stock Exchange (TSE)
   for five years from 2003 to 2007.They analysis 1000 observations to
   examine which capital structure theory can be strongly supported for
   private and public companies, there were nine hypotheses which had
   been developed to do the test of the relationship between debt ratios and
   explanatory variables such as growth opportunity, profitability, tangibility
   and size (measured by Sales). The results of OLS regression show that
   there is a significant negative relationship between profitability and Debt
   ratios. The relationship between growth opportunity and Debt ratios is
   significantly positive and there is a significant negative relation between
   tangibility and short-term debt and total debt ratios but for long-term
   debt ratio the relation is positive. The relationship between size and
   leverage ratios is different for private and public companies and it isn’t
   significant.                                                               5
Literature Review

Gaud, Jani, Hoesli & Bender (2003) showed that the determinants of the
  capital structure were analyzed for a panel data consisted of 106 Swiss
  companies listed in the Swiss stock exchange. The analysis was performed
  for ten years (1991-2000). They used multiple regression in the analysis,
  the variables: leverage as dependent variable (growth, size, profitability,
  tangibles, operating risk which means that when leverage increase lead to
  volatility of the net profit, firms that have high operating risk can lower
  the volatility of the net profit by reducing the level of debt) as
  independents variables. The results of the paper was : the size of
  companies, the importance of tangible assets and business or operating
  risk are positively correlated to leverage, while growth and profitability
  are negatively associated with financial leverage. Based on the analysis
  and results it suggested that both the pecking order theory and trade off
  hypothesis were confirmed in explaining the capital structure of Swiss
  companies.
                                                                            6
Literature Review

Modigliani and Miller (1958) was the first in to demonstrate algebraically the
  effect of capital structure on firm value. It forms the basis for modern
  thinking on capital structure, though it is generally viewed as a purely
  theoretical result since it disregards many important factors in the capital
  structure decision. The theorem states that, in a perfect market, how a
  firm is financed is irrelevant to its value. This result provides the base with
  which to examine real world reasons why capital structure is relevant,
  that is, a company's value is affected by the capital structure it uses. Some
  other reasons include bankruptcy cost, agency cost, and taxes This
  analysis can then be extended to look at whether there is in fact an
  optimal capital structure, the one which maximizes the value of the firm.
  For example, Modigliani and Miller (1963) took taxation system under
  consideration and they proposed that firms could achieve its optimal
  capital structure by using more debt in their balance sheet. According to
  Miller, the value of the firm depends on the relative height as a
  percentage of each tax rate.                                                  7
Hypotheses


First Hypothesis

H0: There is a significant negative or no relationship between debt ratio of
   the firms and percentage of fixed assets to total assets.
H1: There is a significant positive relationship between debt ratio of the firms
   and percentage of fixed to total asset.

Second Hypothesis
Ho: There is a significant positive or no relationship between debt ratio of the
   firms and their quick ratio.
H1: There is a significant negative relationship between debt ratio of the
   firms and their quick ratio.


                                                                               8
Hypotheses

Third Hypothesis

Ho: There is a significant negative or no relationship between debt ratio of
   the firms and the size of the firms.
H1: There is a significant positive relationship between debt ratio of the firms
   and the size of the firms.
Fourth Hypothesis

H0: There is a significant positive or no relationship between the debt ratio
   of the firms and their growth of earnings.
H1: There is a significant negative relationship between the debt ratio of the
   firms and their growth of earnings.


                                                                                 9
Hypotheses

Fifth Hypothesis

H0: There is a significant positive or no relation between debt
  ratio of the firms and their profitability.

H1: There is a significant negative relationship between debt
  ratio of the firms and their profitability


                                                                  10
Research Methodology and Sampling


    This study depends on descriptive and analytical
  methodology, it describes past studies that related
  to, and analyzes the results of field research.
      We select our representative sample which
  consists of 15 publicly traded Egyptian companies
  over 3 years (2008-2010). We will use the regression
  analysis model to study the relationship between
  firm’s characteristics on Debt/Asset Ratio.
 Applying multiple regression model, SPSS

                                                    11
Dependent and Independent Variables


• Debt ratio, as measured by debt to total assets
  represents (dependent variable). For independent
  variables, however, only five independent variables
  are taken, and they are:
• Tangibility (Fixed assets / total assets)
• Liquidity(quick ratio)
• Profitability(Net Income / Total Asset) or ROA
• Growth (Log Total Assets)
• Size ( Log Sales)

                                                    12
The general form of our model is


Where:
LG = Leverage
TG = Tangibility of assets
QR= Quick ratio
SZ = Size
GT = Growth
PF= Profitability
ε = The error term


                                   13
Results & Analysis


Table (1)

                            Model Summaryb

                                        Adjusted R       Std. Error of the
    Model        R         R Square      Square             Estimate
    1              .748a         .560             .504           .141230
    a. Predictors: (Constant), Growth, Profitability, Tangibility, Quick
    Ratio, Sales
    b. Dependent Variable: Debt Ratio


                                                                             14
Results & Analysis


Table (2)
                        Descriptive Statistics(2008-2010)
                        N        Minimum    Maximum     Mean         Std. Deviation
   Debt Ratio               45       .029        .774       .33882         .200466
   Tangibility              45       .264        .899       .59182         .184943
   Profitability            45       .002        .335       .09669         .081486
   Quick Ratio              45       .262      5.925    1.23438            .987667
   Sales                    45      1.531      4.465    3.48031            .656656
   Growth                   45      2.722      4.743    3.72669            .609438
   Valid N (listwise)       45


                                                                                      15
Results & Analysis

Table(3)
                                      Coefficientsa

                          Unstandardized              Standardized
                           Coefficients                Coefficients
 Model                    B           Std. Error          Beta          t        Sig.
 1       (Constant)           .188           .153                       1.230      .226

         Tangibility          -.050          .155             -.047      -.326     .747
         Quick Ratio          -.071          .026             -.352     -2.719     .010
         Profitability        -.727          .327             -.296     -2.222     .032
         Sales                .189           .086                .620   2.210      .033
         Growth               -.086          .097             -.261      -.885     .381
 a. Dependent Variable: Debt Ratio


                                                                                          16
Conclusion


   The findings show that there a negative
relationship between financial leverage and
tangibility of assets, liquidity, profitability, and
growth. Size of the firm appears to have a
positive relationship with the financial
leverage. However, only the relationships with
liquidity, profitability, and size of the firm are
statistically significant

                                                  17
Thanks

         18

Capital Structure

  • 1.
    The Relationship betweenCapital Structure and Firm’s Characteristics: An Empirical Study on Egypt Stock Exchange Abdulhadi Alsheikh Supervised by Prof.Dr. Hatem Altaee Prof.Dr. Khaled AlJaefari July 2011 1
  • 2.
    The Objective ofthe Research The objective of the research is to provide some features and determinants of the capital structure through the previous studies of capital structure and to examine these determinants of capital structure on a sample of 15 Egyptian companies, we will show what the most determinate is in common with other studies that done in middle east market and other international markets 2
  • 3.
    Contributions to theResearch: • It would provide empirical evidence to measure the determinants of capital structure in a growing market like Egypt. • This study contributes to the literature by focusing only on three major sectors of the economy (Industry, Telecommunications, and Constructions ) 3
  • 4.
    Limitations of theResearch • This paper studies examines the determinants of capital structure for only three years, due to the limited availability of data in Egypt stock exchange. • Since the financial sectors have high leverage ratios like financial firms (Banks, and insurance companies) we exclude these companies from our research and we rely on non financial sectors (Industry, Telecommunications, and Constructions). 4
  • 5.
    Literature Review Asadi &Ravari (2009) indicate a further empirical evidence of the theories of capital structure and try to examine the factors that affect Debt ratios in Islamic Republic of Iran. They used data from Tehran Stock Exchange (TSE) for five years from 2003 to 2007.They analysis 1000 observations to examine which capital structure theory can be strongly supported for private and public companies, there were nine hypotheses which had been developed to do the test of the relationship between debt ratios and explanatory variables such as growth opportunity, profitability, tangibility and size (measured by Sales). The results of OLS regression show that there is a significant negative relationship between profitability and Debt ratios. The relationship between growth opportunity and Debt ratios is significantly positive and there is a significant negative relation between tangibility and short-term debt and total debt ratios but for long-term debt ratio the relation is positive. The relationship between size and leverage ratios is different for private and public companies and it isn’t significant. 5
  • 6.
    Literature Review Gaud, Jani,Hoesli & Bender (2003) showed that the determinants of the capital structure were analyzed for a panel data consisted of 106 Swiss companies listed in the Swiss stock exchange. The analysis was performed for ten years (1991-2000). They used multiple regression in the analysis, the variables: leverage as dependent variable (growth, size, profitability, tangibles, operating risk which means that when leverage increase lead to volatility of the net profit, firms that have high operating risk can lower the volatility of the net profit by reducing the level of debt) as independents variables. The results of the paper was : the size of companies, the importance of tangible assets and business or operating risk are positively correlated to leverage, while growth and profitability are negatively associated with financial leverage. Based on the analysis and results it suggested that both the pecking order theory and trade off hypothesis were confirmed in explaining the capital structure of Swiss companies. 6
  • 7.
    Literature Review Modigliani andMiller (1958) was the first in to demonstrate algebraically the effect of capital structure on firm value. It forms the basis for modern thinking on capital structure, though it is generally viewed as a purely theoretical result since it disregards many important factors in the capital structure decision. The theorem states that, in a perfect market, how a firm is financed is irrelevant to its value. This result provides the base with which to examine real world reasons why capital structure is relevant, that is, a company's value is affected by the capital structure it uses. Some other reasons include bankruptcy cost, agency cost, and taxes This analysis can then be extended to look at whether there is in fact an optimal capital structure, the one which maximizes the value of the firm. For example, Modigliani and Miller (1963) took taxation system under consideration and they proposed that firms could achieve its optimal capital structure by using more debt in their balance sheet. According to Miller, the value of the firm depends on the relative height as a percentage of each tax rate. 7
  • 8.
    Hypotheses First Hypothesis H0: Thereis a significant negative or no relationship between debt ratio of the firms and percentage of fixed assets to total assets. H1: There is a significant positive relationship between debt ratio of the firms and percentage of fixed to total asset. Second Hypothesis Ho: There is a significant positive or no relationship between debt ratio of the firms and their quick ratio. H1: There is a significant negative relationship between debt ratio of the firms and their quick ratio. 8
  • 9.
    Hypotheses Third Hypothesis Ho: Thereis a significant negative or no relationship between debt ratio of the firms and the size of the firms. H1: There is a significant positive relationship between debt ratio of the firms and the size of the firms. Fourth Hypothesis H0: There is a significant positive or no relationship between the debt ratio of the firms and their growth of earnings. H1: There is a significant negative relationship between the debt ratio of the firms and their growth of earnings. 9
  • 10.
    Hypotheses Fifth Hypothesis H0: Thereis a significant positive or no relation between debt ratio of the firms and their profitability. H1: There is a significant negative relationship between debt ratio of the firms and their profitability 10
  • 11.
    Research Methodology andSampling  This study depends on descriptive and analytical methodology, it describes past studies that related to, and analyzes the results of field research.  We select our representative sample which consists of 15 publicly traded Egyptian companies over 3 years (2008-2010). We will use the regression analysis model to study the relationship between firm’s characteristics on Debt/Asset Ratio.  Applying multiple regression model, SPSS 11
  • 12.
    Dependent and IndependentVariables • Debt ratio, as measured by debt to total assets represents (dependent variable). For independent variables, however, only five independent variables are taken, and they are: • Tangibility (Fixed assets / total assets) • Liquidity(quick ratio) • Profitability(Net Income / Total Asset) or ROA • Growth (Log Total Assets) • Size ( Log Sales) 12
  • 13.
    The general formof our model is Where: LG = Leverage TG = Tangibility of assets QR= Quick ratio SZ = Size GT = Growth PF= Profitability ε = The error term 13
  • 14.
    Results & Analysis Table(1) Model Summaryb Adjusted R Std. Error of the Model R R Square Square Estimate 1 .748a .560 .504 .141230 a. Predictors: (Constant), Growth, Profitability, Tangibility, Quick Ratio, Sales b. Dependent Variable: Debt Ratio 14
  • 15.
    Results & Analysis Table(2) Descriptive Statistics(2008-2010) N Minimum Maximum Mean Std. Deviation Debt Ratio 45 .029 .774 .33882 .200466 Tangibility 45 .264 .899 .59182 .184943 Profitability 45 .002 .335 .09669 .081486 Quick Ratio 45 .262 5.925 1.23438 .987667 Sales 45 1.531 4.465 3.48031 .656656 Growth 45 2.722 4.743 3.72669 .609438 Valid N (listwise) 45 15
  • 16.
    Results & Analysis Table(3) Coefficientsa Unstandardized Standardized Coefficients Coefficients Model B Std. Error Beta t Sig. 1 (Constant) .188 .153 1.230 .226 Tangibility -.050 .155 -.047 -.326 .747 Quick Ratio -.071 .026 -.352 -2.719 .010 Profitability -.727 .327 -.296 -2.222 .032 Sales .189 .086 .620 2.210 .033 Growth -.086 .097 -.261 -.885 .381 a. Dependent Variable: Debt Ratio 16
  • 17.
    Conclusion The findings show that there a negative relationship between financial leverage and tangibility of assets, liquidity, profitability, and growth. Size of the firm appears to have a positive relationship with the financial leverage. However, only the relationships with liquidity, profitability, and size of the firm are statistically significant 17
  • 18.