Influence of capacity
•
0 likes•146 views

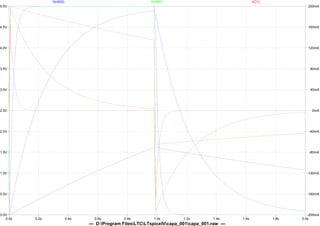
This document contains a graph showing the voltage over time for two nodes, V(n001) and V(n002), in a circuit with a current source I(C1). The graph shows that as the voltage drops from 5V to 0V over 2 seconds for both nodes, the current I(C1) decreases from 200mA to -200mA.
Recommended

More Related Content
More from Tsuyoshi Horigome
More from Tsuyoshi Horigome (20)
Recently uploaded
Recently uploaded (20)
Influence of capacity
- 1. V(n002) V(n001) I(C1) 5.0V 200mA 4.5V 160mA 4.0V 120mA 3.5V 80mA 3.0V 40mA 2.5V 0mA 2.0V -40mA 1.5V -80mA 1.0V -120mA 0.5V -160mA 0.0V -200mA 0.0s 0.2s 0.4s 0.6s 0.8s 1.0s 1.2s 1.4s 1.6s 1.8s 2.0s --- D:Program FilesLTCLTspiceIVcapa_001capa_001.raw ---