1. A t m o s E n e r g y C o r p o r a t i o n Fa c t s
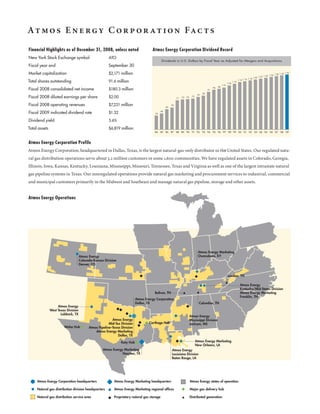
Financial Highlights as of December 31, 2008, unless noted Atmos Energy Corporation Dividend Record
New York Stock Exchange symbol ATO
Dividends in U.S. Dollars by Fiscal Year as Adjusted for Mergers and Acquisitions
Fiscal year end September 30
Market capitalization $2,171 million 1.30 1.32
1.26 1.28
1.22 1.24
1.18 1.20
1.14 1.16
Total shares outstanding 91.6 million 1.10
1.06
1.01
.96 .98
Fiscal 2008 consolidated net income $180.3 million .91
.82
.79
Fiscal 2008 diluted earnings per share $2.00 .75
.73 .74
.71
Fiscal 2008 operating revenues $7,221 million .54
.50
Fiscal 2009 indicated dividend rate $1.32 .40
.35
Dividend yield 5.6%
Total assets $6,819 million
’84 ’85 ’86 ’87 ’88 ’89 ’90 ’91 ’92 ’93 ’94 ’95 ’96 ’97 ’98 ’99 ’00 ’01 ’02 ’03 ’04 ’05 ’06 ’07 ’08 ’09
Atmos Energy Corporation Profile
Atmos Energy Corporation, headquartered in Dallas, Texas, is the largest natural-gas-only distributor in the United States. Our regulated natu-
ral gas distribution operations serve about 3.2 million customers in some 1,600 communities. We have regulated assets in Colorado, Georgia,
Illinois, Iowa, Kansas, Kentucky, Louisiana, Mississippi, Missouri, Tennessee, Texas and Virginia as well as one of the largest intrastate natural
gas pipeline systems in Texas. Our nonregulated operations provide natural gas marketing and procurement services to industrial, commercial
and municipal customers primarily in the Midwest and Southeast and manage natural gas pipeline, storage and other assets.
Atmos Energy Operations
Atmos Energy Marketing
Owensboro, KY
Atmos Energy
Colorado-Kansas Division
Denver, CO
Loudon, TN
Atmos Energy
Kentucky/Mid-States Division
Atmos Energy Marketing
Bolivar, TN
Franklin, TN
Atmos Energy Corporation
Dallas, TX Columbia, TN
Atmos Energy
West Texas Division
Lubbock, TX
Atmos Energy
Atmos Energy Mississippi Division
Carthage Hub
Mid-Tex Division Jackson, MS
Waha Hub Atmos Pipeline–Texas Division
Atmos Energy Marketing
Dallas, TX
Atmos Energy Marketing
Katy Hub
New Orleans, LA
Atmos Energy Marketing Atmos Energy
Houston, TX Louisiana Division
Baton Rouge, LA
Atmos Energy Marketing headquarters
Atmos Energy Corporation headquarters Atmos Energy states of operation
Atmos Energy Marketing regional offices
Natural gas distribution division headquarters Major gas delivery hub
Natural gas distribution service area Proprietary natural gas storage Distributed generation
2. Atmos Energy Corporation Financial Highlights (Unaudited)
Three Months Ended December 31 Year Ended December 31
Statements of Income (000s except per share amounts) 2008 2007 2008 2007
Operating revenues $ 1,716,332 $ 1,657,510 $ 7,221,305 $ 5,898,431
Purchased gas cost 1,321,120 1,287,872 5,899,979 4,648,349
Gross profit 395,212 369,638 1,321,326 1,250,082
Operation and maintenance expense 134,755 121,189 500,234 463,373
Depreciation and amortization 53,126 48,513 200,442 198,863
Taxes, other than income 44,137 41,427 192,755 182,866
Total operating expenses 232,018 211,129 893,431 851,446
Operating income 163,194 158,509 427,895 398,636
Miscellaneous expense (301) (93) 2,731 9,184
Interest charges 38,991 36,817 137,922 145,236
Income before income taxes 123,902 121,599 292,704 362,584
Income tax expense 47,939 47,796 112,373 94,092
Net income $ 75,963 $ 73,803 $ 180,331 $ 168,492
Basic net income per share $ 0.84 $ 0.83 $ 2.02 $ 1.94
Diluted net income per share $ 0.83 $ 0.82 $ 2.00 $ 1.92
Cash dividends per share $ 0.330 $ 0.325 $ 1.30 $ 1.28
Weighed average shares outstanding:
Basic 90,471 89,006 89,385 86,975
Diluted 91,066 89,608 90,272 87,745
Summary Net Income by Segment (000s)
Natural gas distribution $ 50,133 $ 40,164 $ 92,648 $ 73,283
Regulated transmission and storage 7,661 9,847 41,425 34,590
Natural gas marketing 10,575 20,600 29,989 45,769
Pipeline, storage and other 7,594 3,192 16,269 14,850
Consolidated net income $ 75,963 $ 73,803 $ 178,749 $ 174,406
Balance Sheet Items (000s) Dec. 31, 2008 Sept. 30, 2008
Property, plant and equipment $ 5,803,491 $ 5,730,156
Net property, plant and equipment 4,194,748 4,136,859
Total assets 6,818,899 6,386,699
Shareholders’ equity 2,078,076 2,052,492
3. Strategy of Growing Through Acquisitions
Atmos Energy has grown through a series of acquisitions. From 279,000 original customers in 1983, the company has added 2.9 million
customers. In 2004, it acquired the regulated distribution and pipeline operations of TXU Gas Company, its 10th major acquisition.
Atmos Energy Major Acquisitions Associated Natural Gas–Missouri
Heritage Propane Interest Acquired
Woodward Marketing, L.L.C.
Atmos Energy Corporation Founded Louisiana Gas Service and LGS Natural Gas
Trans Louisiana Gas Co. Mississippi Valley Gas Co.
Western Kentucky Gas Co. Greeley Gas Co. Heritage Interest Sold
TXU Gas Co.
United Cities Gas Co.
1983 1986 1987 1993 1997 2000 2001 2002 2004
Strategy of Running Our Regulated Operations Well Strategy of Growing Our Complementary Nonregulated Operations
Industry leader in information and telecommunications technology One of the most respected mid-tier natural gas marketers in the
Hedged approximately half of our expected winter f lowing-gas industry, based on MastioGale’s customer satisfaction surveys
Nonregulated natural gas storage fields in Kentucky and Louisiana,
requirements through financial derivatives and physical storage
Purchased gas cost adjustments adequate in all jurisdictions containing 3.9 Bcf of working gas storage capacity and 7.9 Bcf of
Weather normalization, or a similar rate design, protects more than additional contractual storage capacity; preliminary planning under
90 percent of distribution margins from unseasonable weather way on a salt-cavern gas storage facility in northeast Louisiana with
One of the largest regulated intrastate natural gas pipelines in Texas, an expected in-service date for the first cavern of 2011
Natural gas gathering operations expanded with the completion of
Atmos Pipeline–Texas, serves our growing regulated distribution
market, owns 39 Bcf of storage at five facilities in Texas and trans- our Park City Gathering System in Edmonson County, Kentucky,
ports large volumes of natural gas for producers and shippers and the purchase of the nearby Shrewsbury Gathering System
Expansion of nonregulated operations through past acquisitions of
gas storage fields, gas marketing companies and gas contracts
with municipalities; new opportunities are under evaluation for
natural gas pipeline and storage facilities
Total Return in Fiscal 2008 Earnings History and Fiscal 2009 Estimated EPS
Key
Peer
SPX INDU UTIL ATO S5UTIL Avg. S6GASU Atmos Energy Earnings per Diluted Share ATO - Atmos Energy Corporation
INDU - Dow Jones Industrial Average
$2.05–$2.15E
$2.25
8.2% S5UTIL - Standard & Poor’s 500 Utilities
7.5% $2.00
$1.92 S6GASU - Standard & Poor’s Small-Cap Gas Index
2.00 $1.82
SPX - Standard & Poor’s 500 Index
$1.72
0.2% 1.75 $1.58 UTIL - Dow Jones Utilities Index
1.50 Peer - ATG, LG, NI, NJR, NWN, OKE, PNY,
(1.4)%
SWX and WGL
1.25
EPS estimate assumes less volatility in natural gas prices
1.00
affecting natural gas marketing segment and successful
.75 rate cases and collection efforts.
(11.8)%
.50
.25
(19.8)%
(22.0)% 2004 2005 2006 2007 2008 2009