Exile Resources
•
1 like•344 views

Exile Resources Inc. is a Canada-based oil and gas exploration company with interests in Nigeria, Zambia, and Turkey. Its core asset is the Akepo oil field in Nigeria, which was discovered in 1993 but never developed. Exile is partnering with local companies to re-enter and complete the original well, with first production targeted for late 2010. Further exploration and development is planned in the Akepo license area. Exile also holds less developed assets in Zambia and Turkey that provide additional exploration upside.

More Related Content
What's hot
What's hot (19)
Viewers also liked
Viewers also liked (9)
Similar to Exile Resources
Similar to Exile Resources (20)
Recently uploaded
Recently uploaded (20)
Exile Resources
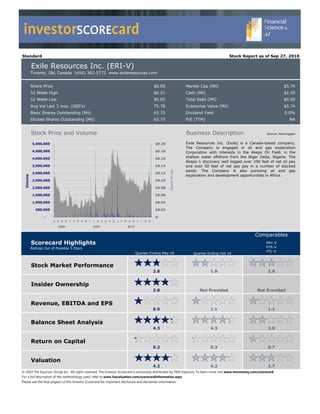
- 1. investorSCOREcard Standard Stock Report as of Sep 27, 2010 Exile Resources Inc. (ERI-V) Toronto, ON, Canada (416) 362-5772 www.exileresources.com Share Price $0.09 Market Cap (Mil) $5.74 52 Week High $0.21 Cash (Mil) $2.59 52 Week Low $0.05 Total Debt (Mil) $0.00 Avg Vol Last 3 mos. (000's) 75.78 Enterprise Value (Mil) $5.74 Basic Shares Outstanding (Mil) 63.75 Dividend Yield 0.0% Diluted Shares Outstanding (Mil) 63.75 P/E (TTM) NA Stock Price and Volume Business Description Source: Morningstar 5,000,000 $0.20 Exile Resources Inc. (Exile) is a Canada-based company. The Company is engaged in oil and gas exploration 4,500,000 $0.18 Corporation with interests in the Akepo Oil Field, in the 4,000,000 $0.16 shallow water offshore from the Niger Delta, Nigeria. The Akepo-1 discovery well logged over 100 feet of net oil pay 3,500,000 $0.14 and over 50 feet of net gas pay in a number of stacked Stock Price sands. The Company is also pursuing oil and gas 3,000,000 $0.12 exploration and development opportunities in Africa. Volume 2,500,000 $0.10 2,000,000 $0.08 1,500,000 $0.06 1,000,000 $0.04 500,000 $0.02 - $- S O N D J F M A M J J A S O N D J F M A M J J A S 2008 2009 2010 Comparables Scorecard Highlights PRY-V Ratings Out of Possible 5 Stars PTR-V PTL-V Quarter Ending May 10 Quarter Ending Feb 10 Stock Market Performance 2.8 1.9 2.9 Insider Ownership 3.8 Not Provided Not Provided Revenue, EBITDA and EPS 0.9 1.1 1.1 Balance Sheet Analysis 4.3 4.3 2.0 Return on Capital 0.2 0.3 0.7 Valuation 4.2 4.2 2.7 © 2010 The Equicom Group Inc. All rights reserved. The Investor Scorecard is exclusively distributed by TMX Equicom. To learn more visit www.tmxmoney.com/scorecard For a full description of the methodology used, refer to www.fsavaluation.com/scorecardinformation.aspx Please see the final page(s) of this Investor Scorecard for important disclosure and disclaimer information.
- 2. investorSCOREcard Exile Resources Inc. (ERI-V) Market Overview and Opportunity Africa is targeted to have proved crude oil reserves of 127.7 billion barrels and proved natural gas reserves of 14.76 trillion cubic feet (Source: BP Statistical Review of World Energy, June 2010). Exile’s core asset – the Akepo Field – is located offshore the Niger Delta, in Nigeria. Proved crude oil reserves estimates for Nigeria are 37.2 billion barrels and proved natural gas reserves estimates are 5.25 trillion cubic feet (Source: BP Statistical Review of World Energy, June 2010). Based on barrels of oil equivalent, Nigeria lags only slightly behind Libya as home to the largest oil and gas reserves on the continent. Exile’s other African asset – Block 26 – is located in Zambia, a country that has yet to identify and produce economic hydrocarbon reserves. Exile’s most recently acquired asset is located in Turkey, which contributes a negligible amount of hydrocarbons to overall world supply and represents a somewhat under-capitalized province in terms of development of its resources. Nonetheless, its close proximity to Iraq, Syria and other Middle Eastern producers, renewed investor interest in emerging markets and a push towards privatization and other fiscal reforms in the country have lead to a marked increase in foreign direct investment. Certain risks, perceived or otherwise, tend to be higher in Africa (particularly Nigeria) relative to other jurisdictions. Exile feels that a certain amount of risk can be mitigated by working with indigenous partners and carefully selecting their projects. Exile offers investors exposure to low-risk development projects focusing on jurisdictions in Sub-Saharan Africa, while providing significant exploration upside. The Akepo Field offshore the Niger Delta in Nigeria offers near-term development and cash flow, along with an exploration opportunity in Prospect A, north of the Akepo-1st well. The Rubai Licenses in eastern Turkey offer near-term development and cash flow along with exploration upside from within the Licenses themselves and adjacent fields in Syria and Iraq. Zambia offers a pure exploration play as there has been no previous oil and gas development in the country. The long-term vision of Exile is to internally fund its capital projects using cash flow generated from its low-risk development projects. Overview of Projects Akepo Field, Niger Delta, Offshore Nigeria: The Akepo Field was first discovered in 1993 via the Akepo-1st well, located in shallow water offshore from the Niger Delta, Nigeria. The well encountered 154 feet of net crude oil sands and 114 feet of net natural gas sands, but was never developed. Exile entered into the Akepo license in 2007, partnering with Nigerian-based Sogenal Ltd. Oil & Gas Company (the operator). In 2009, Exile farmed-out a portion of its interest to another Nigerian-based company, Oando Exploration & Production Ltd., who then became the technical partner in the joint venture, allowing Exile to be carried through to first oil production. The partnership re-entered the well, successfully completing flow tests that suggest the well could produce at stable rates between 2,500 and 3,500 barrels of crude oil per day. This would result in 200 to 240 barrels of crude oil per day net to Exile during the cost recovery phase. First production from Akepo-1st is targeted for late 2010 subject to an Early Production System review. First oil was previously targeted for Q3/10, but has been delayed while the details and logistics of the gathering system are finalized. Further north, Exile has identified a prospect (“Prospect A”) similar in size and character to Akepo-1st. Prospect A would offer an accessible, low-cost, upside exploration opportunity within the existing Akepo license area. Cash flow generated from Akepo-1st would be used to fund the possible exploration program on Prospect A. If successful, any production from Prospect A could be easily tied into Akepo-1st’s infrastructure.
- 3. investorSCOREcard Exile Resources Inc. (ERI-V) Zambia: Only two exploration wells have been drilled in Zambia, and neither of these wells reached their intended target. For Exile, Zambia represents untapped, under-explored potential for significant reserves of oil and gas at a low-cost. The Company was awarded Block 26 in the northeast of the country after applying for the investment license. The decision to enter Zambia was based on careful review of existing seismic data acquired during the previous exploration campaign during the 1980’s. Exile has set up a Zambian office and registered a local company while continuing to review existing data along with conducting geochemical surveys to establish the potential for oil and gas. Rubai Licenses, East Turkey: Exile entered into a joint venture agreement with Aladdin Middle East Ltd. (“Aladdin”), a private, independent oil and gas exploration and production company operating in Turkey. As an upstream operator, Aladdin operates their own drilling rigs, contracting drilling services to companies in Turkey and further a field, such as Morocco and Egypt, which may provide Exile with strategic benefits going forward. The five contiguous blocks that Exile has farmed-in on are called the Rubai Licenses, and are located in the southeast of the country, near the borders of Syria and Iraq. The Rubai Licenses represent low-risk, near- term development and lend towards diversifying the Company’s asset base beyond Sub-Saharan Africa. Along with near-term cash flow attributable to the development project on the Licenses, there remains significant exploration potential on the blocks themselves along with very large identified fields located nearby. Aladdin drilled the crude oil discovery well NE Ogunduk-1 on the Rubai Licenses in late 2009. Oil samples were recovered but the well was not tested. The development of the Licenses includes re-entry and testing of NE Ogunduk-1, with Aladdin as operator and Exile holding a 5% interest along with a fixed cost contribution. As more wells are drilled, Exile has the option of increasing its interest as work on the Licenses progresses. Milestones In the near-term, Exile will be focusing on getting production from Akepo-1st on-line. Also in Nigeria, the Company continues to evaluate the acquisition of one or two additional marginal field projects to build critical mass within their core operating area, planning to bid on additional Nigerian fields in the next bid round. In Zambia, the Company has established a local presence by setting up an office, registering a local company and continues to assess new and existing data. In Turkey, the NE Ogunduk-1 well has been re-entered and the Company awaits drill stem testing results before moving ahead with development plans on the Rubai Licenses. Investment Highlights • Small asset targets, have little to no competition in the space • Political/country risk is hedged by diversifying operating areas – Nigeria, Zambia, Turkey – evaluating opportunities in Ghana, Gabon, Liberia, and Morocco • Provides exposure to development projects underpinning higher-risk exploration • Near-term catalysts include first oil at Akepo-1st, onshore and offshore land acquisition(s) in Nigeria, drill stem test results from NE Ogunduk-1 well in Turkey
- 4. investorSCOREcard Exile Resources Inc. (ERI-V) Management Tony Henshaw Chief Executive Officer, Director Graham Warren, BComm, CMA Chief Financial Officer Comparables Pinecrest Energy Inc. (PRY-V) Petromin Resources (PTR-V) Petra Petroleum Inc. (PTL-V)
- 5. investorSCOREcard Exile Resources Inc. (ERI-V) Stock Market Performance Rating 2.8 Stock Market Returns 600,000 $1.00 $0.90 Return Percentile Rating 500,000 Three Months 20% 70% 3.5 $0.80 Six Months (10.0%) 34% 1.7 $0.70 Stock Price 1 Year 80% 100% 5.0 400,000 Volume 3 Years (CAGR) (14.7%) 22% 1.1 $0.60 5 Years (CAGR) 300,000 $0.50 $0.40 Market Data 200,000 $0.30 Price $0.09 Mkt Cap (Mil) $5.74 $0.20 100,000 Shs Outstanding (Mil) 63.75 $0.10 Dividend Yield % 0.0% Avg Vol Last 3mos. (000's) 75.78 - $- 2005 2006 2007 2008 2009 2010 P/E (TTM) NA Insider Ownership Rating 3.8 Value of Shares and Options Percent of Ownership Shares Options Total Value Rating Percent Rating 19.1% Insiders * Adjusted 0.0% > 10% Holders # of # of $ Value if Adjusted $ $ Value $ Value if Rating Percent of Rating 80.9% Other Shares Options Exercised Value Exercised (Add all) Mkt. Value (Add all) Anthony Henshaw 2,733,125 $245,981 3,175,000 $285,750 $142,875 $388,856 0.2 6.8% 1.4 President and CEO Graham Warren 1,315,000 $118,350 875,000 $78,750 $39,375 $157,725 0.1 2.7% 0.5 Sep-10 CFO Other Officers Aug-10 - $0 - $0 $0 $0 0.0 0.0% 0.0 Jul-10 Board of Directors (excl. CFO) 4,772,500 $429,525 2,600,000 $234,000 $117,000 $546,525 0.2 9.5% 1.9 Jun-10 > 10% Holders May-10 - $0 - $0 $0 $0 0.0% For info only 0% 20% 40% 60% 80% 100% Total (excl. >10% Holders) $793,856 $598,500 $299,250 $1,093,106 0.4 19.1% 3.8 (Max of 4) (Max of 4) CEO CFO Other Officers Directors > 10% Holders Public Float * Adjusted $ Value of Options is 50% of their full value if exercised to account for volatility. Furthermore, our view is that shareholders would rather management owned shares vs. options. Add: Compensation Type Category Rating Addition Percent of Compensation Share and Total Perform- Share and Salary Comp. 10.7% Perform- Unit Option All Other ance Unit Option ance Bonus Awards Awards Comp. Bonus Awards Awards Anthony Henshaw 0.0% Salary $386,059 $59,597 $445,656 President and CEO Bonus Graham Warren Shares & Units $120,000 $120,000 CFO Options Seyi Ajibola All Other $188,392 $23,560 $211,952 Country Manager 89.3% Total $694,451 $0 $0 $0 $83,157 $777,608 0.00 0.00 0.00 (Max Score) Bonus: Net Buying/Selling Last Six Months Insider Holdings Beginning and Ending Value Transactions Adjusted Share and $1,200,000 Rating $1,000,000 Option Value Buying Selling Net Bonus $800,000 $600,000 Anthony Henshaw, President and CEO $0 $0 $0 0.00 Graham Warren, CFO $0 $0 $0 0.00 $400,000 Other Officers $10,800 $0 $10,800 0.01 $200,000 Board of Directors (excl. CFO) $0 $0 $0 0.00 $- > 10% Holders (info only) $0 $0 $0 Total (excl. >10% Holders) $10,800 $0 $10,800 0.01 (Total Score) Beg Trans- Ending Value actions Value
- 6. investorSCOREcard Exile Resources Inc. (ERI-V) Balance Sheet Analysis Rating 4.3 Short-Term Liquidity Quadrant 3: Quadrant 1: "RECOVERING" "OPTIMAL" + VE This Company's cash flow is considered NOT SEASONAL, therefore this report uses the last $ 0.6 quarter's cash flow multiplied by 4 as a proxy for annual cash flow. $ 0.1 Quadrant Rating May-09 Aug-09 Nov-09 Feb-10 May-10 Working Capital $ 3.4 $ 3.0 $ 2.5 $ 3.2 $ 2.7 Cash Flow Ops (Q in mil) ($0.2) ($0.3) ($0.2) ($0.3) ($0.3) Cash Flow ($0.4) Cash Flow Ops (Ann Q's in mil) ($1.0) ($1.0) ($0.9) ($1.2) ($1.1) Quadrant Rating 3.0 3.0 3.0 3.0 3.0 Aug-09 Nov-09 May-09 ($0.9) Addition to Quadrant Rating May-10 Our methodology accounts for the 'nearness' to improving or worsening a Company's quadrant Feb-10 ranking based on current cash generation/burn rate and working capital position. The Company ($1.4) - VE is DRAWING DOWN their working capital. At the current cash burn rate the Company's working ($1) $- $1 $2 $3 $4 capital will be $0 in 31 month(s). Quadrant 2: Quadrant 4: "URGENT" "DRAWING DOWN" Add: 1.3 - VE Working Capital + VE Short-Term Liquidity Rating 4.3 Debt to Equity May-09 Aug-09 Nov-09 Feb-10 May-10 Utilities Telecom Equity Number of Companies Materials Common Stock Equity $ 5.8 $ 5.5 $ 5.1 $ 4.7 $ 4.3 Info Tech Industrials Total Equity $ 5.8 $ 5.5 $ 5.1 $ 4.7 $ 4.3 Health Care Energy Cons Staples Debt and Equivalents Cons Disc Pref. Securities of Sub Trust - - - - - Pref. Equity Outside Stock Equity - - - - - Preferred Stock Equity - - - - - Minority Interest (Bal. Sheet) - - - - - Short-Term Debt - - - - - Long-Term Debt - - - - - Capital Lease Obligations - - - - - Total Debt and Equivalents $ - $ - $ - $ - $ - 0.00 1.00 2.00 3.00 4.00 Debt to Equity 0.00 0.00 0.00 0.00 0.00 Debt to Equity Rating NA Low Risk Debt to Equity High Risk NOTE: The Company is in early stages and should be debt free until they consistently generate positive cash flow Debt to Equity Rating NA Interest Coverage May-09 Aug-09 Nov-09 Feb-10 May-10 1.0 x EBIT 0.9 x Interest Coverage Quarterly ($0.4) ($0.4) ($0.4) ($0.5) ($0.4) 0.8 x TTM ($1.7) ($1.7) ($1.8) ($1.6) ($1.6) 0.7 x N/A 0.6 x Interest Expense 0.5 x Quarterly - - - - - 0.4 x TTM - - - - - 0.3 x Interest Coverage 0.2 x Quarterly #N/A #N/A #N/A #N/A #N/A 0.1 x TTM #N/A #N/A #N/A #N/A #N/A 0.0 x May-09 Aug-09 Nov-09 Feb-10 May-10 Interest Coverage Rating Qtrly Interest Coverage Rating Quarterly TTM Interest Coverage Rating TTM Interest Coverage Rating N/A
- 7. investorSCOREcard Exile Resources Inc. (ERI-V) Revenue, EBITDA and EPS Rating 0.9 Revenue (in millions) Revenue (in milions) on Rolling TTM $1.00 $0.90 Annual (Fiscal Year) Aug-06 Aug-07 Aug-08 Aug-09 $0.80 Revenue $ - $ - $ - $ - $ - $0.70 $0.60 Quarterly May-09 Aug-09 Nov-09 Feb-10 May-10 Basis Quarter Ending $ - $ - $ - $ - $ - $0.50 TTM $0.40 $0.30 Growth Percent Rating Stability R² Rating $0.20 Rev. Growth % TTM Rev. Growth % LFY Revenue Stability Last 2 Yrs $0.10 Rev. Growth % 3 Year CAGR Revenue Stability Last 3 Yrs $- Rev. Growth % 5 Year CAGR Revenue Stability Last 5 Yrs Jun Jun Jun Jun Jun May May May May May Revenue Growth Rating Overall Revenue Stability Rating 01 02 03 04 05 06 07 08 09 10 Revenue Growth and Stability Rating 0.0 EBITDA (in millions) EBITDA (in milions) on Rolling TTM $- ($0.50) Annual (Fiscal Year) Aug-06 Aug-07 Aug-08 Aug-09 EBITDA $ - ($2.1) ($3.2) ($1.3) ($1.7) ($1.00) ($1.50) Quarterly May-09 Aug-09 Nov-09 Feb-10 May-10 Basis Quarter Ending ($0.4) ($0.4) ($0.4) ($0.5) ($0.4) ($2.00) TTM ($1.7) ($1.7) ($1.8) ($1.6) ($1.6) ($2.50) Growth Percent Rating Stability R² Rating ($3.00) EBITDA Growth % TTM 1.9% 0.8 ($3.50) EBITDA Growth % LFY -24.9% 0.0 EBITDA Stability Last 2 Yrs 0.6% 0.0 EBITDA Grwth % 3 Yr CAGR 22.3% 2.2 EBITDA Stability Last 3 Yrs 56.9% 2.8 ($4.00) EBITDA Grwth % 5 Yr CAGR EBITDA Stability Last 5 Yrs Jun Jun Jun Jun Jun May May May May May EBITDA Growth Rating 1.0 Overall EBITDA Stablitity Rating 1.4 01 02 03 04 05 06 07 08 09 10 EBITDA Growth and Stability Rating 1.2 Basic Earnings Per Share (EPS*) $- * (excluding acquired in process R&D, restructuring and M&A, special income & charges and discontinued ops) ($0.01) Annual (Fiscal Year) Aug-06 Aug-07 Aug-08 Aug-09 ($0.02) EPS on Rolling TTM EPS $ - ($0.08) ($0.09) ($0.04) ($0.03) ($0.03) ($0.04) Quarterly (TTM) Basis May-09 Aug-09 Nov-09 Feb-10 May-10 Quarter Ending ($0.01) ($0.01) ($0.01) ($0.01) ($0.01) ($0.05) TTM ($0.03) ($0.03) ($0.04) ($0.04) ($0.04) ($0.06) ($0.07) Growth Percent Rating Stability R² Rating ($0.08) EPS Growth % TTM -33.3% 0.1 EPS Growth % LFY 25.0% 2.0 EPS Stability Last 2 Yrs 13.0% 0.6 ($0.09) EPS Grwth % 3 Year CAGR 20.6% 1.9 EPS Stability Last 3 Yrs 62.6% 3.1 ($0.10) EPS Grwth % 5 Year CAGR EPS Stability Last 5 Yrs Jun Jun Jun Jun Jun May May May May May EPS Growth Rating 1.3 Overall EPS Stablitity Rating 1.9 01 02 03 04 05 06 07 08 09 10 EPS Growth and Stability Rating 1.6
- 8. investorSCOREcard Exile Resources Inc. (ERI-V) Return On Capital Rating 0.2 Return On Invested Capital (ROIC) 0% Annual (Fiscal Year) Aug-06 Aug-07 Aug-08 Aug-09 (5%) Invested Capital Period Ending $ 1.6 $ 8.6 $ 3.6 $ 7.1 $ 5.5 Average Invested Capital $ 1.6 $ 5.1 $ 6.1 $ 5.3 $ 6.3 (10%) ROIC on Rolling TTM * Net Income $ - ($1.8) ($3.1) ($1.4) ($1.7) (15%) Add Back: After Tax Interest Expense $ - $ - $ - $ - $ - Annual ROIC -34.7% -51.6% -27.0% -27.7% (20%) Basis Level Rating 1.9 0.0 0.0 0.1 0.1 Consistency Rating 0.5 (25%) (30%) Quarterly (TTM) May-09 Aug-09 Nov-09 Feb-10 May-10 Invested Capital Period Ending $ 5.9 $ 5.5 $ 5.1 $ 4.7 $ 4.3 (35%) Average Invested Capital $ 6.0 $ 6.3 $ 5.9 $ 5.5 $ 5.1 (40%) * Net Income ($1.8) ($1.7) ($1.9) ($1.8) ($1.6) Add Back: After Tax Interest Expense $ - $ - $ - $ - $ - (45%) Quarterly ROIC -30.7% -27.5% -32.5% -32.2% -31.6% Level Rating 0.1 0.1 0.1 0.1 0.1 (50%) Consistency Rating 0.1 Jun Jun Jun Jun Jun May May May May May 01 02 03 04 05 06 07 08 09 10 Return on Invested Capital (ROIC) Rating 0.2 Return On Assets (ROA) 0% Annual (Fiscal Year) Aug-06 Aug-07 Aug-08 Aug-09 (5%) Total Assets Period Ending $ 1.6 $ 8.6 $ 3.8 $ 7.2 $ 5.6 Average Total Assets $ 1.6 $ 5.1 $ 6.2 $ 5.5 $ 6.4 (10%) ROA on Rolling TTM * Net Income $ - ($1.8) ($3.1) ($1.4) ($1.7) (15%) Add Back: After Tax Interest Expense $ - $ - $ - $ - $ - Annual ROA -34.5% -50.4% -26.1% -27.1% (20%) Basis Level Rating 2.1 0.1 0.0 0.3 0.2 Consistency Rating 0.5 (25%) (30%) Quarterly (TTM) May-09 Aug-09 Nov-09 Feb-10 May-10 Total Assets Period Ending $ 5.9 $ 5.6 $ 5.2 $ 4.8 $ 4.4 (35%) Average Total Assets $ 6.1 $ 6.4 $ 6.0 $ 5.6 $ 5.2 (40%) * Net Income ($1.8) ($1.7) ($1.9) ($1.8) ($1.6) Add Back: After Tax Interest Expense $ - $ - $ - $ - $ - (45%) Quarterly ROA -30.7% -27.5% -32.5% -32.2% -31.6% Level Rating 0.2 0.2 0.1 0.1 0.1 (50%) Consistency Rating 0.2 Jun Jun Jun Jun Jun May May May May May 01 02 03 04 05 06 07 08 09 10 Return on Assets (ROA) Rating 0.3 Return On Common Equity (ROE) 0% Annual (Fiscal Year) Aug-06 Aug-07 Aug-08 Aug-09 (5%) Total Equity Period Ending $ - $ 8.6 $ 4.7 $ 7.1 $ 5.5 Average Common Equity $ - $ 4.3 $ 6.6 $ 5.9 $ 6.3 (10%) ROE on Rolling TTM * Net Income $ - ($1.8) ($3.1) ($1.4) ($1.7) (15%) Add Back: NA $ - $ - $ - $ - $ - Annual ROE -47.1% -24.4% -27.7% (20%) Basis Level Rating 0.1 0.4 0.3 Consistency Rating 0.3 (25%) (30%) Quarterly (TTM) May-09 Aug-09 Nov-09 Feb-10 May-10 Total Equity Period Ending $ 5.8 $ 5.5 $ 5.1 $ 4.7 $ 4.3 (35%) Average Common Equity $ 6.0 $ 6.3 $ 5.9 $ 5.5 $ 5.1 (40%) * Net Income ($1.8) ($1.7) ($1.9) ($1.8) ($1.6) Add Back: NA $ - $ - $ - $ - $ - (45%) Quarterly ROE -30.7% -27.5% -32.5% -32.2% -31.6% Level Rating 0.3 0.3 0.2 0.2 0.2 (50%) Consistency Rating 0.3 Jun Jun Jun Jun Jun May May May May May 01 02 03 04 05 06 07 08 09 10 Return on Common Equity (ROE) Rating 0.3 * Net Income - Excludes Net Income from Discontinued Operations, Income Acquired in Process R&D, Income Restructuring And M&A, and Other Special Income/(Charges)
- 9. investorSCOREcard Exile Resources Inc. (ERI-V) Valuation Rating 4.2 Price to Earnings (P/E) 1.0 x (Lower numbers receive higher rankings) 0.9 x Annual (Fiscal Year) Aug-06 Aug-07 Aug-08 Aug-09 0.8 x * Price $ 0.46 $ 0.12 $ 0.07 $ 0.10 P/E on Rolling TTM Earnings Per Share (EPS) $ - ($0.08) ($0.09) ($0.04) ($0.03) 0.7 x 0.6 x Annual P/E Basis Annual P/E Rating 0.5 x 0.4 x Quarterly (TTM) May-09 Aug-09 Nov-09 Feb-10 May-10 * Price $ 0.11 $ 0.10 $ 0.13 $ 0.11 $ 0.09 0.3 x Earnings Per Share (EPS) ($0.03) ($0.03) ($0.04) ($0.04) ($0.04) 0.2 x Quarterly (TTM) P/E 0.1 x Quarterly (TTM) P/E Rating 0.0 x Jun Jun Jun Jun Jun May May May May May 01 02 03 04 05 06 07 08 09 10 Price to Earnings (P/E) N/A Price to Book (P/Book) 7.0 x (Lower numbers receive higher rankings) 6.0 x Annual (Fiscal Year) Aug-06 Aug-07 Aug-08 Aug-09 P/Book on Quarterly * Price $ 0.46 $ 0.12 $ 0.07 $ 0.10 Book Equity Per Share $ 0.24 $ 0.13 $ 0.11 $ 0.09 5.0 x Annual P/Book 1.9 x 0.9 x 0.6 x 1.2 x 4.0 x Basis Annual P/Book Rating 3.6 4.4 4.5 4.2 3.0 x Quarterly May-09 Aug-09 Nov-09 Feb-10 May-10 * Price $ 0.11 $ 0.10 $ 0.13 $ 0.11 $ 0.09 2.0 x Book Equity Per Share $ 0.09 $ 0.09 $ 0.08 $ 0.07 $ 0.07 1.0 x Quarterly P/Book 1.2 x 1.2 x 1.6 x 1.4 x 1.3 x Quarterly P/Book Rating 4.2 4.2 3.9 4.0 4.1 0.0 x Jun Jun Jun Jun Jun May May May May May 01 02 03 04 05 06 07 08 09 10 Price to Book (P/Book) 4.2 Enterprise Value to EBITDA (EV/EBITDA) 1.0 x (Lower numbers receive higher rankings) 0.9 x EV/EBITDA on Rolling TTM Annual (Fiscal Year) Aug-06 Aug-07 Aug-08 Aug-09 0.8 x * Enterprise Value $ - $ 16.2 $ 4.3 $ 4.1 $ 6.4 EBITDA $ - ($2.15) ($3.18) ($1.34) ($1.67) 0.7 x 0.6 x Annual EV/EBITDA Basis Annual EV/EBITDA Rating 0.5 x 0.4 x Quarterly (TTM) May-09 Aug-09 Nov-09 Feb-10 May-10 * Enterprise Value $ 7.0 $ 6.4 $ 8.0 $ 6.7 $ 5.4 0.3 x EBITDA ($1.66) ($1.71) ($1.83) ($1.59) ($1.63) 0.2 x Quarterly (TTM) EV/EBITDA 0.1 x Quarterly (TTM) EV/EBITDA Rating 0.0 x Jun Jun Jun Jun Jun May May May May May 01 02 03 04 05 06 07 08 09 10 Enterprise Value to EBITDA (EV/EBITDA) N/A * Price - Delayed 60 days to reflect the fact that financial statements are public approximately 60 days after the last day of the reporting period. For the last period the most recent price is used.
- 10. investorSCOREcard Disclosure and Disclaimer The issuer (“Issuer”) covered under this investor scorecard (“Investor Scorecard”) has paid a fee to or has been charged a fee to produce and distribute this Investor Scorecard. The fee paid or charged for the production and distribution of this Investor Scorecard was not subject to the rankings or information provided herein, nor was any securities of the Issuer accepted as payment for such fee. FSA Financial Science & Art Ltd. (“FSA”), The Equicom Group Inc. (“Equicom”) and their respective employees and directors may have had or from time to time acquire, hold or sell an interest in the listed securities of the Issuer. Unless specified otherwise, all forward looking statements in this Investor Scorecard have been approved by the Issuer, and the Issuer has advised FSA and Equicom, without independent verification by FSA or Equicom that a reasonable basis exists for such forward looking statements. Other information contained in this Investor Scorecard has been compiled by FSA or Equicom from sources believed to be reliable, which may include but not limited to, public information, research reports and discussions with management of the Issuer. Prior to its publication, this Investor Scorecard had been submitted to the management of the Issuer for review for factual accuracy. No representation or warranty, express or implied, is made by FSA, Equicom, its affiliates, any other person that provided information or data for this Investor Scorecard or any person that distributes this Investor Scorecard with respect to the adequacy, accuracy, completeness or timeliness of any information, estimates or opinions provided in this Investor Scorecard. All estimates, opinions and other information in this Investor Scorecard are provided by FSA, Equicom or another party as of the date of this Investor Scorecard. Such estimates, opinions and other information are subject to change without notice, and are provided in good faith but without any legal responsibility. Past performance is no guarantee of future results. This Investor Scorecard is provided for informational purposes only and does not constitute an offer or solicitation to buy or sell any securities discussed herein in any jurisdiction. As a result, the securities discussed in this Investor Scorecard may not be eligible for sale in some jurisdictions. This Investor Scorecard is not, and under no circumstances should be construed as, a solicitation to act as a securities broker, dealer or advisor in any jurisdiction by any person or company that is not legally permitted to carry on the business of a securities broker, dealer or advisor in that jurisdiction. Neither FSA nor Equicom is a registered investment dealer, broker or advisor, has investment banking operations or makes markets in any securities. This Investor Scorecard is prepared for general circulation and to provide an overview of Issuer’s business. This Investor Scorecard does not consider the investment objectives, financial situation or particular needs of any particular person, and is not tailored to the needs of any person receiving this Investor Scorecard. Readers of this Investor Scorecard should obtain professional advice based on their own individual circumstances before making an investment decision. Nothing in this Investor Scorecard constitutes individual investment, legal or tax advice. To the fullest extent permitted by law, FSA, Equicom, Morningstar Inc., its content providers, any other person that has provided information or data for this Investor Scorecard nor any authorized person that distributes this Investor Scorecard accepts any liability whatsoever for any direct, indirect, special or consequential loss (whether in contract or tort even if FSA, Equicom or the other party has been advised of the possibility of such loss) arising from any use of, or reliance on the estimates, opinions or other information contained in this Investor Scorecard. Without limiting the generality of the foregoing, you are prohibited from using or disclosing any personal information contained in the Investor Scorecard for purposes unrelated to the purposes for which the information is made available to you and/or the public under Canadian securities laws, including, without limitation, for secondary marketing purposes, unless you have obtained any and all consents as required under applicable Canadian privacy laws. The information contained in this Investor Scorecard is copyrighted, and it may not be sold or licensed for commercial value or altered, in whole or in part, without prior express written consent of Equicom. Furthermore, Investor Scorecard can only be distributed in its entirety. Information or data herein, including any trade mark, service mark or logo is the intellectual property of FSA, Equicom, Morningstar Inc. and/or its content providers, Issuer or other persons that have provided such information or data, including but not limited to the organizations listed below and their respective content providers. This report was produced in part with information from the following organizations: