SYLLABUS
Definition of DataScience
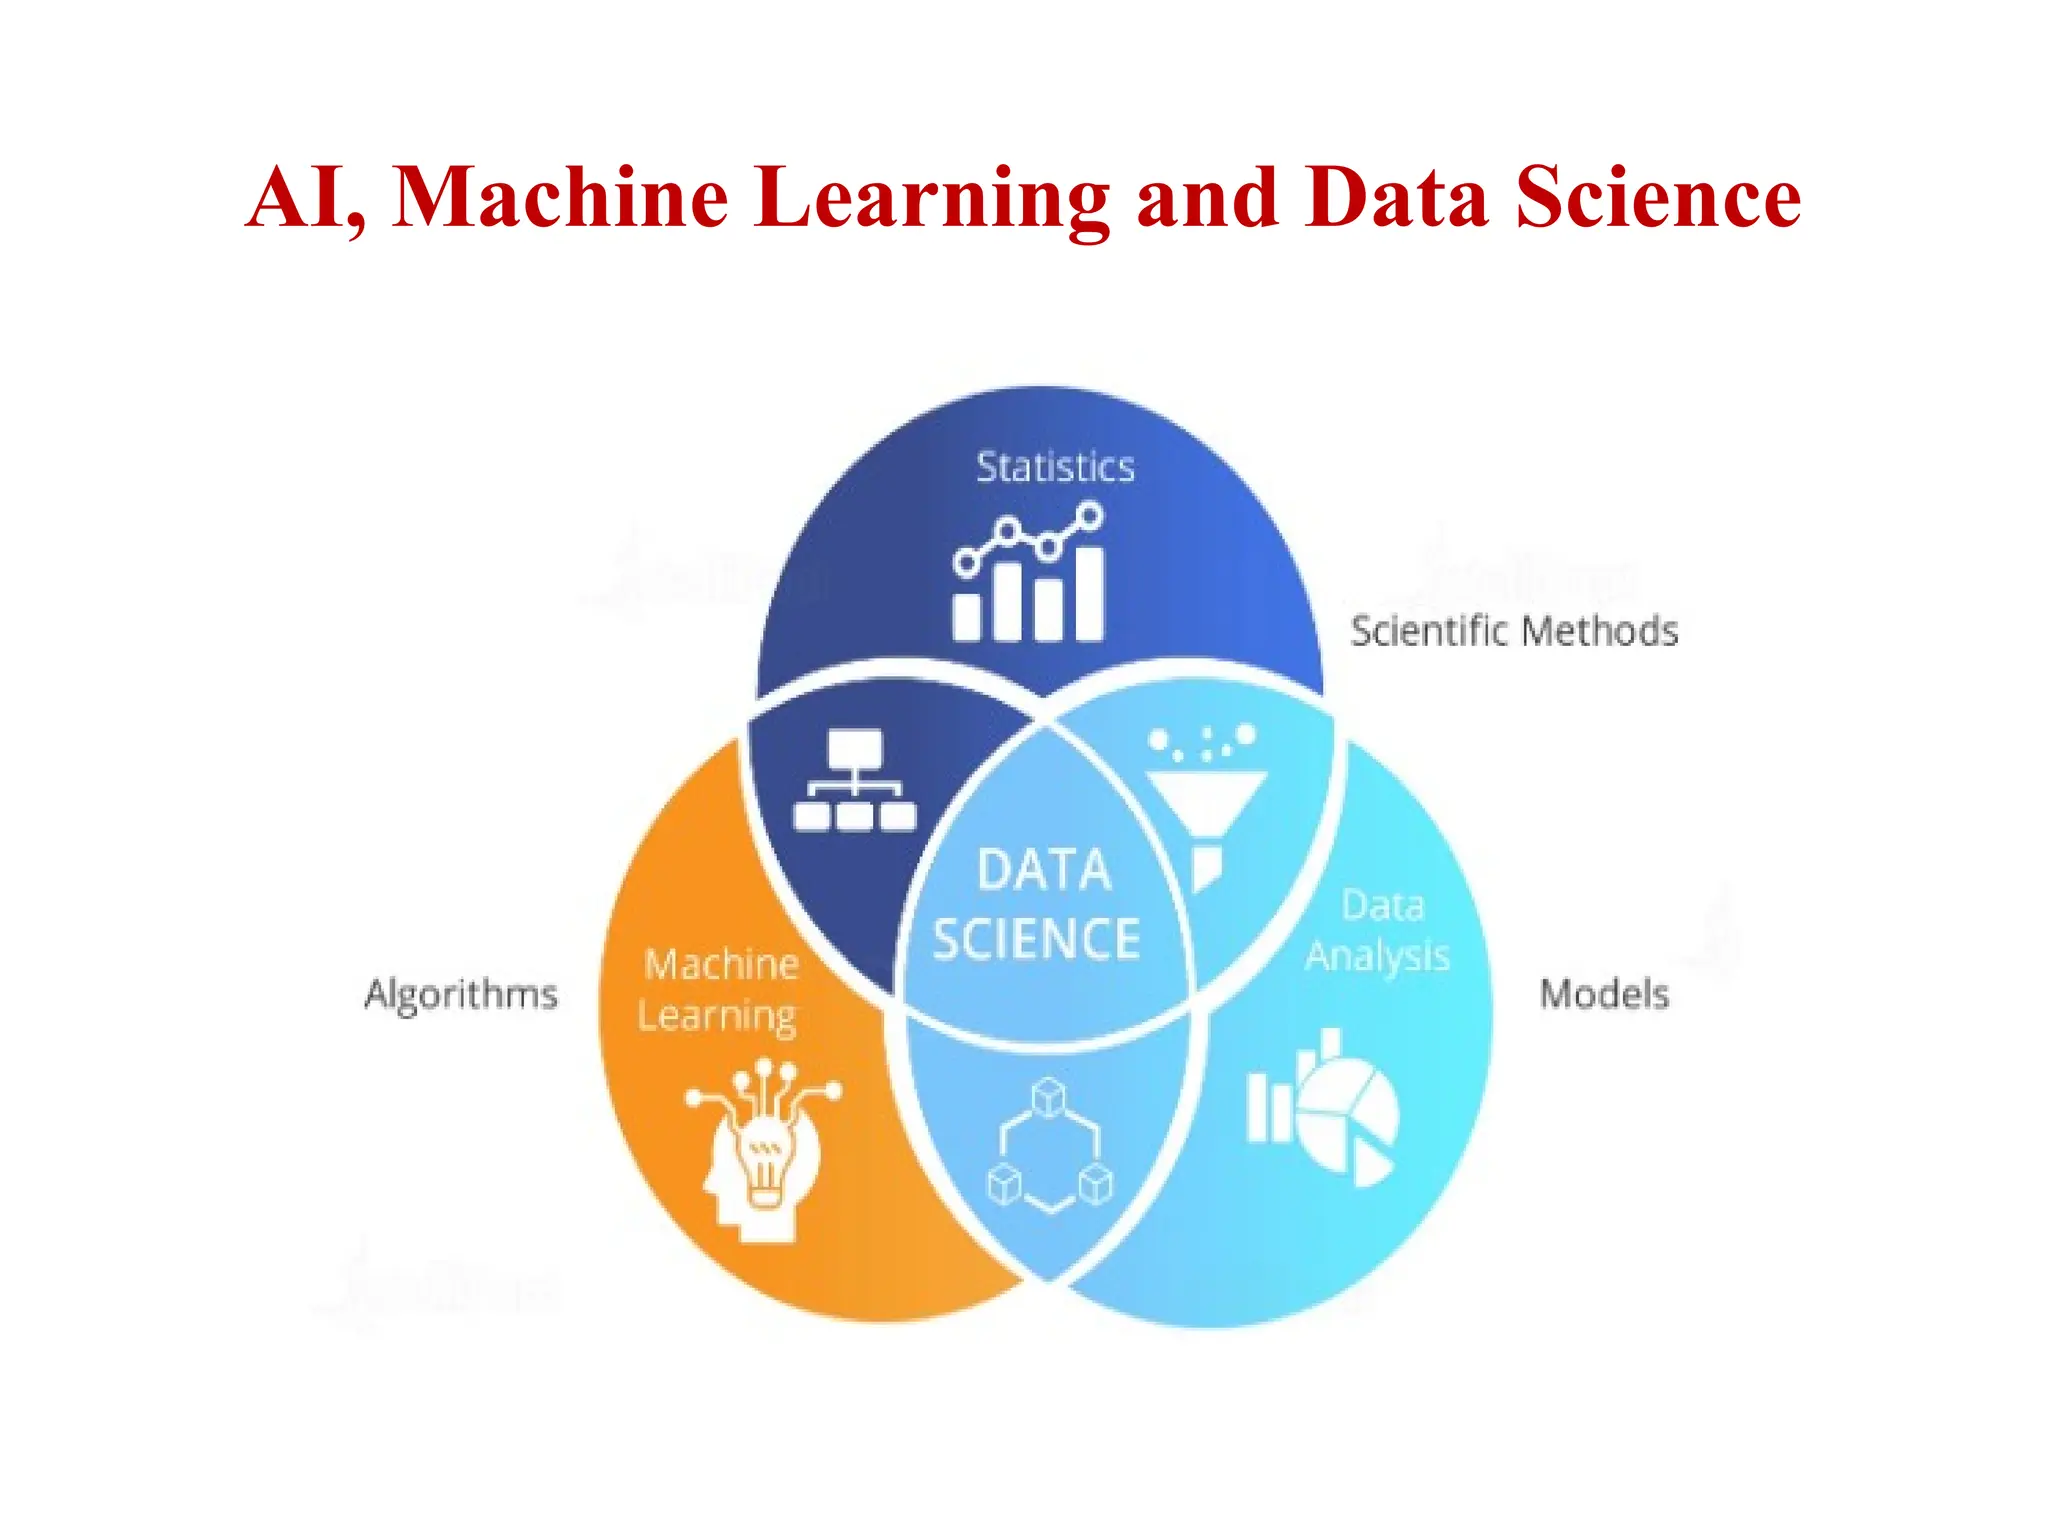
AI, Machine Learning and Data Science
Extracting Meaningful patterns
Building representative models
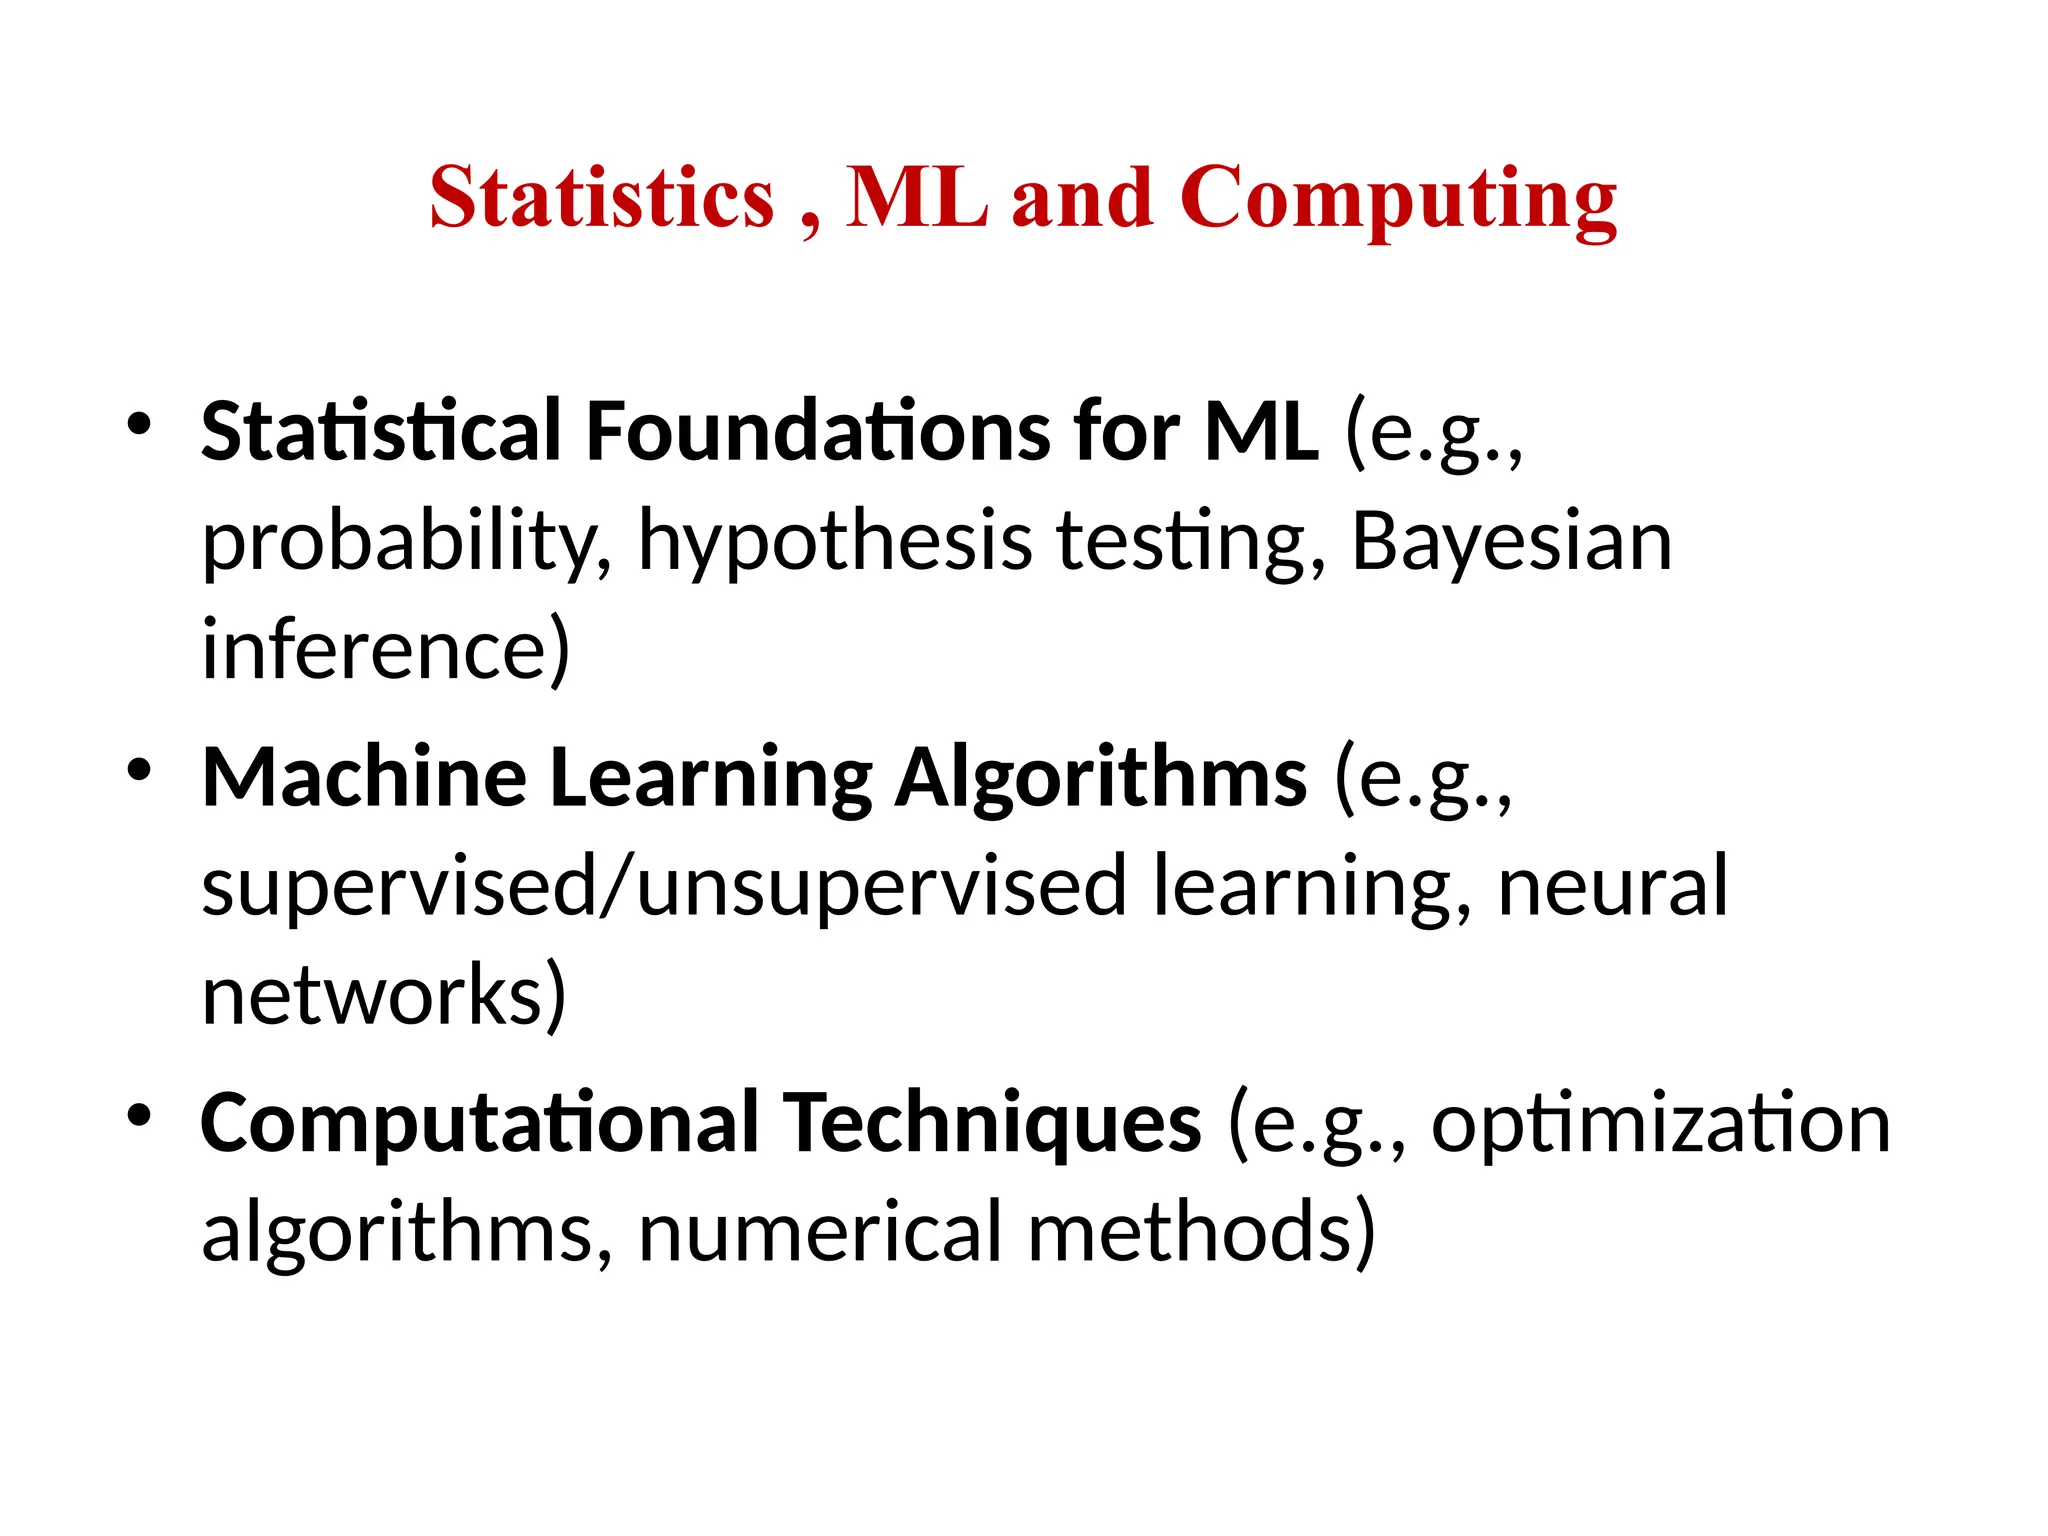
Statistics ML and Computing
Learning Algorithms
Data Science Classification
Data Science Algorithms
Data Science process
Prior knowledge
Data Preparation, Modeling and Application.
3.
Definition of DataScience
• Data science is the process of using scientific
methods, algorithms, and programming to
extract knowledge and insights from data. It
involves collecting, analyzing, and interpreting
large amounts of data to find hidden patterns
and trends
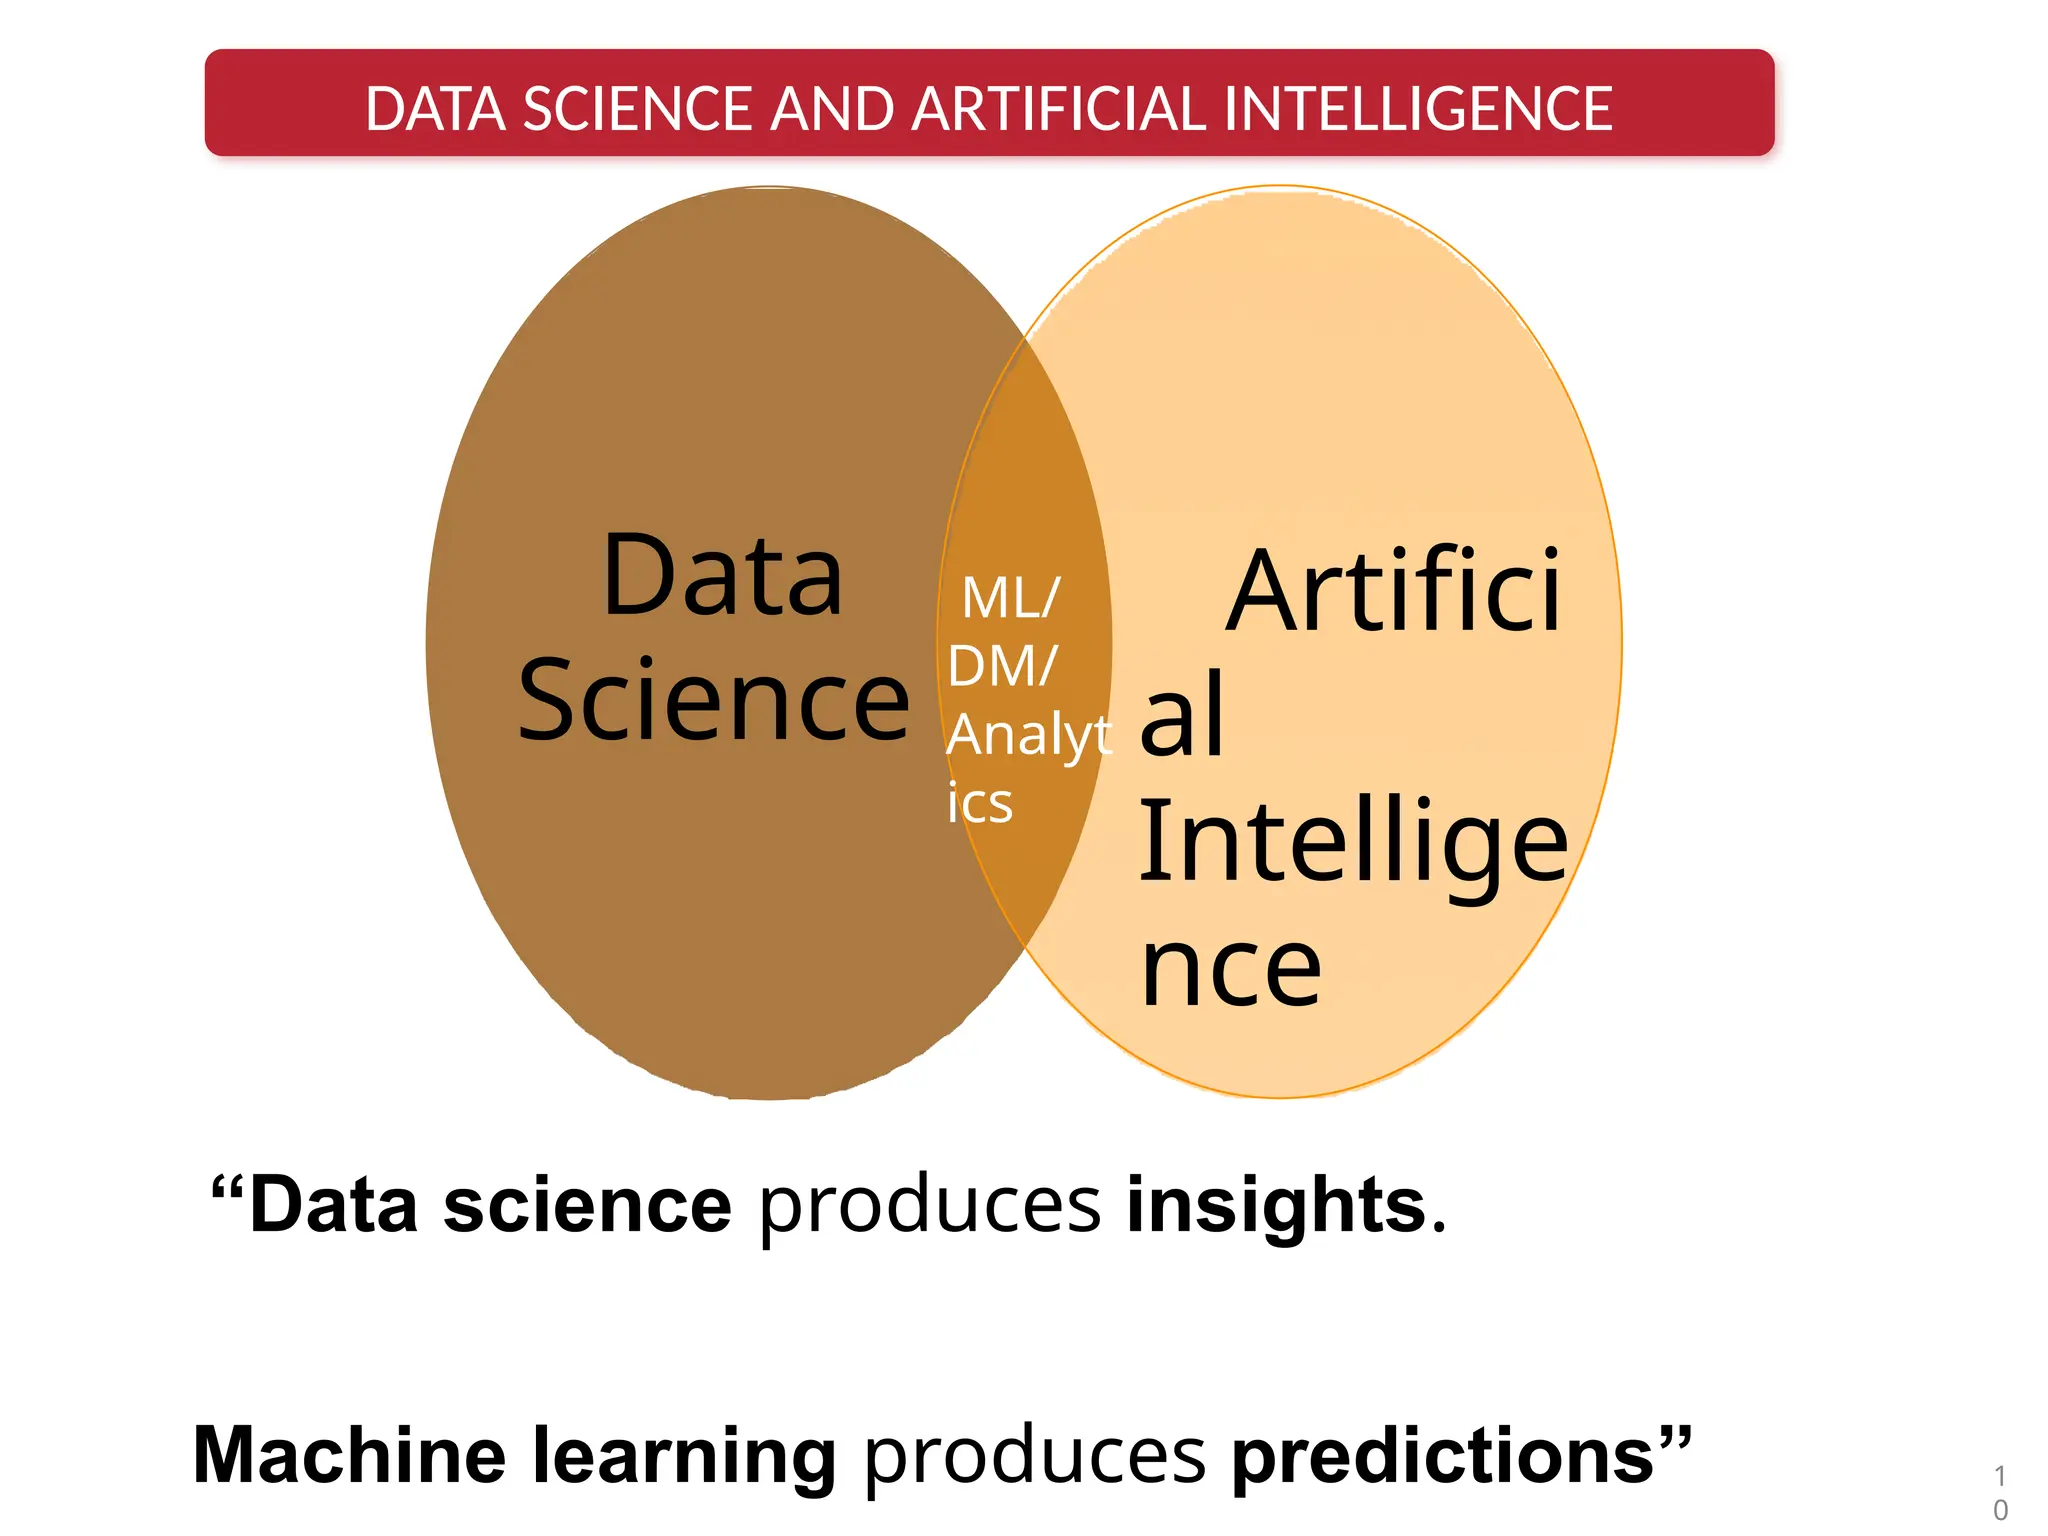
Data science andartificial intelligence are not the same.
“Data science and artificial intelligence are two technologies that are
transforming the world. While artificial intelligence powers data science
operations, data science is not completely dependent on AI. Data Science is
leading the fourth industrial revolution. ”
6.
Data science alsorequires machine learning algorithms,
which results in dependency on AI.
7.
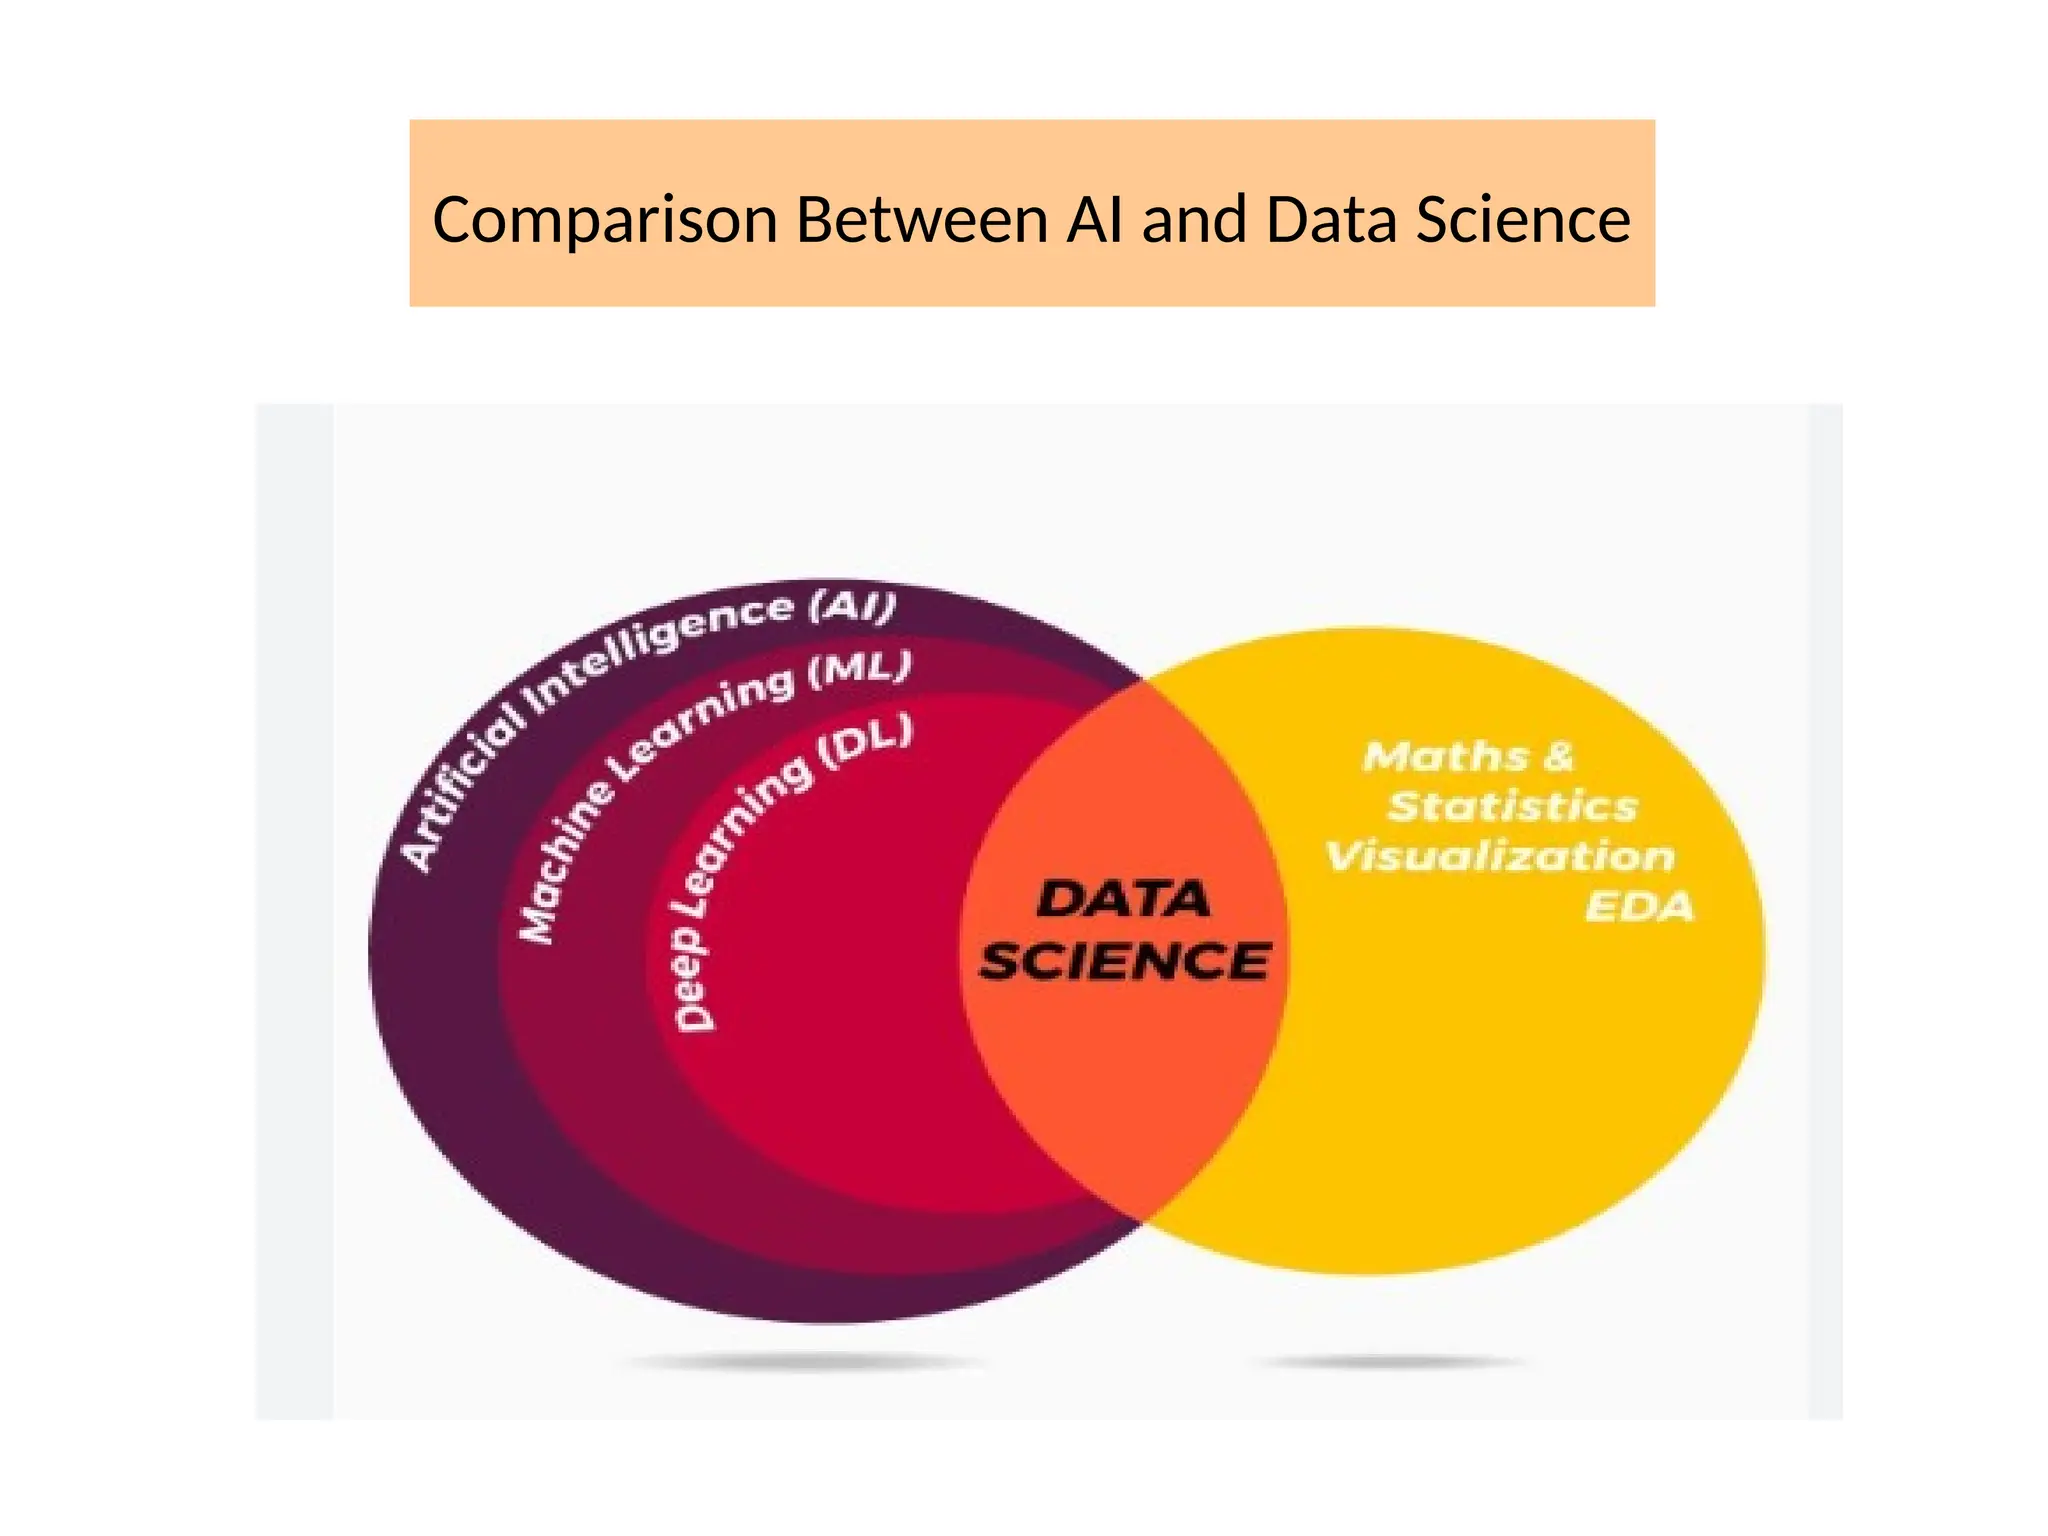
Comparison Between AIand Data Science
• Data science jobs require the knowledge of ML languages like R and
Python to perform various data operations and computer science
expertise.
• Data science uses more tools apart from AI. This is because data
science involves multiples steps to analyze data and generate
insights.
• Data science models are built for statistical insights whereas AI is
used to build models that mimic cognition and human
understanding.
8.
Comparison Between AIand Data
Science
• Today’s industries require both, data science and
artificial intelligence.
• Data science will help them make necessary data-
driven decisions and assess their performance in
the market, while artificial intelligence will help
industries work with smarter devices and
software that will minimize workload and
optimize all the processes for improves
innovation.
9
• They arenot the “same thing”
• Big data = crude oil
• Big data is about extracting “crude oil”,
transporting it in “mega tankers”, siphoning it
through “pipelines”, and storing it in “massive
silos”
• Data science is about refining the “crude oil” Carlos
Samohano Founder,
Data Science London
DATA SCIENCE AND BIG DATA
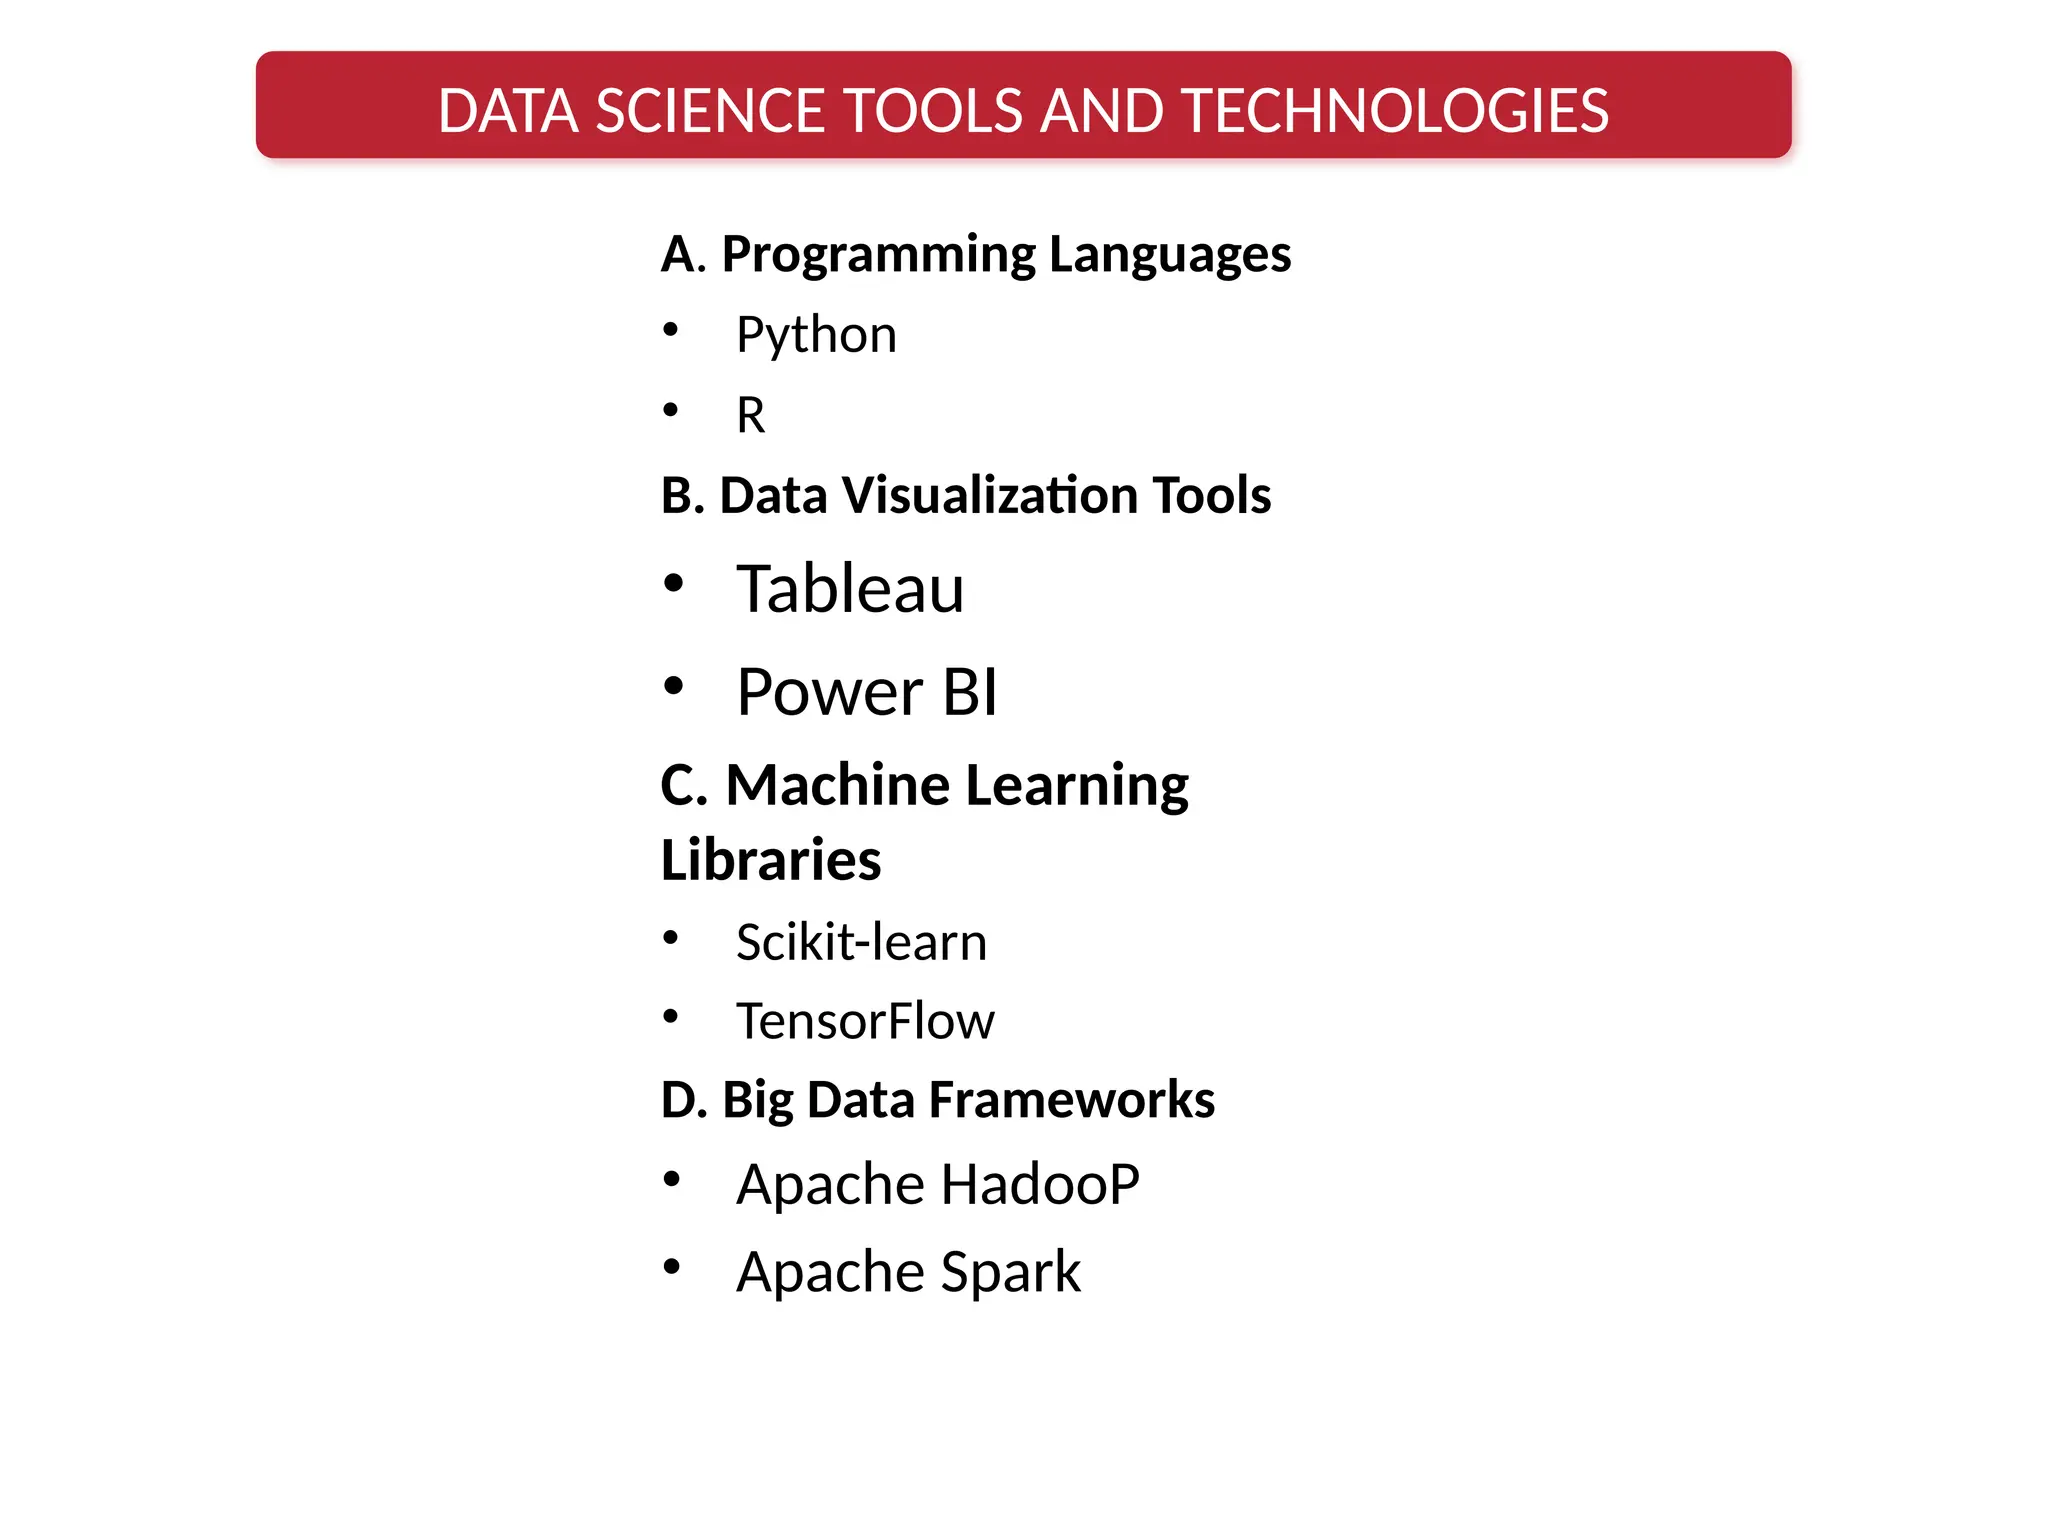
A. Programming Languages
•Python
• R
B. Data Visualization Tools
• Tableau
• Power BI
C. Machine Learning
Libraries
• Scikit-learn
• TensorFlow
D. Big Data Frameworks
• Apache HadooP
• Apache Spark
DATA SCIENCE TOOLS AND TECHNOLOGIES
15.
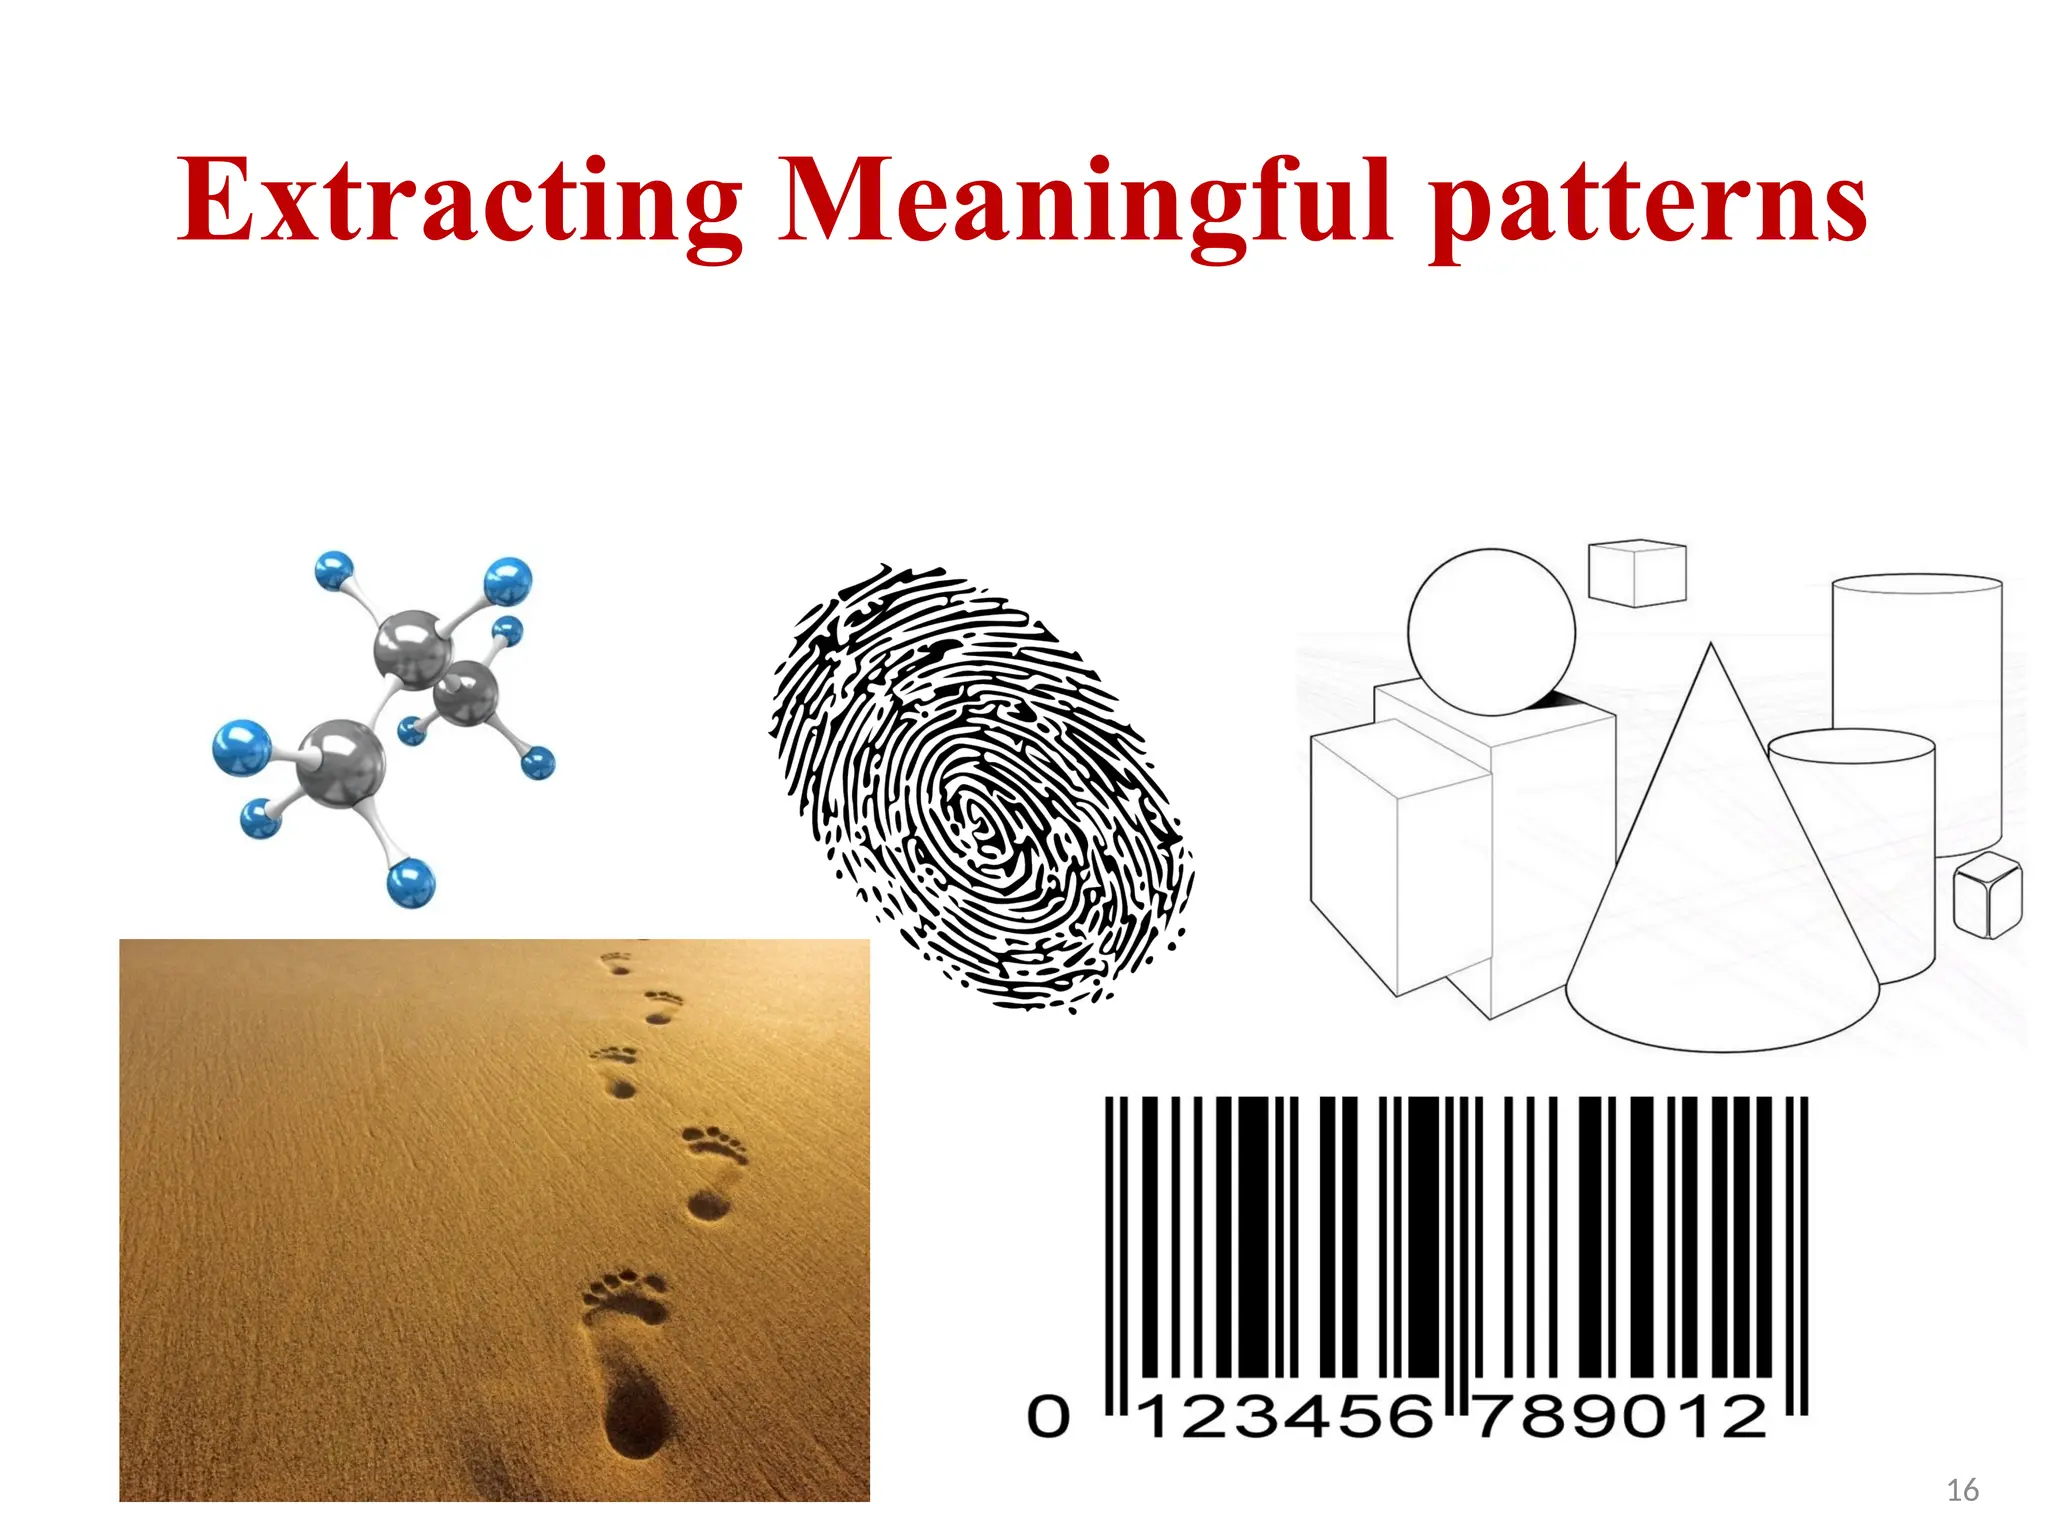
Extracting Meaningful patterns
Apattern is a set of objects or phenomena or
concepts where the elements of the set are
similar to one another in certain ways or aspects.
A pattern is an entity , that could be given a
name .
• Example : Fingerprint Image, handwritten word
, human face , speech signal , DNA sequence etc
18
PATTERN RECOGNITION PROCESS
Dataacquisition and sensing:
Measurements of physical variables.
Important issues: bandwidth, resolution , etc.
Pre-processing:
Removal of noise in data.
Isolation of patterns of interest from the background.
Feature extraction:
Finding a new representation in terms of features.
Classification
Using features and learned models to assign a pattern
to a category.
Post-processing
Evaluation of confidence in decisions.
19.
19
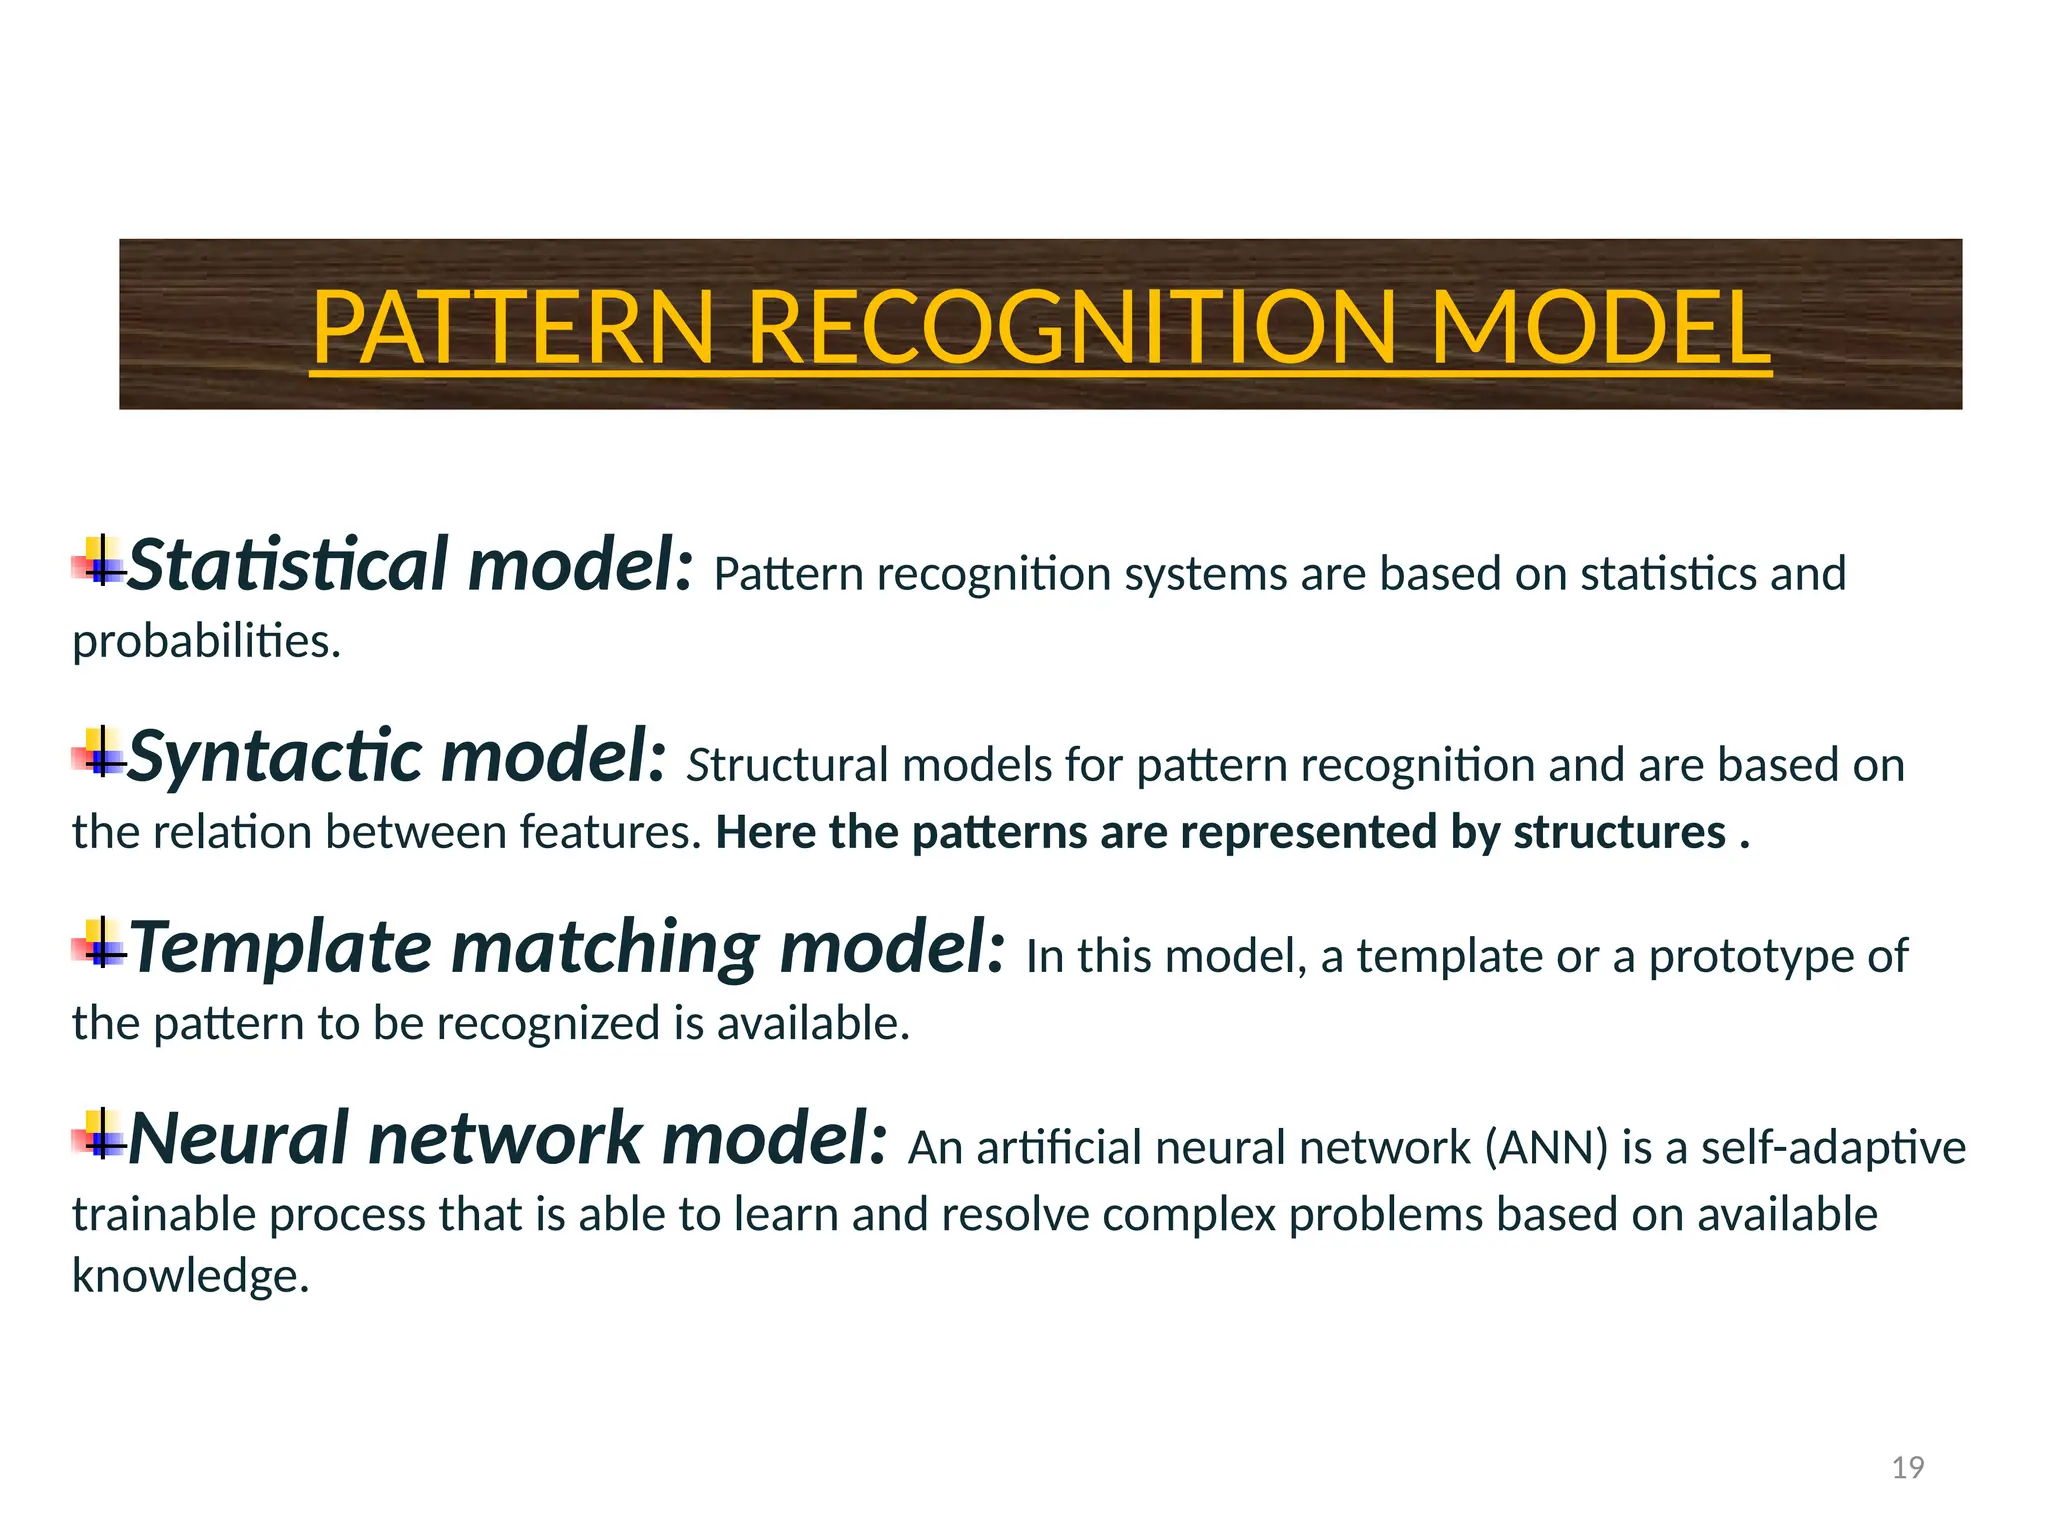
PATTERN RECOGNITION MODEL
Statisticalmodel: Pattern recognition systems are based on statistics and
probabilities.
Syntactic model: Structural models for pattern recognition and are based on
the relation between features. Here the patterns are represented by structures .
Template matching model: In this model, a template or a prototype of
the pattern to be recognized is available.
Neural network model: An artificial neural network (ANN) is a self-adaptive
trainable process that is able to learn and resolve complex problems based on available
knowledge.
20.
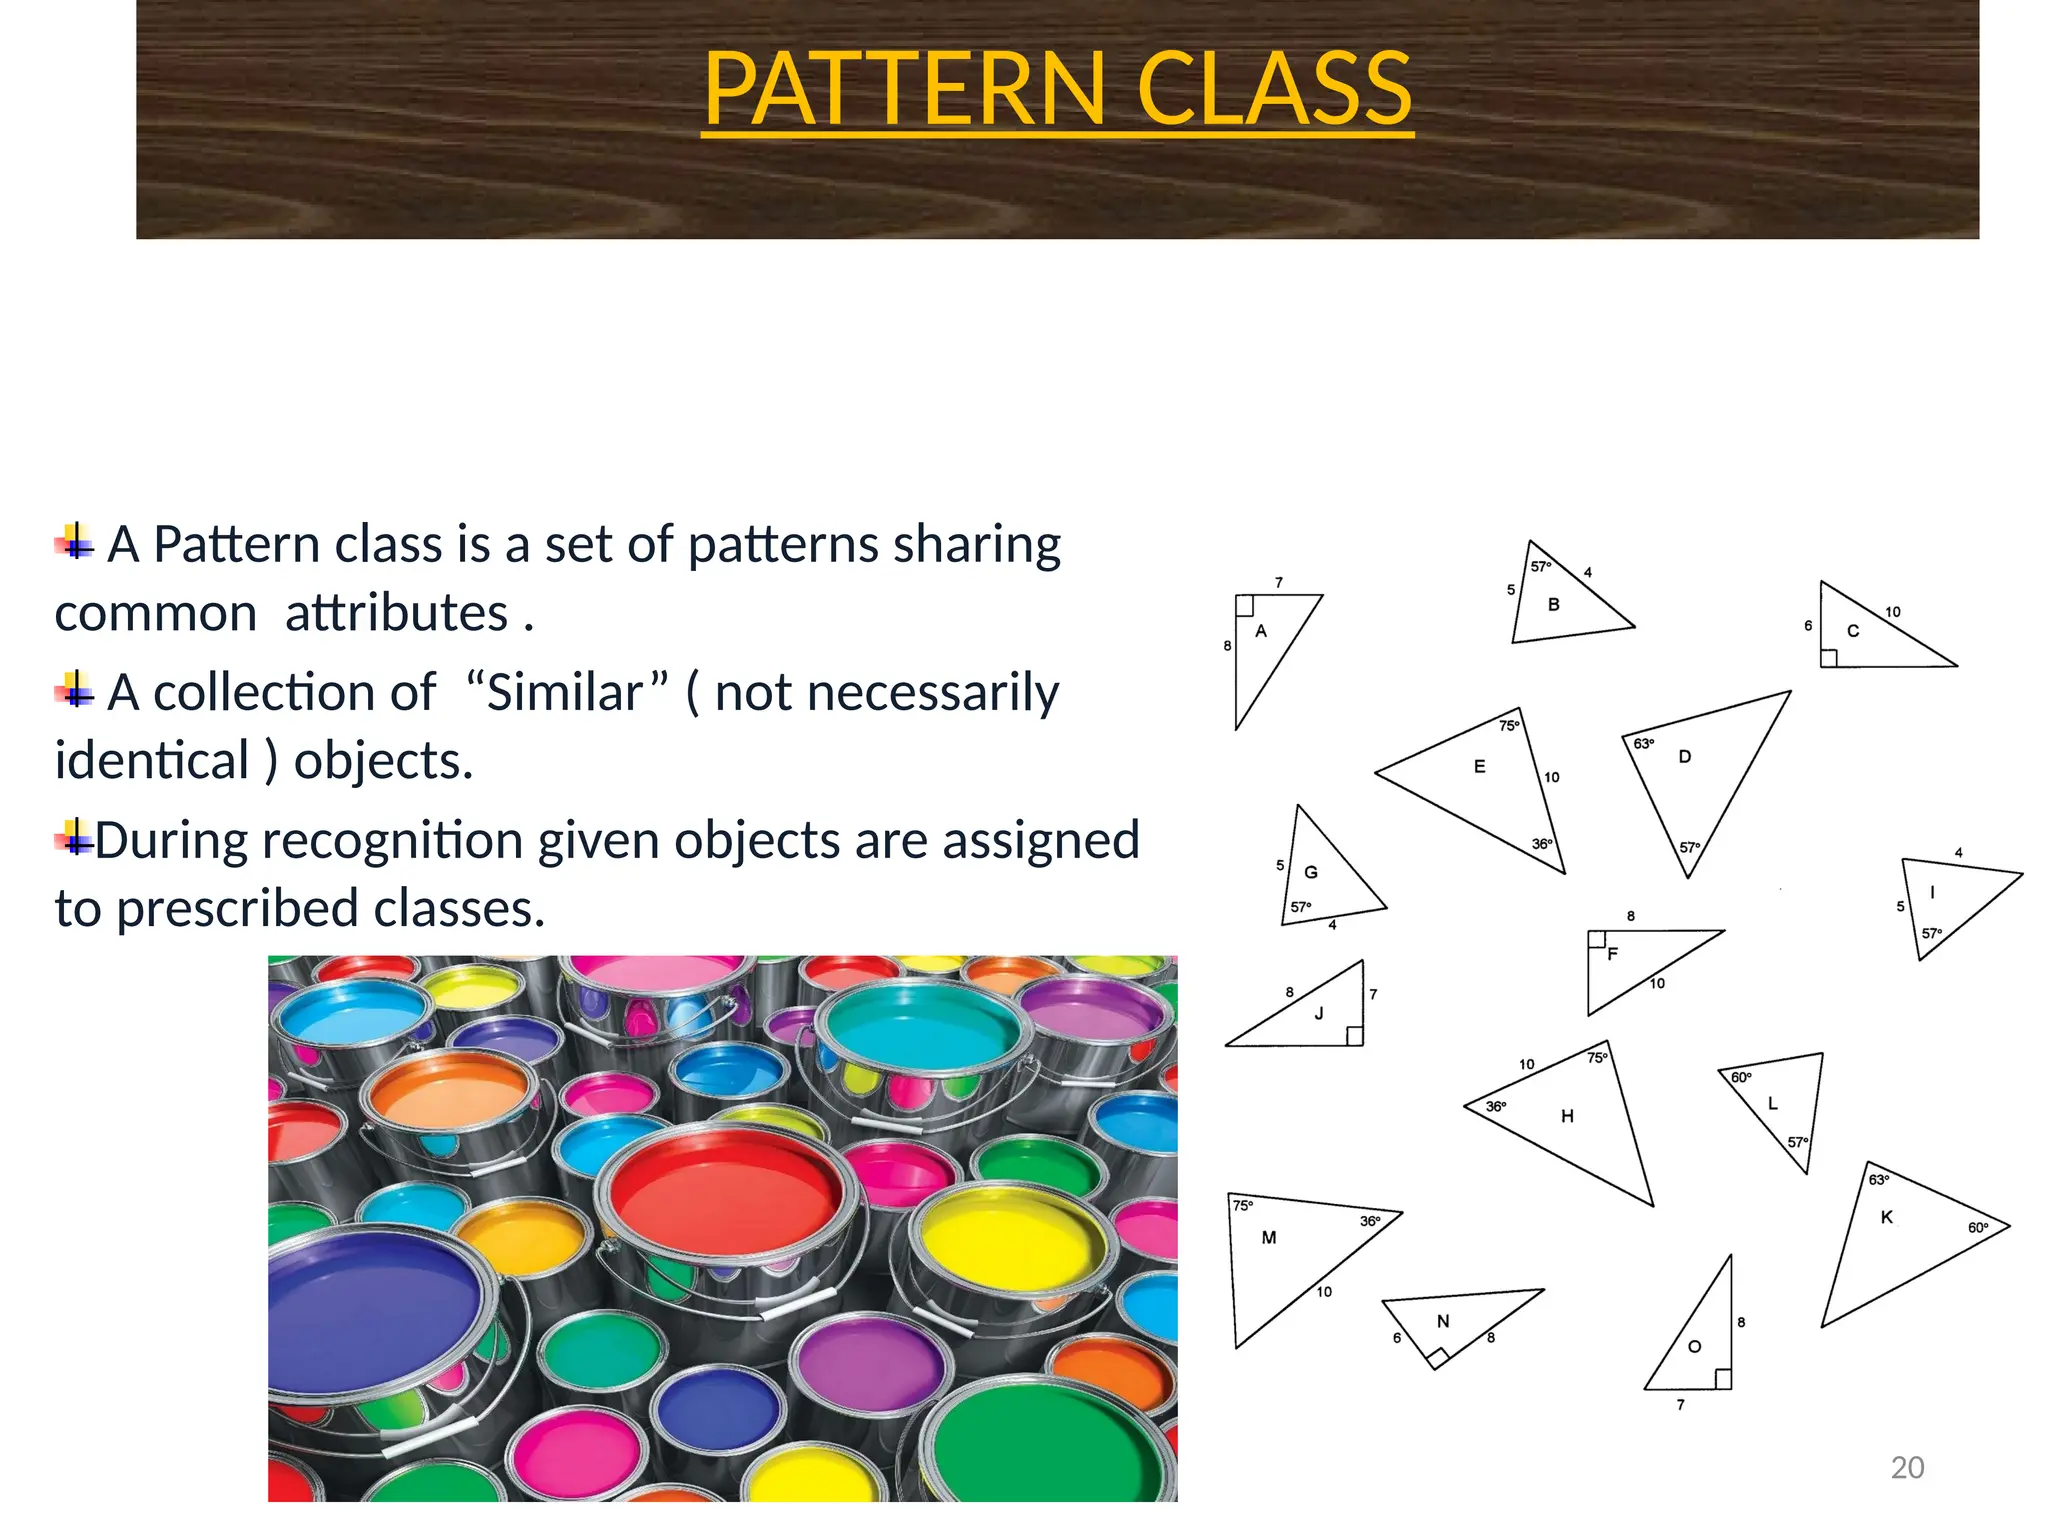
PATTERN CLASS
20
A Patternclass is a set of patterns sharing
common attributes .
A collection of “Similar” ( not necessarily
identical ) objects.
During recognition given objects are assigned
to prescribed classes.
21.
21
APPLICATIONS OF PATTERNRECOGNITION
Input: Images with characters (normally contaminated with noise)
Output: The identified character string
Useful in scenarios such as automatic license plate recognition (ALPR), optical
character recognition(OCR) ,etc.
CHARACTER RECOGNITION
22.
22
APPLICATIONS OF PATTERNRECOGNITION
Input: Acoustic signal (Sound waves etc)
Output: Contents of the speech
Useful in scenarios such as speech-to-text (STT), voice command and control etc.
SPEECH RECOGNITION
23.
23
APPLICATIONS OF PATTERNRECOGNITION
FINGERPRINT RECOGNITION
Input: Fingerprint of some person
Output: The persons identity.
Useful in scenarios such as computerized access control , criminal pursuit, etc.
24.
Building representative models/Datascience
Life Cycle
• The Data Science lifecycle is mainly designed for Big
Data problems and data science projects.
• The cycle is iterative to represent real project.
• To address the distinct requirements for performing
analysis on Big Data, step – by – step methodology is
needed to organize the activities and tasks involved with
acquiring, processing, analyzing, and repurposing data.
• Exploratory DataAnalysis (EDA) is a method used by data
scientists to analyze and investigate data sets. It's a
critical initial step in the data science workflow. EDA
involves:
• Summarizing:
• Visualizing:
• Identifying:
• Exploring:
• Outlier detection:
• Hypothesis testing:
DATA SCIENCE LIFECYCLE …….contd..
27.
Phase 1: Understandingthe problem –
The data science team learn and investigate the
problem.
Develop context and understanding.
Come to know about data sources needed and available
for the project.
The team formulates initial hypothesis that can be later
tested with data.
Hypothesis: An idea that is suggested as the possible
DATA SCIENCE LIFECYCLE …….contd..
28.
Phase 2: GatheringRelevant Data–
Steps to explore, preprocess, and condition data prior to modeling
and analysis.
It requires the presence of an analytic sandbox, the team execute,
load, and transform, to get data into the sandbox.
Data preparation tasks are likely to be performed multiple times
and not in predefined order.
Several tools commonly used for this phase are – Hadoop, Alpine
Miner, Open Refine, etc.
DATA SCIENCE LIFECYCLE …….contd..
29.
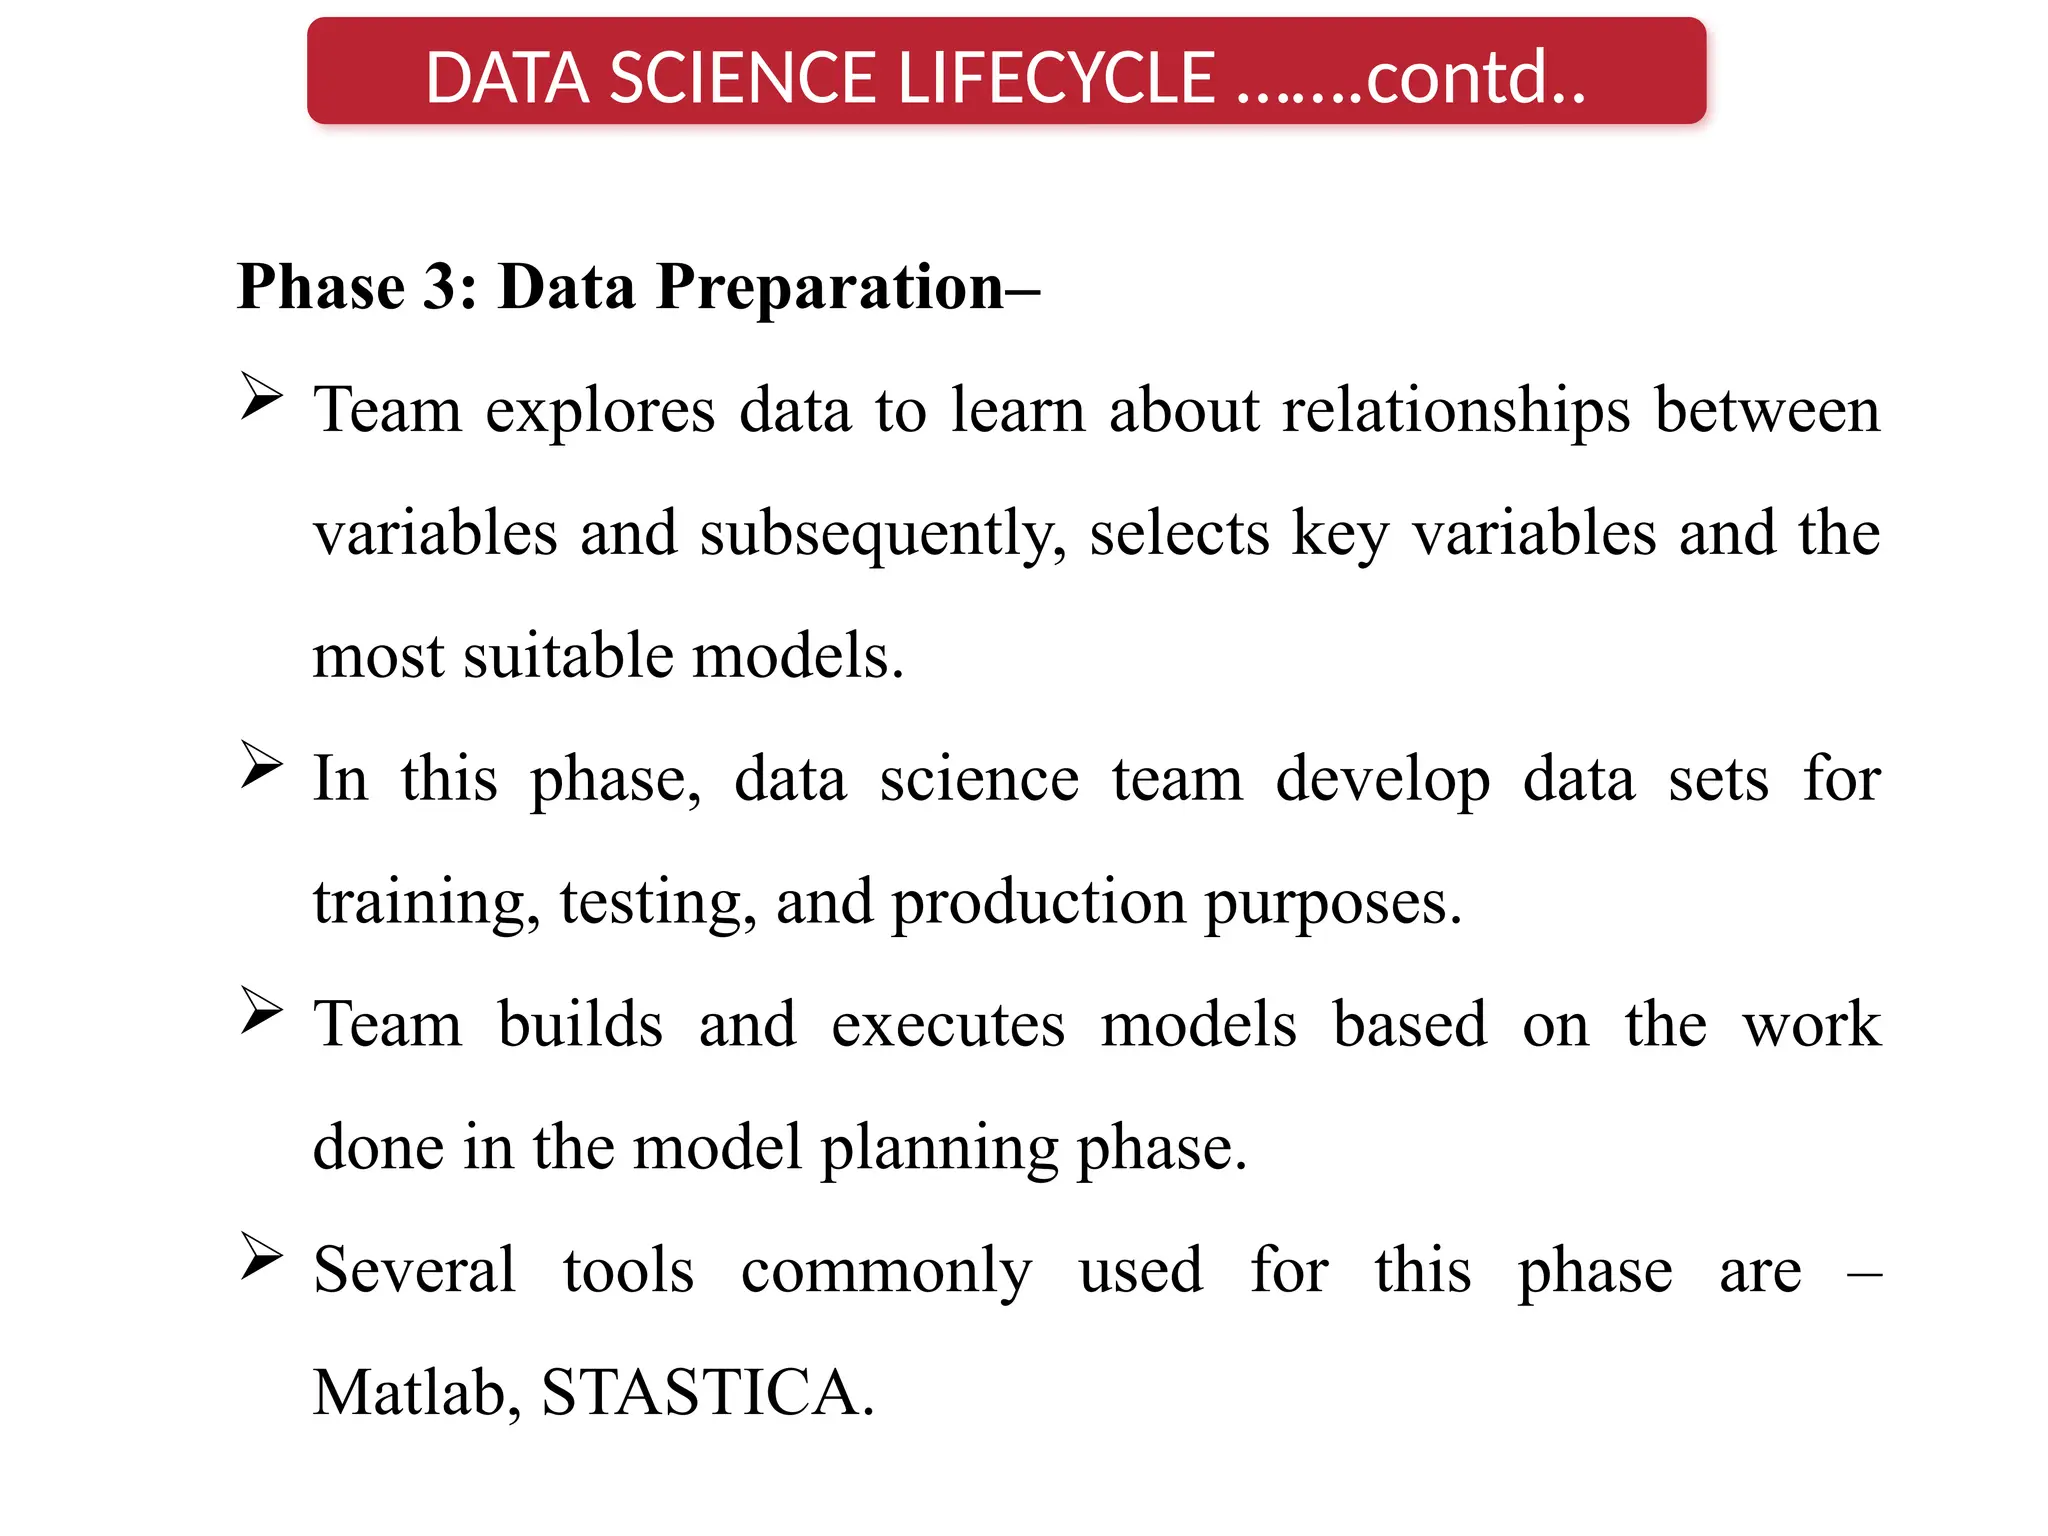
Phase 3: DataPreparation–
Team explores data to learn about relationships between
variables and subsequently, selects key variables and the
most suitable models.
In this phase, data science team develop data sets for
training, testing, and production purposes.
Team builds and executes models based on the work
done in the model planning phase.
Several tools commonly used for this phase are –
Matlab, STASTICA.
DATA SCIENCE LIFECYCLE …….contd..
30.
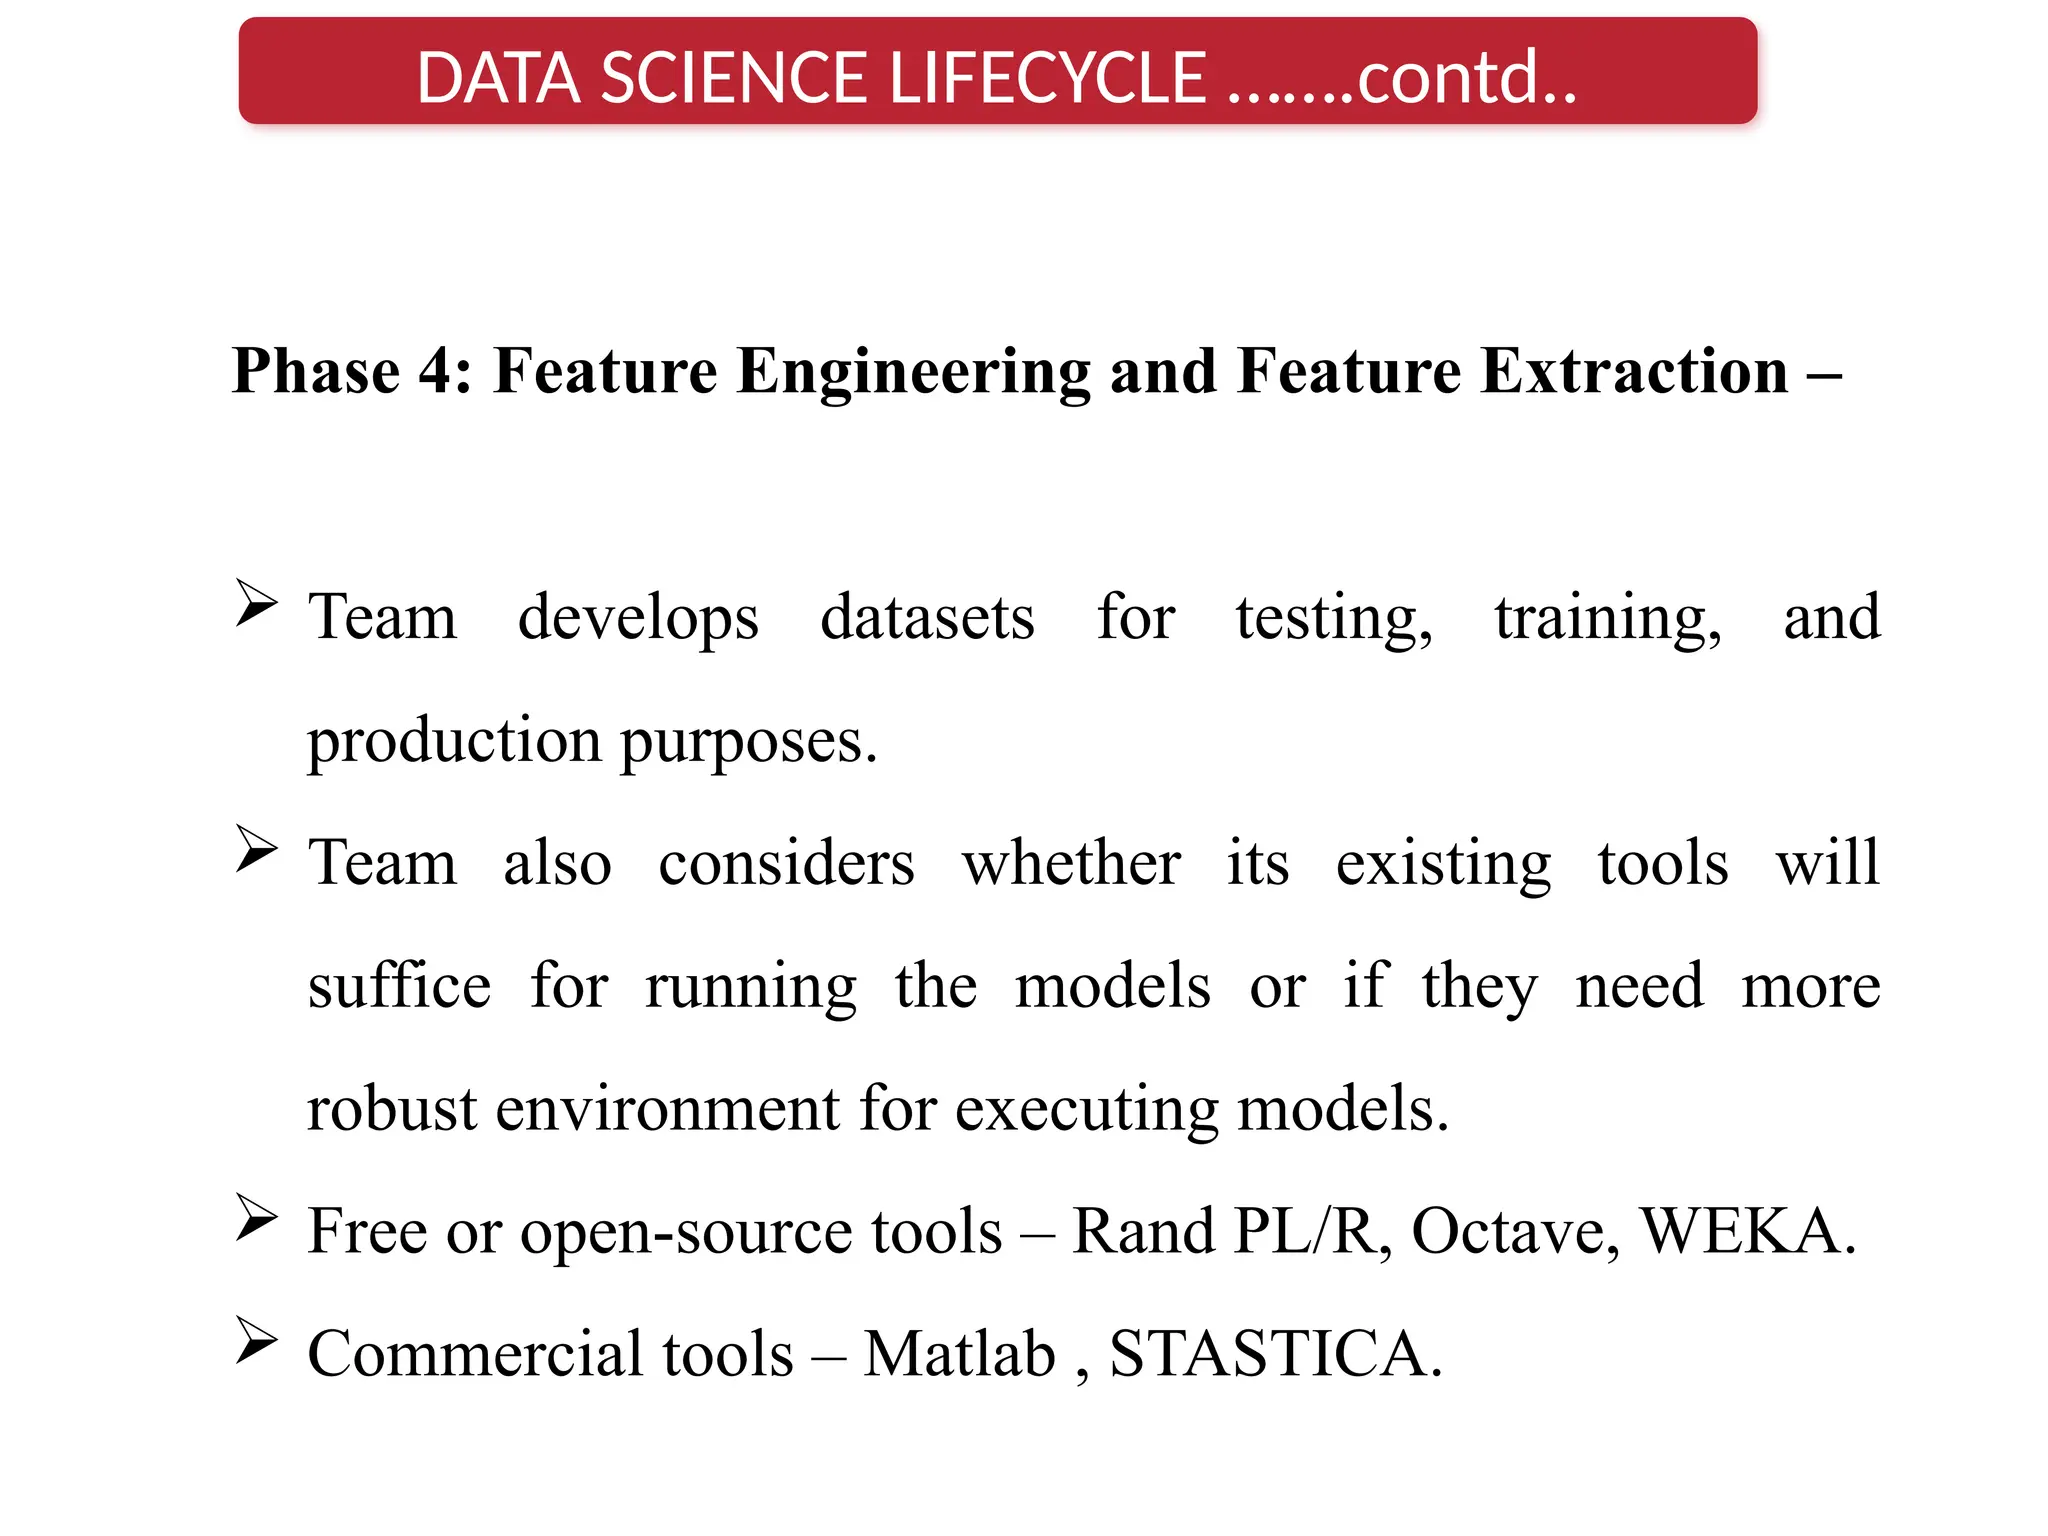
Phase 4: FeatureEngineering and Feature Extraction –
Team develops datasets for testing, training, and
production purposes.
Team also considers whether its existing tools will
suffice for running the models or if they need more
robust environment for executing models.
Free or open-source tools – Rand PL/R, Octave, WEKA.
Commercial tools – Matlab , STASTICA.
DATA SCIENCE LIFECYCLE …….contd..
31.
Phase 5: ModelBuilding and Deployment–
After executing model team need to compare outcomes of
modeling to criteria established for success and failure.
Team considers how best to articulate findings and
outcomes to various team members and stakeholders,
taking into account warning, assumptions.
Team should identify key findings, quantify business value,
and develop narrative to summarize and convey findings to
stakeholders.
DATA SCIENCE LIFECYCLE …….contd..
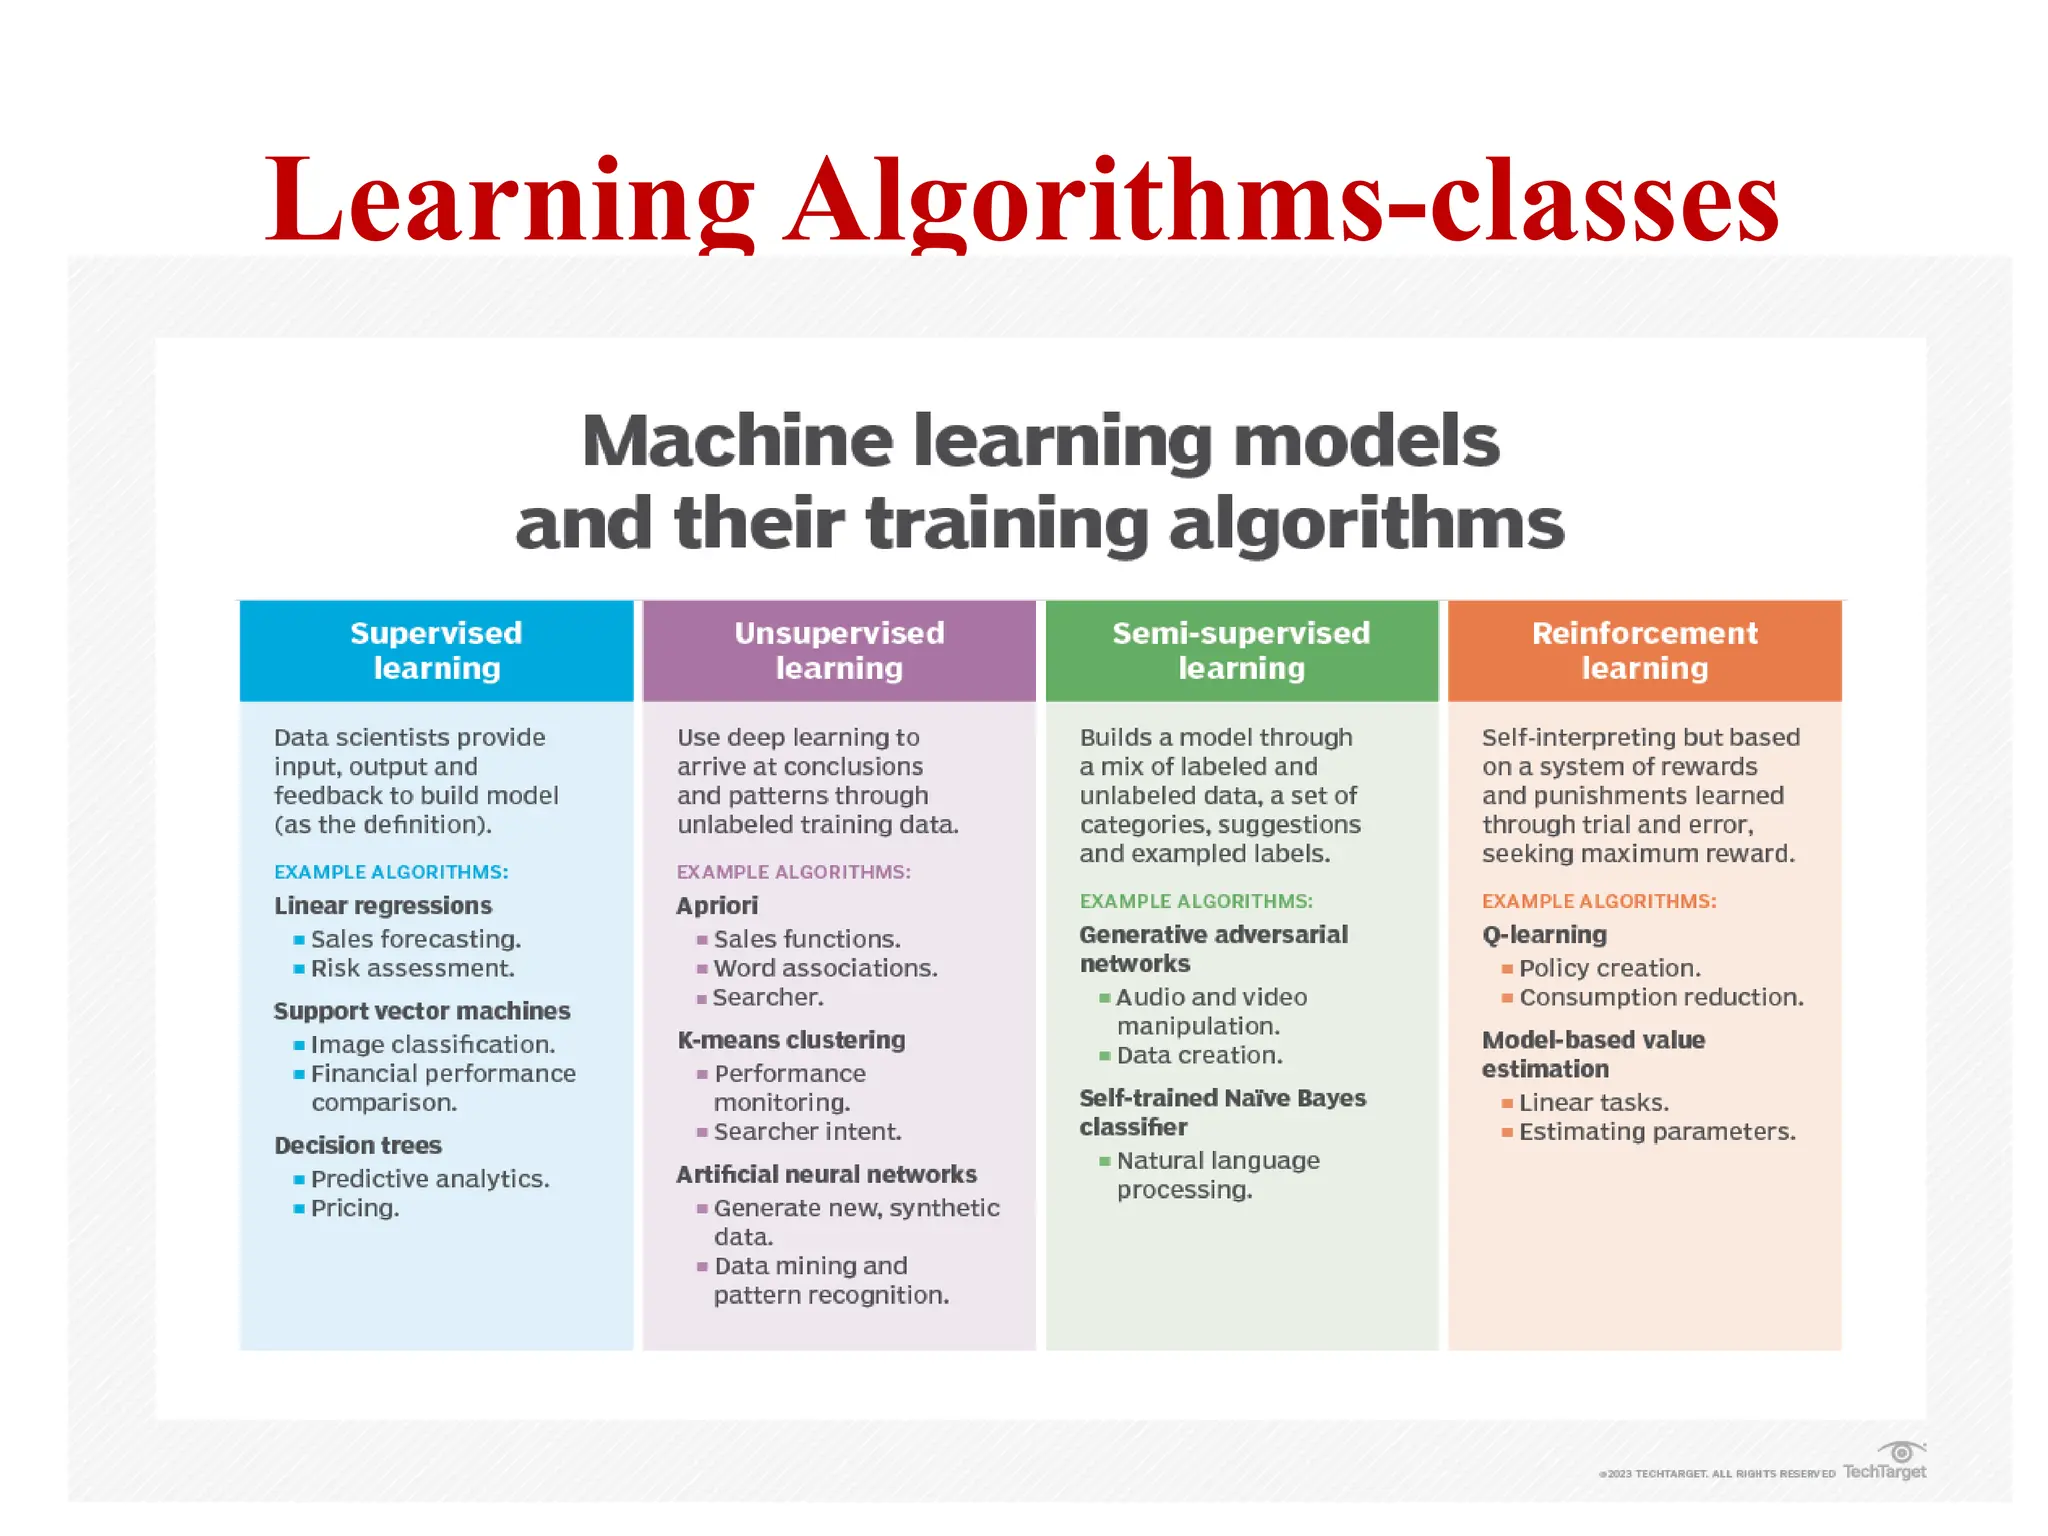
Learning Algorithms
Below isthe list of the top 10 commonly used Machine Learning Algorithms:
• Linear regression
• Logistic regression
• Decision tree
• SVM algorithm
• Naive Bayes algorithm
• KNN algorithm
• K-means
• Random forest algorithm
• Dimensionality reduction algorithms
• Gradient boosting algorithm and Ada-Boosting algorithm
36.
1. Linear Regression
•To understand the working functionality of Linear Regression, imagine how you would
arrange random logs of wood in increasing order of their weight. There is a catch;
however – you cannot weigh each log. You have to guess its weight just by looking at the
height and girth of the log (visual analysis) and arranging them using a combination of
these visible parameters. This is what linear regression in machine learning is like.
• In this process, a relationship is established between independent and dependent
variables by fitting them to a line. This line is known as the regression line and is
represented by a linear equation Y= a *X + b.
• In this equation:
• Y – Dependent Variable
• a – Slope
• X – Independent variable
• b – Intercept
• The coefficients a & b are derived by minimizing the sum of the squared difference of
distance between data points and the regression line.
37.
2. Logistic Regression
•Logistic Regression is used to estimate discrete values
(usually binary values like 0/1) from a set of independent
variables. It helps predict the probability of an event by fitting
data to a logit function. It is also called logit regression.
• These methods listed below are often used to help improve
logistic regression models:
• include interaction terms
• eliminate features
• regularize techniques
• use a non-linear model
38.
3. Decision Tree
•Decision Tree algorithm in machine learning is
one of the most popular algorithm in use
today; this is a supervised learning algorithm
that is used for classifying problems. It works
well in classifying both categorical and
continuous dependent variables. This
algorithm divides the population into two or
more homogeneous sets based on the most
significant attributes/ independent variables.
39.
4. SVM (SupportVector Machine) Algorithm
• SVM algorithm is a method of a classification
algorithm in which you plot raw data as points
in an n-dimensional space (where n is the
number of features you have). The value of
each feature is then tied to a particular
coordinate, making it easy to classify the data.
Lines called classifiers can be used to split the
data and plot them on a graph.
40.
5. Naive BayesAlgorithm
• A Naive Bayes classifier assumes that the presence of a
particular feature in a class is unrelated to the presence
of any other feature.
• Even if these features are related to each other, a Naive
Bayes classifier would consider all of these properties
independently when calculating the probability of a
particular outcome.
• A Naive Bayesian model is easy to build and useful for
massive datasets. It's simple and is known to outperform
even highly sophisticated classification methods.
41.
6.KNN (K- NearestNeighbors) Algorithm
• This algorithm can be applied to both classification and regression problems.
Apparently, within the Data Science industry, it's more widely used to solve
classification problems. It’s a simple algorithm that stores all available cases and
classifies any new cases by taking a majority vote of its k neighbors. The case is then
assigned to the class with which it has the most in common. A distance function
performs this measurement.
• KNN can be easily understood by comparing it to real life. For example, if you want
information about a person, it makes sense to talk to his or her friends and
colleagues!
• Things to consider before selecting K Nearest Neighbours Algorithm:
• KNN is computationally expensive
• Variables should be normalized, or else higher range variables can bias the
algorithm
• Data still needs to be pre-processed.
42.
7. K-Means
• Itis an unsupervised learning algorithm that solves clustering problems.
Data sets are classified into a particular number of clusters (let's call that
number K) in such a way that all the data points within a cluster are
homogenous and heterogeneous from the data in other clusters.
• How K-means forms clusters:
• The K-means algorithm picks k number of points, called centroids, for each
cluster.
• Each data point forms a cluster with the closest centroids, i.e., K clusters.
• It now creates new centroids based on the existing cluster members.
• With these new centroids, the closest distance for each data point is
determined. This process is repeated until the centroids do not change.
43.
8.Random Forest Algorithm
•A collective of decision trees is called a Random Forest. To classify a new
object based on its attributes, each tree is classified, and the tree “votes”
for that class. The forest chooses the classification having the most votes
(over all the trees in the forest).
• Each tree is planted & grown as follows:
• If the number of cases in the training set is N, then a sample of N cases is
taken at random. This sample will be the training set for growing the tree.
• If there are M input variables, a number m<<M is specified such that at
each node, m variables are selected at random out of the M, and the best
split on this m is used to split the node. The value of m is held constant
during this process.
• Each tree is grown to the most substantial extent possible. There is no
pruning.
44.
9. Dimensionality ReductionAlgorithms
• In today's world, vast amounts of data are being
stored and analyzed by corporates, government
agencies, and research organizations. As a data
scientist, you know that this raw data contains a
lot of information - the challenge is to identify
significant patterns and variables.
• Dimensionality reduction algorithms like Decision
Tree, Factor Analysis, Missing Value Ratio, and
Random Forest can help you find relevant details.
45.
10.Gradient Boosting Algorithmand AdaBoosting Algorithm
• Gradient Boosting Algorithm and AdaBoosting Algorithm are
boosting algorithms used when massive loads of data have to
be handled to make predictions with high accuracy. Boosting is
an ensemble learning algorithm that combines the predictive
power of several base estimators to improve robustness.
• In short, it combines multiple weak or average predictors to
build a strong predictor. These boosting algorithms always
work well in data science competitions like Kaggle, AV
Hackathon, CrowdAnalytix. These are the most preferred
machine learning algorithms today. Use them, along with
Python and R Codes, to achieve accurate outcomes
Data Science Classification
•In data science, classification is a type of
supervised machine learning where the goal is
to predict the category or label of new
observations based on past data.
• It involves mapping input data to discrete
output classes.
49.
Key Concepts inClassification
• Supervised Learning:
– The training dataset contains both input features and corresponding
class labels.
– The model learns to map input features to labels.
• Classes (Categories):
– Binary Classification: Two classes (e.g., spam vs. not spam).
– Multiclass Classification: More than two classes (e.g., classifying
emails into spam, promotions, and social).
• Features:
– Independent variables or attributes used to predict class labels.
• Target Variable:
– The dependent variable representing the class label.
50.
Common Classification Algorithms
•Logistic Regression: For binary classification
problems.
• Decision Trees: Tree-like structure for decision
making.
• Random Forest: Ensemble of multiple decision trees.
• Support Vector Machine (SVM): Finds the optimal
hyperplane for separation.
• k-Nearest Neighbors (k-NN): Classifies based on the
majority class of nearest data points.
51.
Evaluation Metrics forClassification
• Accuracy: Overall correctness of predictions.
• Precision: True positives divided by all predicted
positives.
• Recall (Sensitivity): True positives divided by all actual
positives.
• F1-Score: Harmonic mean of precision and recall.
• ROC-AUC Curve: Measures the trade-off between
sensitivity and specificity.
• Confusion Matrix: Visualization of model performance.
52.
Applications of Classificationin Data Science
• Email Spam Detection: Classify emails as spam or
not.
• Customer Churn Prediction: Identify customers
likely to leave a service.
• Medical Diagnosis: Classify diseases based on
symptoms.
• Sentiment Analysis: Determine if a review is
positive, negative, or neutral.
• Fraud Detection: Identify fraudulent transactions.
53.
Prior knowledge
• Beforediving into the field of Data Science,
it's essential to have a solid foundation in
certain subjects.
• This prior knowledge will help you better
understand data, choose appropriate
algorithms, and interpret results. Here's a
breakdown of the key areas to focus on
54.
• 1. Mathematics
•2. Programming & Tools
• 3. Machine Learning and Algorithms
• 4. Data Engineering and Databases
• 5. Data Wrangling and Preprocessing
• 6. Communication and Storytelling
• 7. Soft Skills
55.
1. Mathematics
• LinearAlgebra:
– Vectors, matrices, and matrix operations (addition,
multiplication, inversion).
– Eigenvalues and eigenvectors (important in dimensionality
reduction algorithms like PCA).
• Probability & Statistics:
– Probability theory: Bayes' Theorem, distributions (e.g., normal,
binomial), and random variables.
– Regression analysis: Linear regression, correlation, and
multivariate regression.
– Sampling techniques: Random sampling, stratified sampling, and
sampling distribution.
56.
2. Programming &Tools
• Python:
– Python is the most widely used language in data science due to its
simplicity and vast ecosystem of libraries like Pandas, NumPy,
SciPy, Matplotlib, Scikit-learn, TensorFlow, PyTorch.
– R: Another popular language, particularly for statistical analysis
and data visualization.
• SQL (Structured Query Language):
– Essential for extracting, manipulating, and querying data from
relational databases (e.g., MySQL, PostgreSQL).
• Data Visualization Tools:
– Tools like Matplotlib, Seaborn, and Plotly (in Python)
– Tableau or Power BI for interactive dashboards.
57.
3.Machine Learning andAlgorithms
• Supervised Learning:
– Classification (e.g., Logistic Regression, Decision Trees, k-NN, SVM)
and Regression (e.g., Linear Regression, Ridge/Lasso).
– Performance metrics: Accuracy, precision, recall, F1-score, ROC-AUC,
etc.
• Unsupervised Learning:
– Clustering (e.g., K-means, Hierarchical Clustering, DBSCAN).
– Association Rules (e.g., Apriori, Eclat).
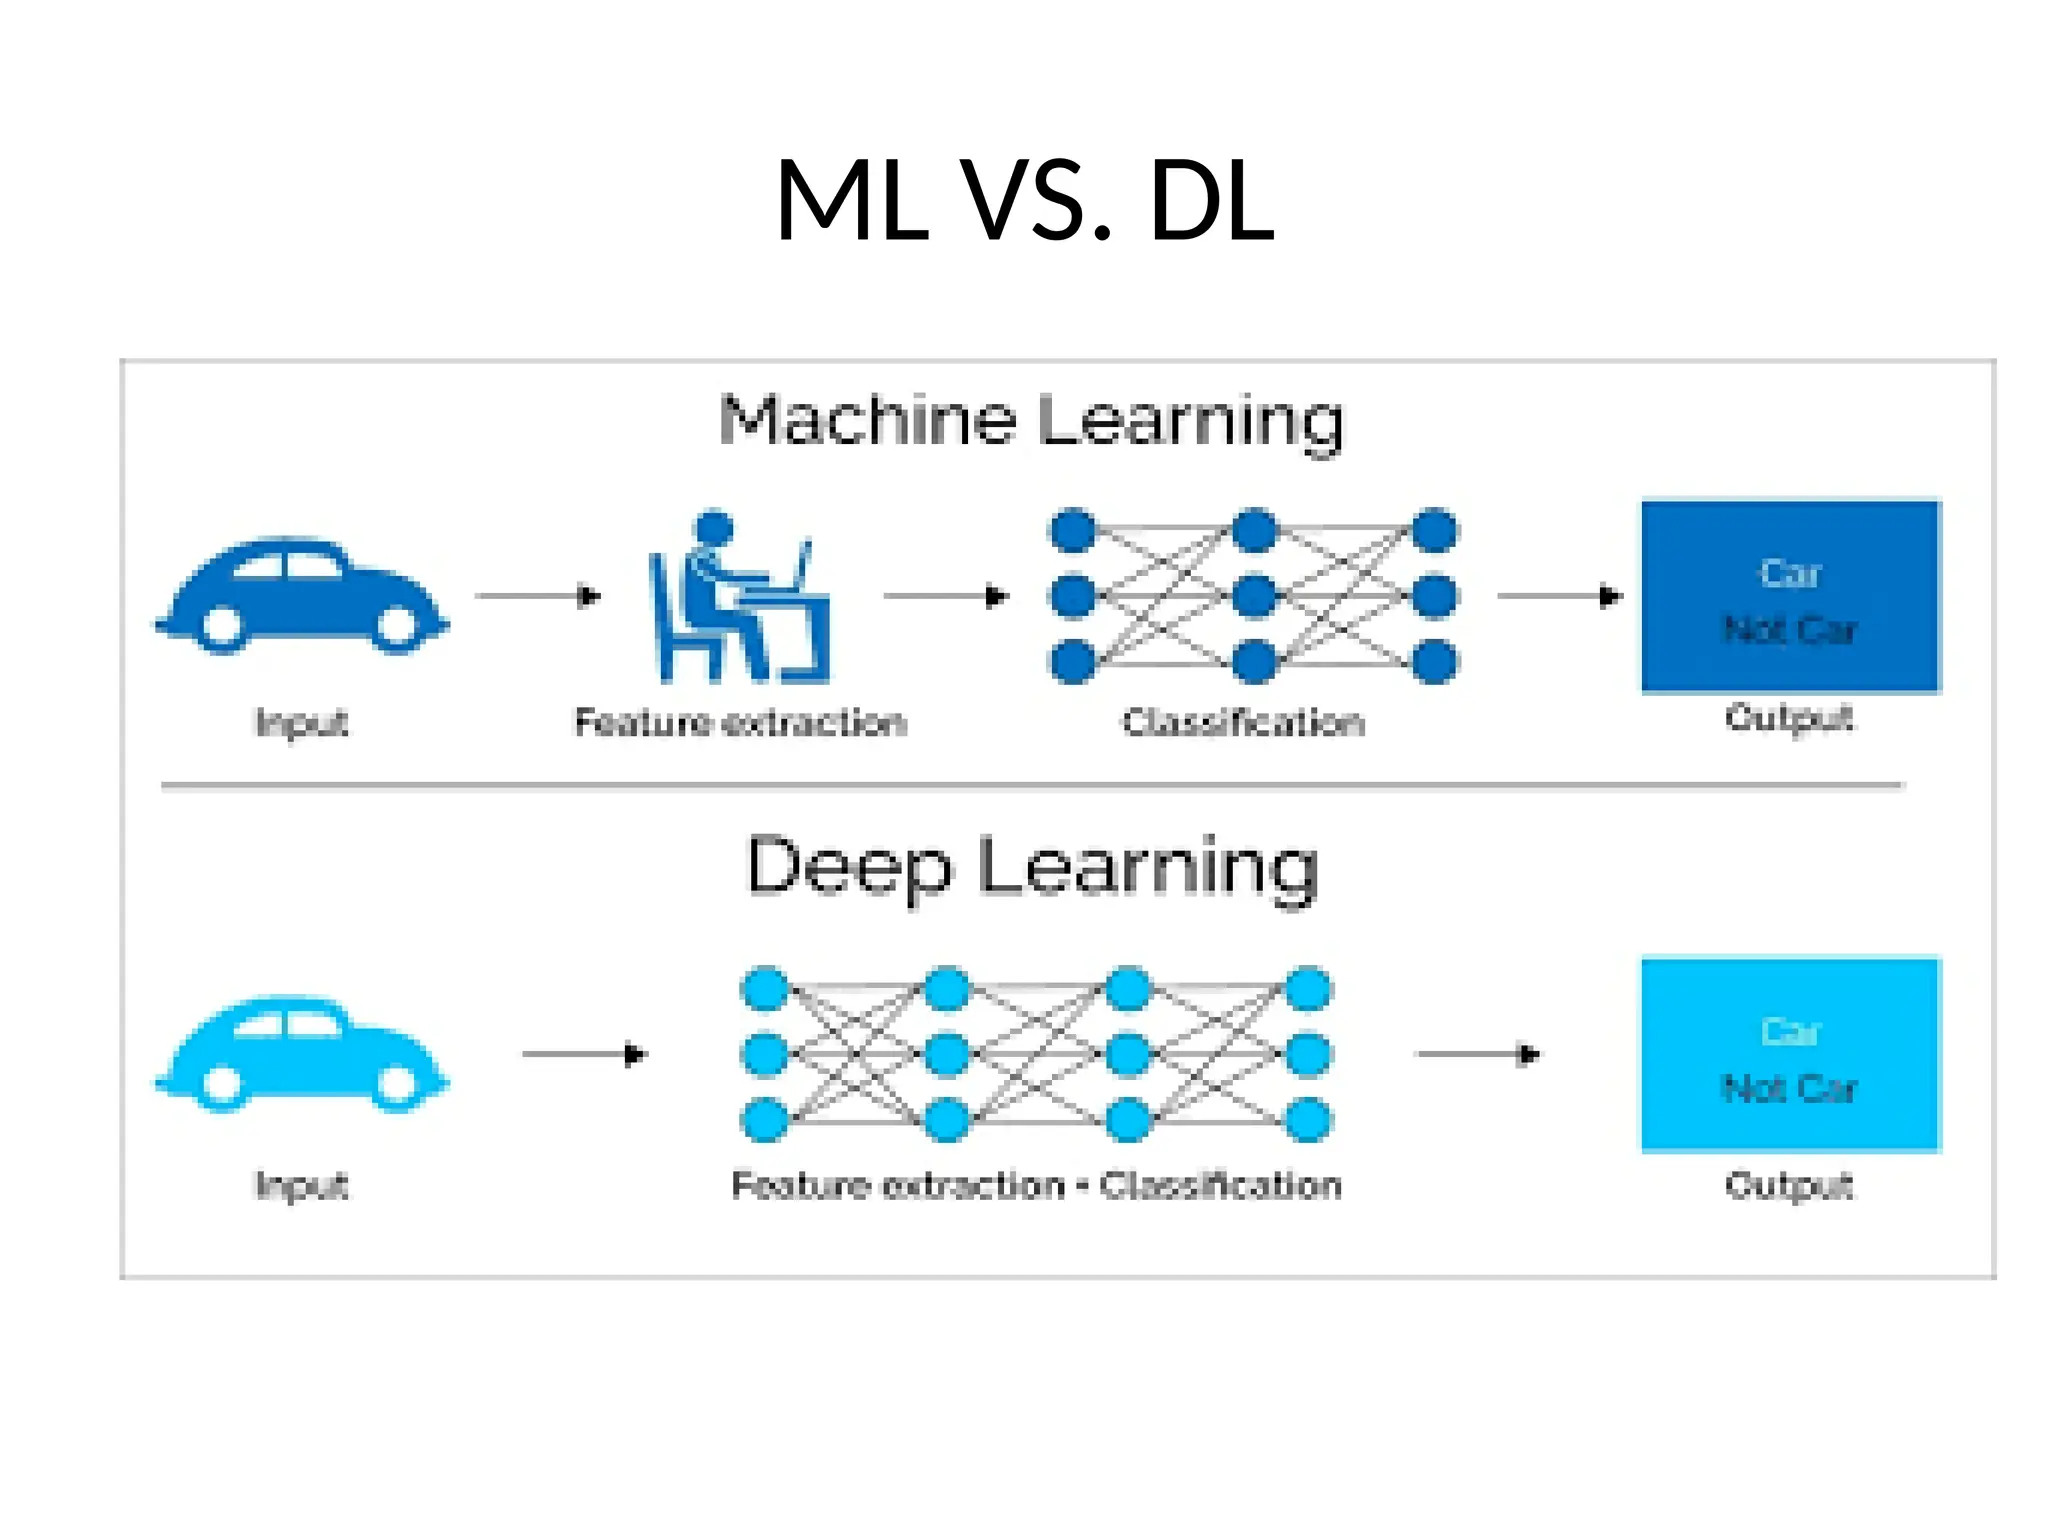
• Deep Learning:
– Neural Networks: Perceptrons, Feedforward Neural Networks.
– Convolutional Neural Networks (CNNs) for image data.
– Recurrent Neural Networks (RNNs) and LSTMs for sequence data.
58.
4. Data Engineeringand Databases
• Databases and Data Warehouses:
– Understanding relational databases
– Big Data Technologies:
– Familiarity with frameworks like Hadoop and
Spark for processing large datasets efficiently.
59.
5. Data Wranglingand Preprocessing
• Handling missing data: Techniques like
imputation, removal, or filling with default
values.
• Feature engineering: Creating new features from
raw data to improve model performance.
• Data transformation: Normalization, scaling,
encoding categorical variables (e.g., one-hot
encoding).
60.
6. Communication andStorytelling
• Data Visualization: Being able to visualize data
insights clearly using charts and graphs.
• Reporting: Summarizing the analysis,
explaining methodology, and presenting
results in a way that non-technical
stakeholders can understand.
• Storytelling: Presenting a narrative around the
data to support decision-making.
61.
7. Soft Skills
•Critical Thinking: Ability to approach problems
from different angles and think analytically.
• Problem-Solving: Tackling complex business
problems with a data-driven approach.
63
Data collectionis a fundamental step in the data analytics and
visualization process.
The quality and relevance of the collected data significantly impact the
insights and decisions derived from the analysis.
Effective data collection and visualization strategies are essential for
extracting valuable insights and empowering data-driven decision-
making.
It's a dynamic process that requires continuous refinement based on
user feedback and changing business needs.
Data Collection/preparation Strategies
64.
64
Define ClearObjectives
Identify Relevant Data Sources
Data Quality Assessment
Consider Structured and Unstructured Data
Real-time Data Collection
Data Privacy and Ethics
Sampling Techniques
Surveys and Questionnaires
Collaboration with Stakeholders
Data Integration
Feed back loops
Data collection/preparation strategies in the context of data
analytics and visualization
65.
65
Clearly outline thegoals and objectives
of your data analytics and visualization
project.
Understand the questions you want to
answer and the insights you aim to
derive.
Knowing what insights you aim to gain
will guide your data collection efforts.
1.Define Clear Objectives
66.
66
Determine the sourcesof data that are
relevant to your objectives.
This can include databases, spread
sheets, API’s(Application Program
Interface), external datasets, or a
combination of these.
2.Identify Relevant Data Sources
Determine the key performance indicators (KPIs)
and metrics relevant to your analysis and
visualization goals.
These metrics will drive the selection of data
sources and variables.
Choose data sources that align with your
67.
67
Assess the qualityof available data. Check
for completeness, accuracy, consistency,
and relevance.
Cleaning and pre-processing may be
necessary to address any issues.
Prioritize data quality over quantity.
Ensure that the data collected is accurate, complete,
and reliable.
Address issues such as missing values, outliers, and
inconsistencies early in the process
3.Data Quality Assessment
68.
68
Depending on yourobjectives,
collect both structured data
(e.g., databases) and
unstructured data (e.g., text,
images) for a more
comprehensive analysis.
4.Consider Structured and Unstructured Data
69.
69
If your analysisrequires real-time
insights, consider implementing
systems for collecting and
processing data in real-time.
This is especially important for
dynamic datasets.
Depending on the nature of your
analysis, consider implementing
real-time data collection
processes.
5.Real-time and Automated Data Collection
70.
70
Ensure compliance withdata privacy
regulations.
Obtain necessary permissions for data
collection, especially when dealing with
personal or sensitive information.
Adhere to data security and privacy regulations.
Protect sensitive information and ensure
compliance with legal requirements to maintain
the trust of stakeholders
6.Data Privacy and Ethics
71.
71
Use samplingmethods if working with large datasets.
This involves selecting a representative subset of data
for analysis, which can save time and resources.
If working with large datasets, consider using sampling
techniques to extract a representative subset for analysis.
This can save computational resources and speed up the
analysis.
7.Sampling Techniques
72.
72
Design and deploysurveys or
questionnaires to gather specific
information directly from users or
relevant stakeholders.
Ensure that the questions align
with your objectives.
8.Surveys and Questionnaires
73.
73
Collaborate with domainexperts and
stakeholders to gain insights into the
context of the data.
Their input can help refine data
collection strategies.
Foster collaboration between teams responsible for data collection
and those performing analytics and visualization.
Clear communication ensures that the collected data meets the
analytical requirements.
9.Collaboration with
Stakeholders
74.
74
Integrate data fromdifferent
sources to create a unified
dataset.
Ensure compatibility and
consistency when combining data
from various platforms.
10.Data Integration
75.
75
Establish feedback loopsto
continuously improve data collection
processes.
Monitor the performance of analytics
and visualizations and adjust data
collection strategies as needed.
11.Feedback Loops
76.
76
Remember toconsider ethical and privacy considerations during
data collection, and ensure data quality through proper cleaning
and pre-processing before analysis and visualization.
Gather specific information through structured sets of questions.
Collect subjective data, opinions, and preferences.
Qualitative data collection, understanding perspectives. Study
natural behaviour, processes, and situations.
Collect large volumes of diverse data from the internet. Common in
healthcare, manufacturing, and environmental monitoring.
Social Media Monitoring Monitor public opinions, brand sentiment,
and identify trends.
Transaction Records Identify patterns, trends, and anomalies in
business processes. Focus Groups Obtain diverse opinions and
insights on specific topics.
Summary
78
Effective datacollection is the foundation of
meaningful data analytics and visualization.
Data pre-processing/modelling is a crucial step
in the data analytics and visualization process.
It involves cleaning, transforming, and
organizing raw data into a format that can be
effectively utilized for analysis and
visualization
Data pre-processing/modelling overview in Data
science & visualization
80
• Data cleaningis the process of detecting corrupt
data and inaccurate records from a record set or
database table.
• The main use of cleaning step is based on
detecting incomplete, inaccurate, inconsistent
and irrelevant data and applying techniques to
modify or delete this useless data.
DATA CLEANING
81.
81
• Data Integrationfocuses on unification of data
residing in different sources and presenting a
unified view of these data.
• Data with different representations are put together
and any conflicts resulting from it are resolved.
• This process becomes vital in a number of scientific
and commercial applications. With increasing
volume and exponential growth of data, integrating
it becomes even more significant.
DATA INTEGRATION
82.
82
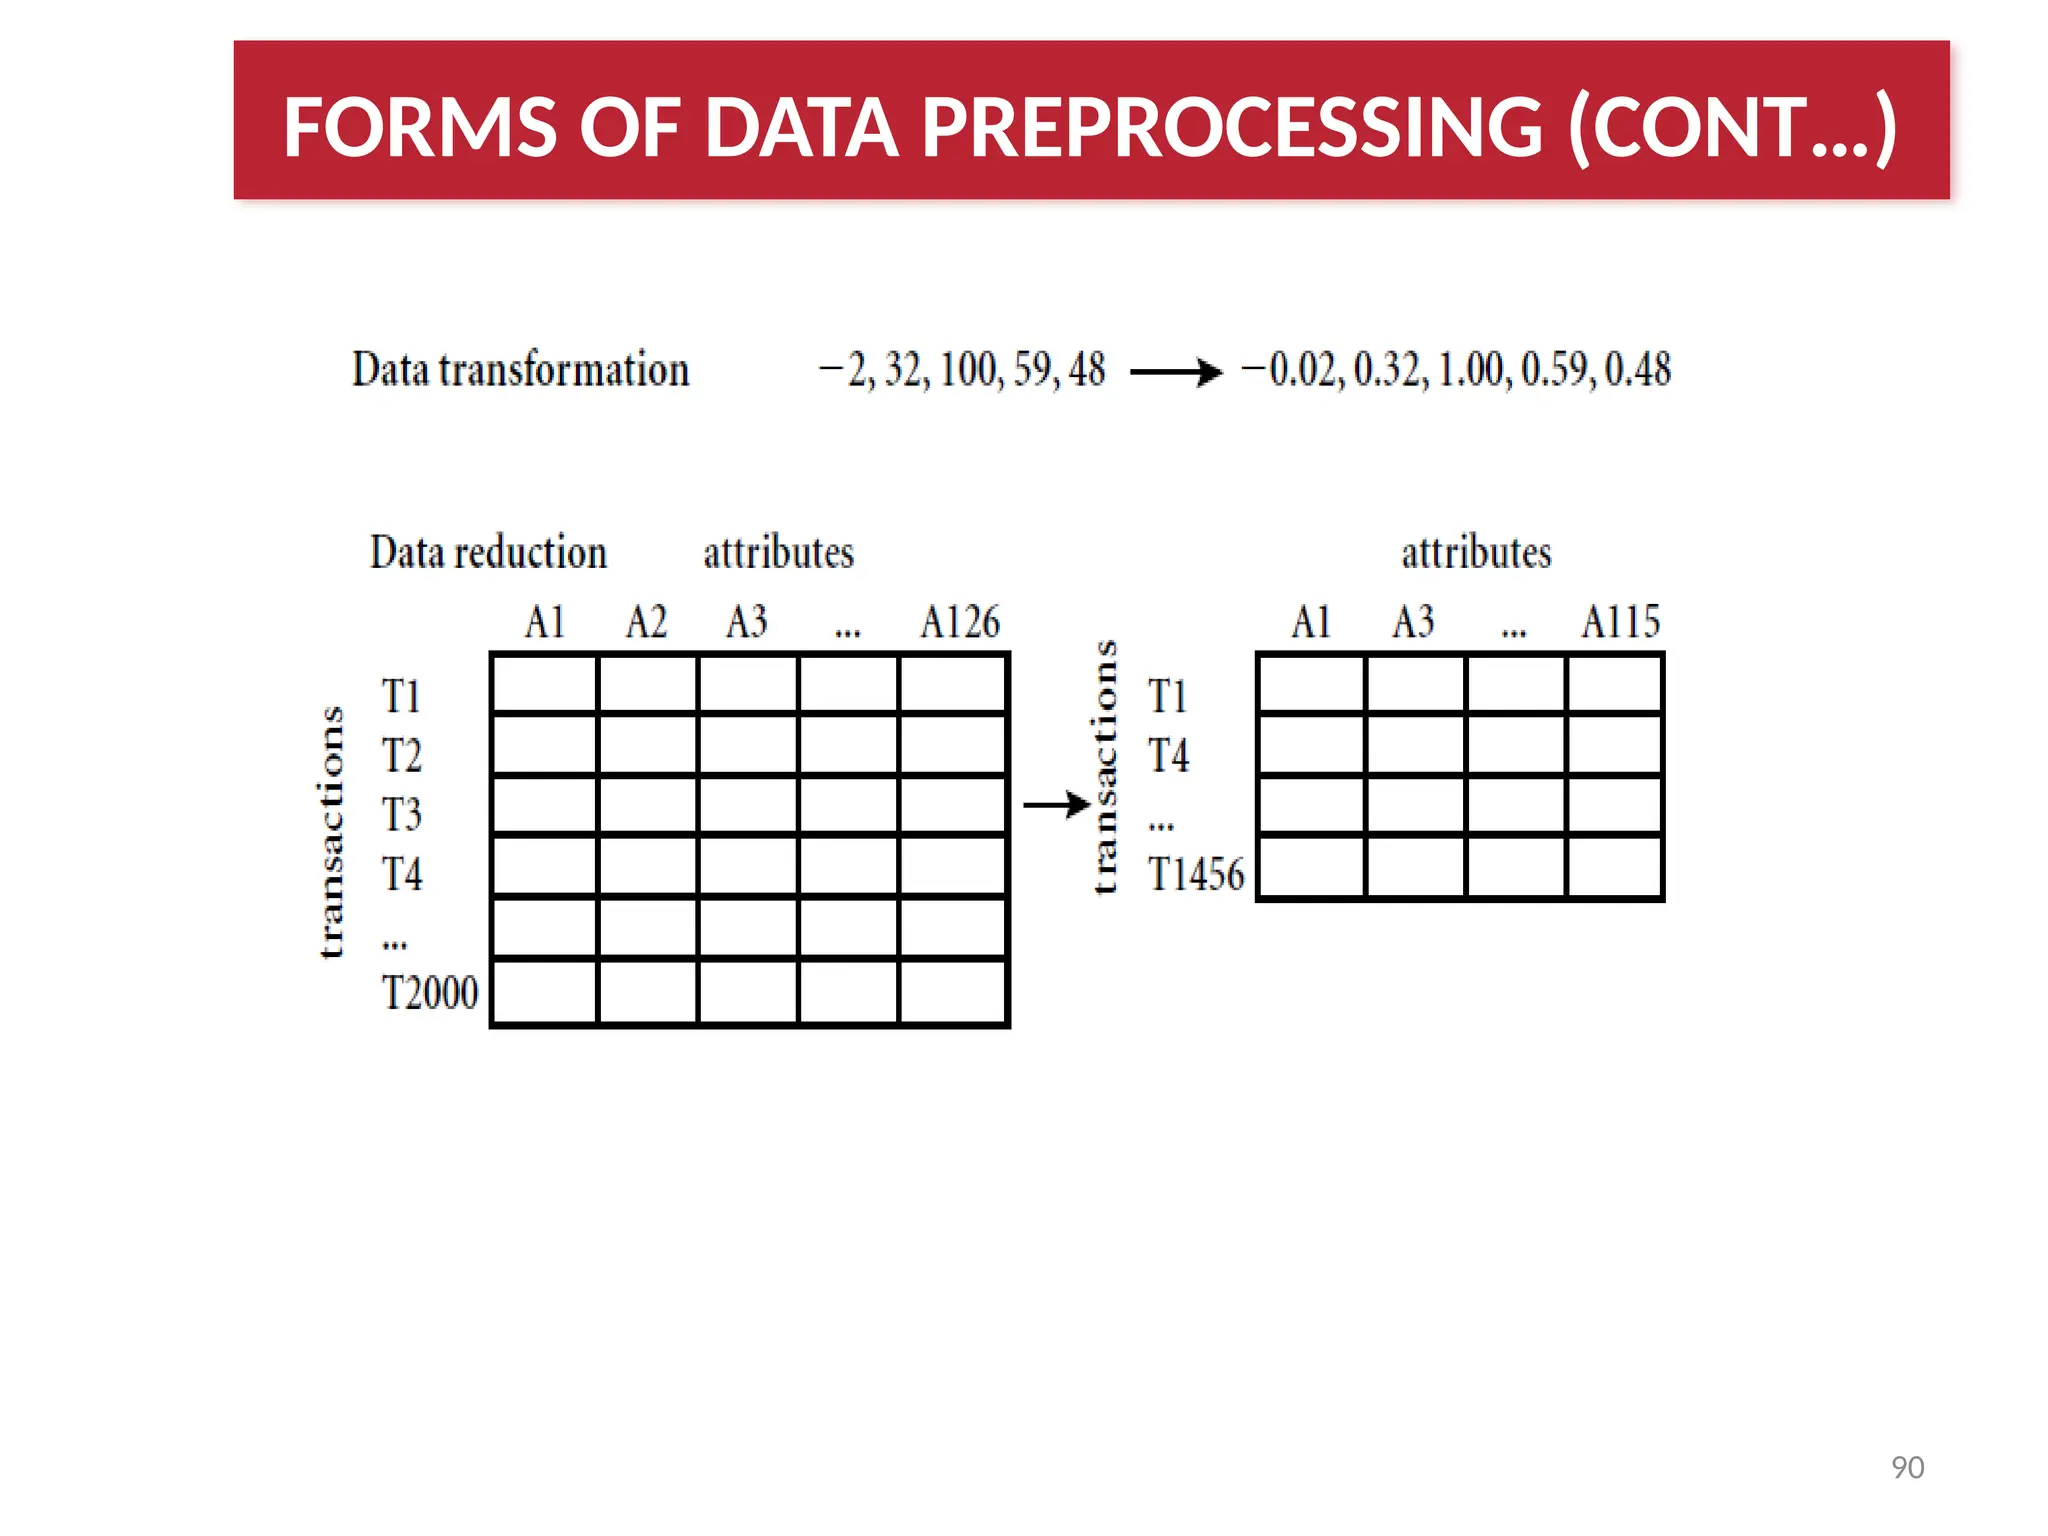
• Data reductionis the process of transforming
digital info into ordered and simplified form.
• This data is generally derived through empirical
and experimental means.
• It involves reducing large amounts of data into
smaller and meaningful fragments.
DATA REDUCTION
83.
83
• Data discretizationis an important concept
when you have a large amount of numeric
data, but only want to classify it based on
nominal values.
• In this scenario, the continuous data is split
into discrete forms and the values of these
discrete sets are said to be the nominal value.
It is basically a process of converting
continuous data attributes into a finite set of
intervals with minimal loss of information.
DTATA DISRETIZATION
85
• Data inthe real world is dirty
– Incomplete: lacking attribute values, lacking certain
attributes of interest, or containing only aggregate
data e.g., occupation=“ ”
– Noisy: containing errors or outliers e.g.,
Salary=“-10”
– Inconsistent: containing discrepancies in codes or
names e.g., Age=“42” Birthday=“03/07/2005”
DATA PREPROCESSING
86.
86
• Incomplete datacomes from
– n/a data value when collected
– different consideration between the time when the
data was collected and when it is analyzed.
– human/hardware/software problems
• Noisy data comes from the process of data
– collection
– entry
– transmission
• Inconsistent data comes from
– Different data sources
– Functional dependency violation
DIRTY DATA COMES FROM
87.
87
• No qualitydata, no quality mining results!
– Quality decisions must be based on quality data
• e.g., duplicate or missing data may cause
incorrect or even misleading statistics.
– Data warehouse needs consistent integration of
quality data
• Data extraction, cleaning, and transformation
comprises the majority of the work of building
a data warehouse. —Bill Inmon
IMPORTANCE OF DATA PREPROCESSING
88.
88
A. Data cleaning
–Fill in missing values, smooth noisy data, identify or remove
outliers, and resolve inconsistencies
B. Data integration
– Integration of multiple databases, data cubes, or files
C. Data transformation
– Normalization and aggregation
D. Data reduction
– Obtains reduced representation in volume but produces the
same or similar analytical results
E. Data discretization
– Part of data reduction but with particular importance,
especially for numerical data
MAJOR TASKS IN DATA PREPROCESSING
91
• Importance
– “Datacleaning is one of the three biggest
problems in data Processing”—Ralph Kimball
– “Data cleaning is the number one problem in data
Processing”—DCI survey
• Data cleaning tasks
– Fill in missing values
– Identify outliers and smooth out noisy data
– Correct inconsistent data
– Resolve redundancy caused by data integration
A. DATA CLEANING
92.
92
1. Data acquisitionand metadata
2. Fill in missing values
3. Unified date format
4. Converting nominal to numeric
5. Identify outliers and smooth out noisy data
6. Correct inconsistent data
DATA CLEANING TASKS
93.
93
• Data canbe in DBMS
• ODBC, JDBC protocols
• Data in a flat file
• Fixed-column format
• Delimited format: tab, comma “,”, other
• E.g. C4.5 and Weka “arff”use comma-delimited
data
• Attention: Convert field delimiters inside strings
• Verify the number of fields before and after
1.DATA CLEANING:
ACQUISITION
94.
94
• Field types:
–binary, nominal (categorical),ordinal, numeric, …
– For nominal fields: tables translating codes to full
descriptions
• Field role:
– input : inputs for modelling
– target : output
– id/auxiliary : keep, but not use for modelling
– ignore : don’t use for modelling
– weight : instance weight
– …
• Field descriptions
DATA CLEANING: METADATA
95.
95
• Convert datato a standard format (e.g. arff or
csv)
• Missing values
• Unified date format
• Binning of numeric data
• Fix errors and outliers
• Convert nominal fields whose values have
order to numeric.
DATA CLEANING: REFORMATTING
96.
96
• Data isnot always available
– E.g., many tuples have no recorded value for several
attributes, such as customer income in sales data
• Missing data may be due to
– Equipment malfunction
– Inconsistent with other recorded data and thus deleted
– Data not entered due to misunderstanding
– Certain data may not be considered important at the time of
entry
– Not register history or changes of the data
• Missing data may need to be inferred.
2.FILLING MISSING VALUES
97.
97
• Ignore thetuple: usually done when class label is missing
(assuming the tasks in classification—not effective when
the percentage of missing values per attribute varies
considerably.
• Fill in the missing value manually: tedious + infeasible?
• Use a global constant to fill in the missing value: e.g.,
“unknown”, a new class?!
• Imputation: Use the attribute mean to fill in the missing
value, or use the attribute mean for all samples belonging
to the same class to fill in the missing value: smarter
• Use the most probable value to fill in the missing value:
inference-based such as Bayesian formula or decision tree
HANDLING MISSING DATA
98.
98
• We wantto transform all dates to the same format
internally
• Some systems accept dates in many formats
– e.g. “Sep 24, 2003”, 9/24/03, 24.09.03, etc
– dates are transformed internally to a standard
value
• Frequently, just the year (YYYY) is sufficient
• For more details, we may need the month, the day,
the hour, etc
• Representing date as YYYYMM or YYYYMMDD
can be OK, but has problems
3. UNIFIED DATE FORMAT
99.
99
• To preserveintervals, we can use
– Unix system date: Number of seconds since
1970
– Number of days since Jan 1, 1960 (SAS)
• Problem:
– values are non-obvious
– don’t help intuition and knowledge
discovery
– harder to verify, easier to make an error
UNIFIED DATE FORMAT OPTIONS
100.
100
• Some toolscan deal with nominal values
internally
• Other methods (neural nets, regression,
nearest neighbor) require only numeric inputs
• To use nominal fields in such methods need
to convert them to a numeric value
– Q: Why not ignore nominal fields altogether?
– A: They may contain valuable information
• Different strategies for binary, ordered, multi-
valued nominal fields
4.CONVERSION: NOMINAL TO NUMERIC
101.
101
• Binary fields
–E.g.Gender = M, F
• Convert to Field_0_1 with 0, 1
values
–e.g. Gender = M Gender_0_1 = 0
–Gender = F Gender_0_1 = 1
CONVERSION: BINARY TO NUMERIC
102.
102
• Ordered attributes(e.g. Grade) can be converted to
numbers preserving natural order, e.g.
– A 4.0
– A- 3.7
– B+ 3.3
– B 3.0
• Q: Why is it important to preserve natural
order?
• A: To allow meaningful comparisons, e.g. Grade
> 3.5
CONVERSION: ORDERED TO
NUMERIC
103.
103
• Noise: randomerror or variance in a
measured variable
• Incorrect attribute values may due to
– Faulty data collection instruments
– Data entry problems
– Data transmission problems
– Technology limitation
– Inconsistency in naming convention
• Other data problems which requires data
cleaning
– Duplicate records
– Incomplete data
5. NOISY DATA
104.
104
• Binning method:
–first sort data and partition into (equi-depth) bins
– then one can smooth by bin means, smooth by bin median,
smooth by bin boundaries, etc.
• Clustering
– detect and remove outliers
• Combined computer and human inspection
– detect suspicious values and check by human
• Regression
– smooth by fitting the data into regression functions
6. HANDLING NOISY DATA
105.
105
• Equal-width(distance) partitioning:
•It divides the range into N intervals of equal size:
uniform grid
• if A and B are the lowest and highest values of the
attribute, the width of intervals will be: W = (B-A)/N.
• The most straightforward
• But outliers may dominate presentation
• Skewed data is not handled well.
• Equal-depth(frequency) partitioning:
• It divides the range into N intervals, each containing
approximately same number of samples
• Good data scaling
• Managing categorical attributes can be tricky.
SIMPLE DISCRETIZATION METHODS: BINNING
107
• Linear regression
involvesfinding the
“best” line to fit two
attributes (or
variables), so that
one attribute can be
used to predict the
other.
• Multiple linear
regression is an
extension of linear
regression, where
more than two
DATA SMOOTHING - REGRESSION
108.
108
• Outliers maybe
detected by
clustering, for
example, where
similar values are
organized into
groups, or
“clusters.”
• Intuitively, values
that fall outside of
the set of clusters
may be considered
DATA SMOOTHING - OUTLIER ANALYSIS
110
Healthcare
Finance
Marketing
Retail
Education
Transportation and Logistics
Telecommunications
Government and Public
Services
Environmental Science
Applications of Data Science in
various fields
111.
111
Predictive Analytics
Predict diseaseoutbreaks and patient
admission rates.
Clinical Research
Analyse patient data for drug discovery
and treatment effectiveness.
Personalized Medicine
Tailor treatments based on individual
patient data.
1. Healthcare
112.
112
Algorithmic Trading
Developtrading algorithms based on historical
market data.
Fraud Detection
Identify fraudulent transactions and activities.
Credit Scoring
Assess creditworthiness of individuals and
businesses.
2. Finance
113.
113
Customer Segmentation
Dividecustomers into groups for targeted
marketing.
Recommendation Systems
Provide personalized product or content
recommendations.
Market Basket Analysis
Understand customer purchasing patterns.
3.Marketing
114.
114
Inventory Management
Optimizestock levels to prevent overstocking or
shortages.
Demand Forecasting
Predict product demand to optimize pricing and stock
levels.
Customer Analytics
Analyse customer behaviour to enhance shopping
experience.
4.Retail
115.
115
Adaptive Learning
Customizeeducational content based on student
performance data.
Dropout Prediction
Identify students at risk of dropping out and provide
support.
Learning Analytics
Analyze student data to improve teaching methods and
curriculum.
5.Education
116.
116
Route Optimization
Findthe most efficient routes for transportation and
delivery.
Predictive Maintenance
Anticipate when vehicles or machinery will need
maintenance.
Supply Chain Analytics
Optimize the supply chain for cost efficiency.
6.Transportation and
Logistics
117.
117
Network Optimization
Improvenetwork performance based on usage patterns.
Churn Prediction
Predict and reduce customer churn by identifying at-risk
customers.
Fraud Detection
Identify and prevent fraudulent activities on the network.
7.Telecommunications
118.
118
Crime Prediction
Predict high-riskareas for crime and
allocate resources accordingly.
Social Welfare
Identify eligible recipients for social
welfare programs using income and
demographic data.
Traffic Management
8.Government and Public
Services
119.
119
Climate Modelling
Analyzeclimate data to predict and understand
climate patterns.
Natural Disaster Prediction
Predict natural disasters based on environmental data.
Resource Conservation
Optimize resource usage and conservation strategies.
9.Environmental Science
120.
120
Performance Analysis
Analyzeplayer performance and strategize game
plans.
Injury Prevention
Predict and prevent injuries by analyzing player
health data.
Fan Engagement
Analyze fan data to enhance the fan experience.
10.Sports Analytics
121.
121
Recruitment
Analyze resumesand job descriptions for optimal
candidate matching.
Employee Retention
Identify factors contributing to employee turnover and
implement retention strategies.
Workforce Planning
Predict future workforce needs based on historical
data.
11. Human Resources
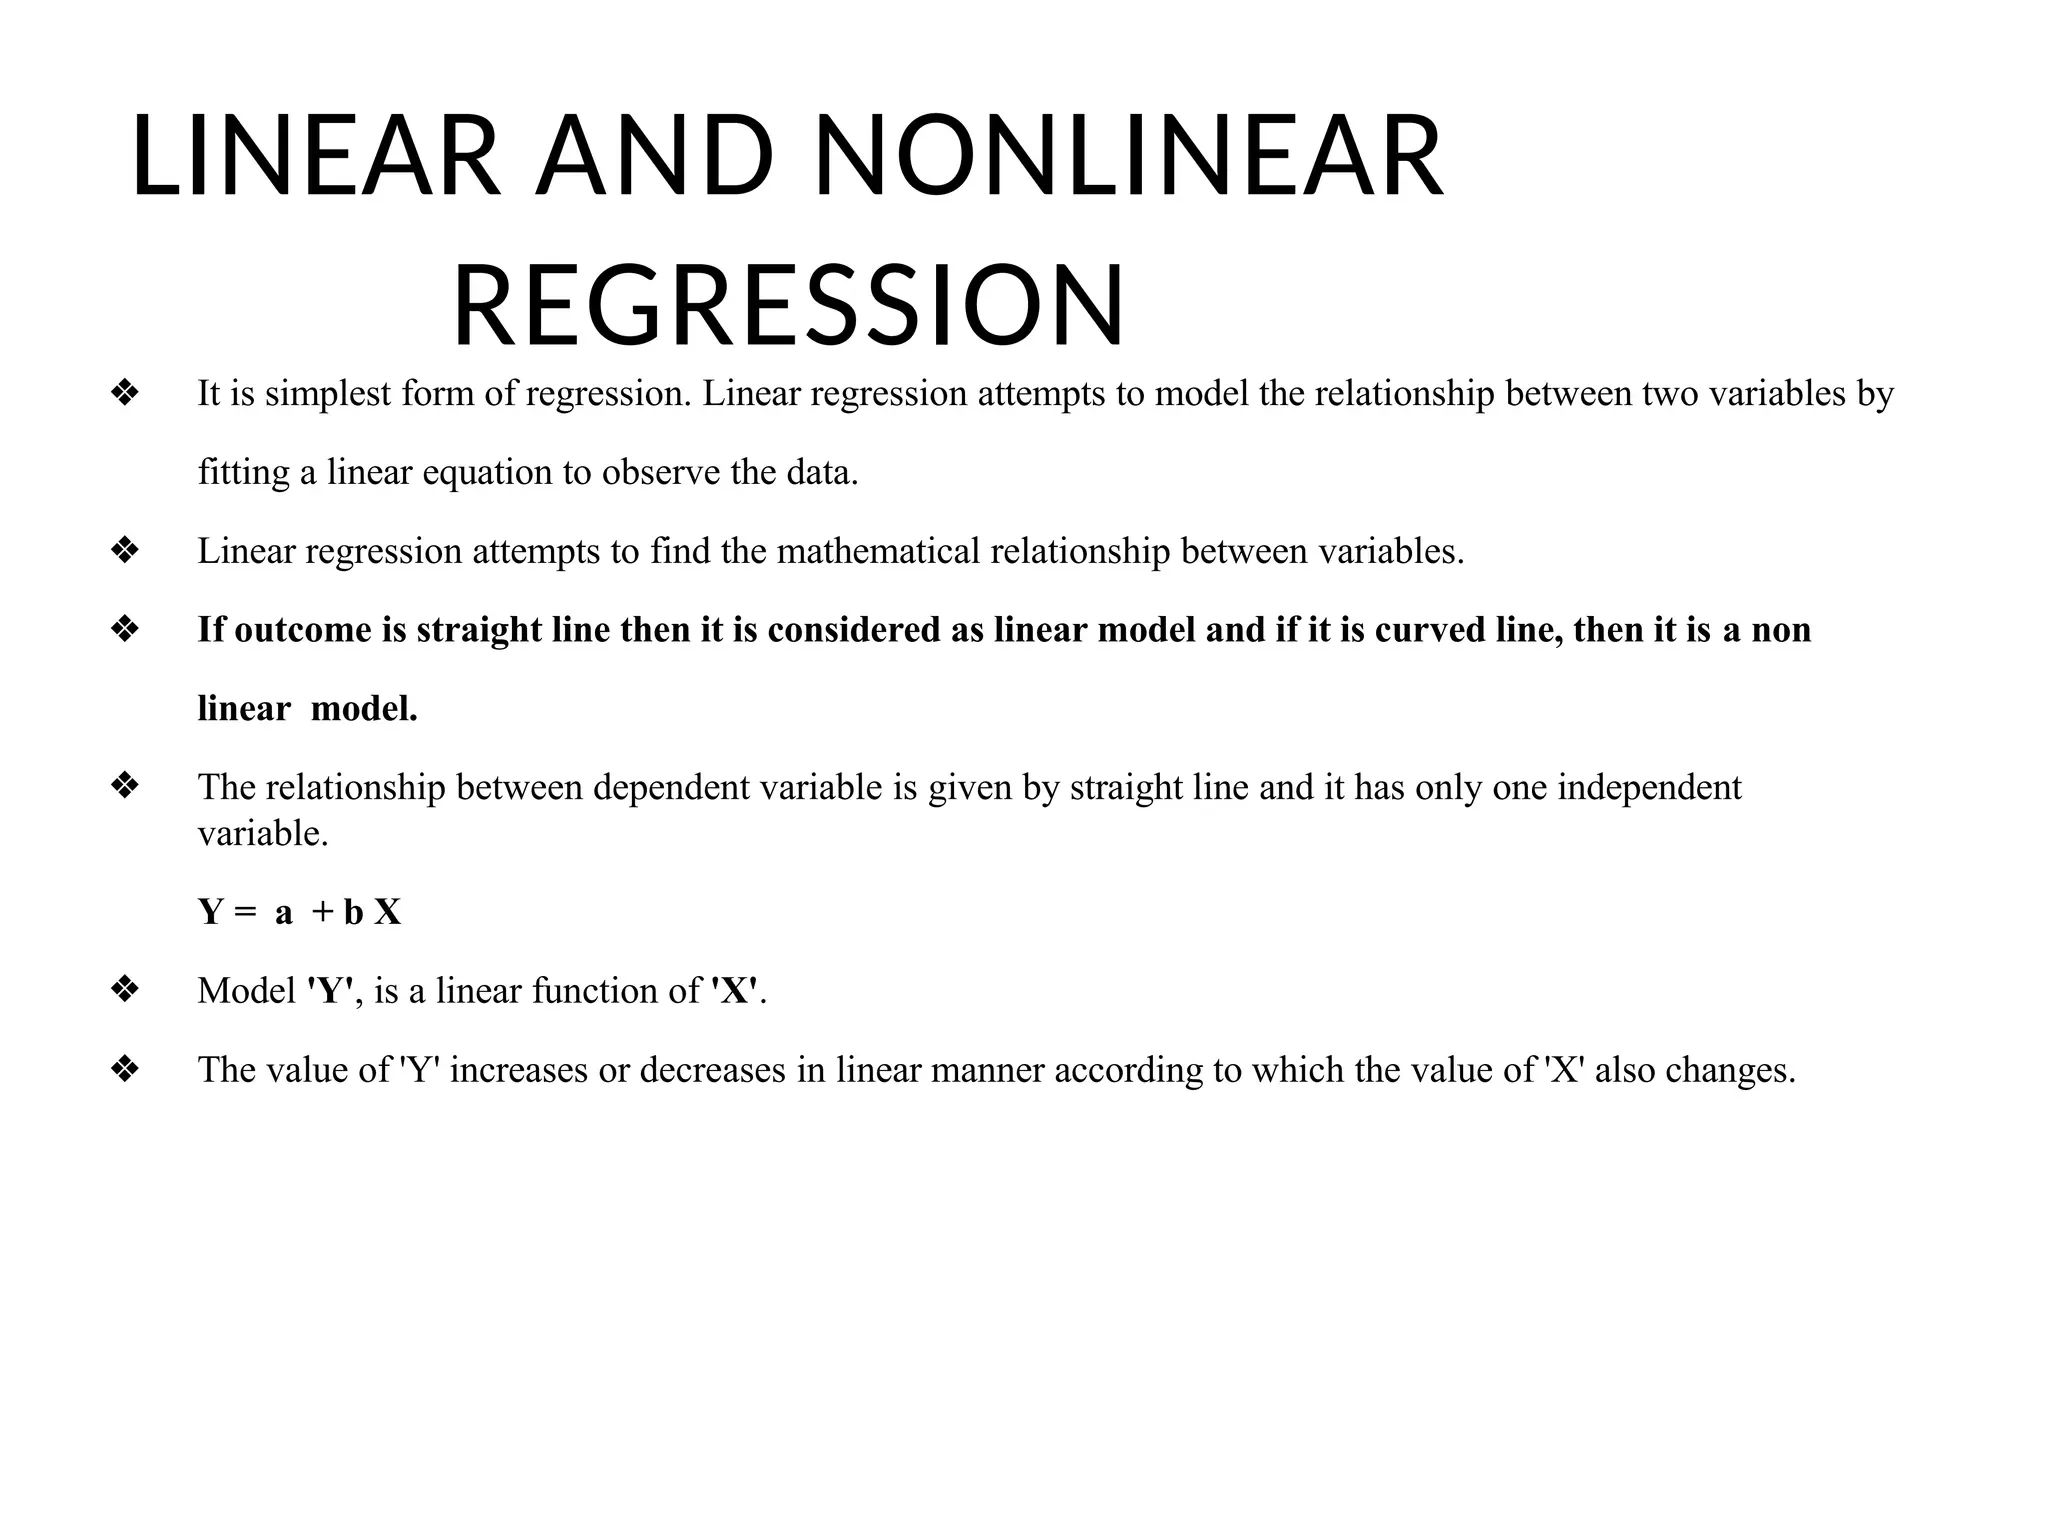
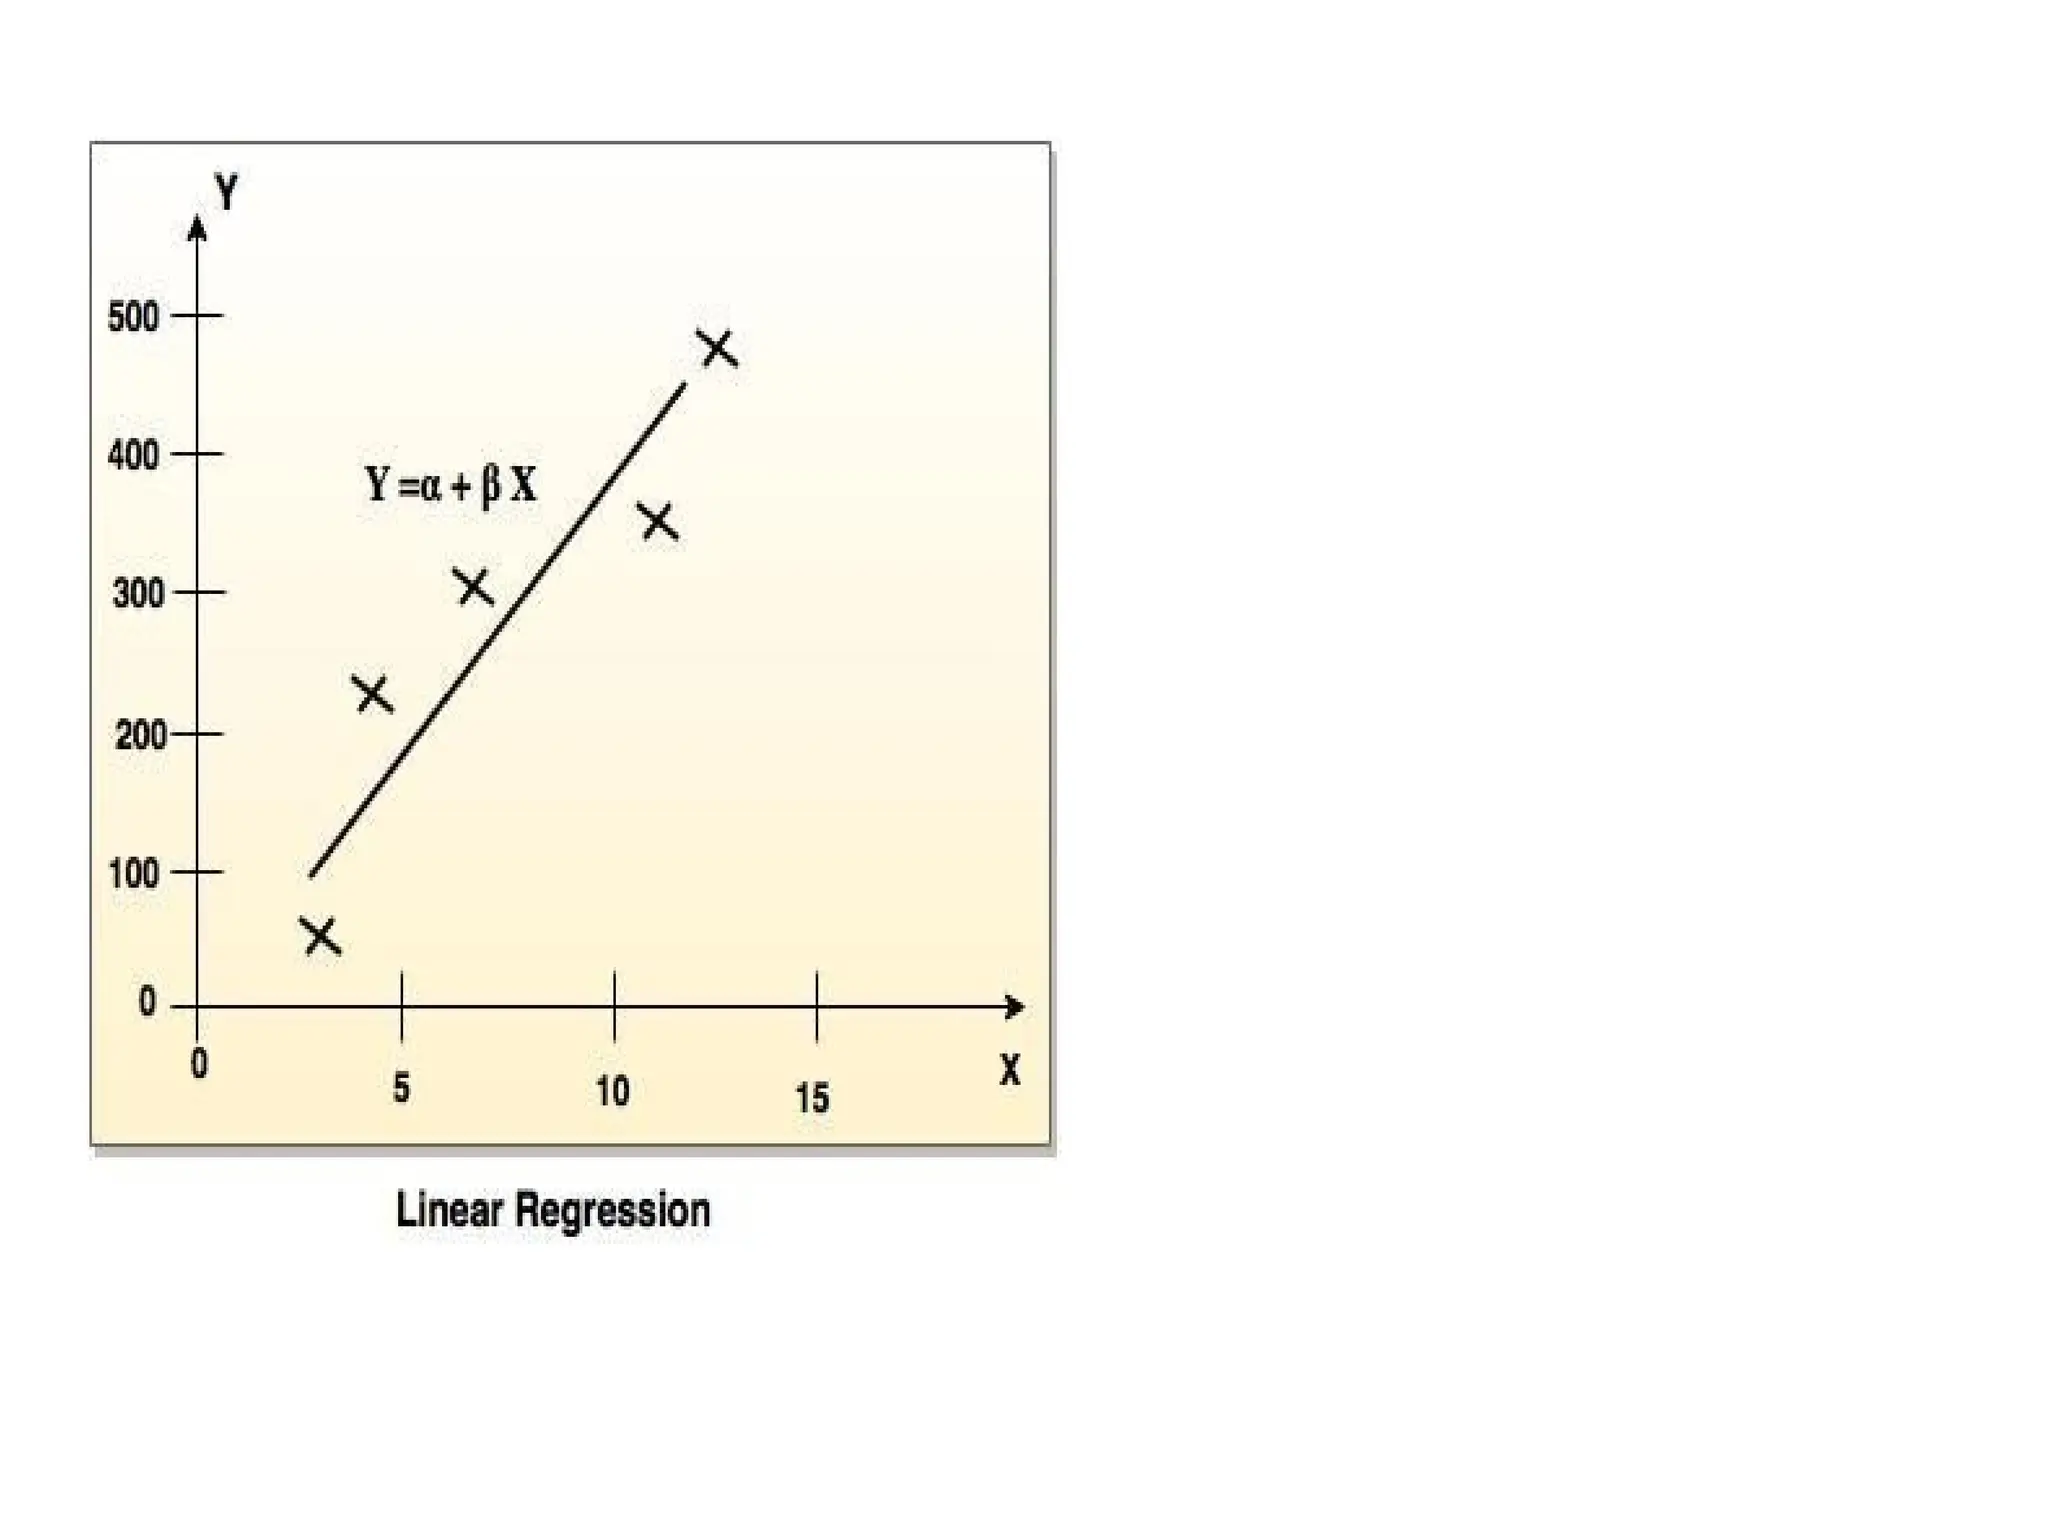
LINEAR AND NONLINEAR
REGRESSION
❖It is simplest form of regression. Linear regression attempts to model the relationship between two variables by
fitting a linear equation to observe the data.
❖ Linear regression attempts to find the mathematical relationship between variables.
❖ If outcome is straight line then it is considered as linear model and if it is curved line, then it is a non
linear model.
❖ The relationship between dependent variable is given by straight line and it has only one independent
variable.
Y = a + b X
❖ Model 'Y', is a linear function of 'X'.
❖ The value of 'Y' increases or decreases in linear manner according to which the value of 'X' also changes.
132.
MULTIPLE LINEAR
REGRESSION
❖ Multiplelinear regression is an extension of linear regression analysis.
❖ It uses two or more independent variables to predict an outcome and a single continuous
dependent variable.
Y = a0
+ a1
X1
+ a2
X2
+.........+ak
Xk
+e
where,
'Y' is the response variable.
X1
+ X2
+ Xk
are the independent predictors.
'e' is random error.
a0
, a1
, a2
, ak
are the regression coefficients.
133.
LOGISTIC
REGRESSION
❖ Logistic Regressionwas used in the biological sciences in early twentieth century. It was then
used in many social science applications. Logistic Regression is used when the dependent
variable(target) is categorical.
❖ For example,
➢ To predict whether an email is spam (1) or (0)
➢ Whether the tumor is malignant (1) or not (0)