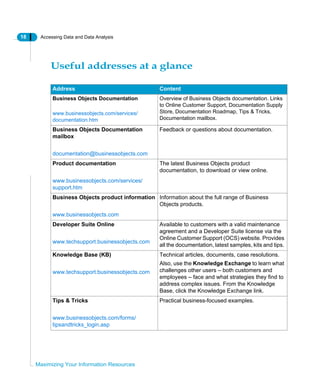
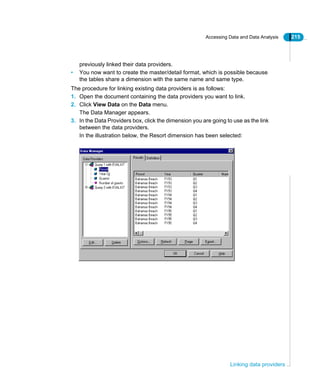
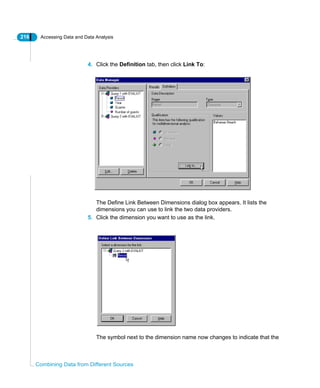
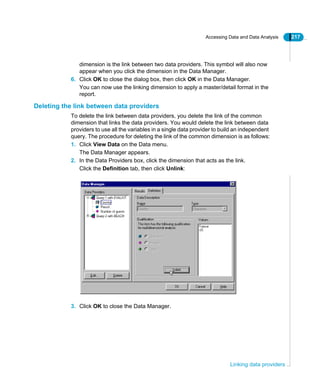
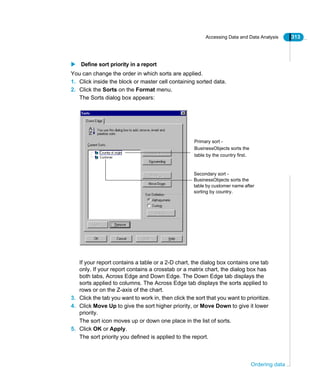
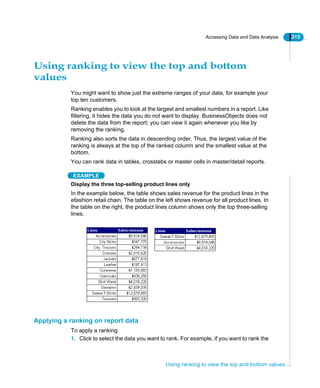
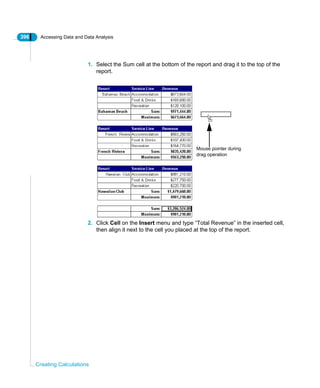
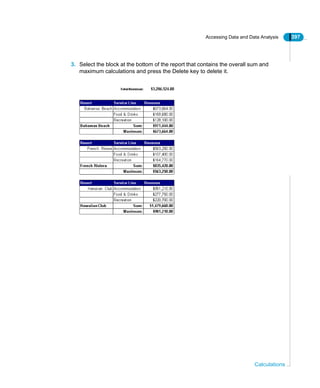
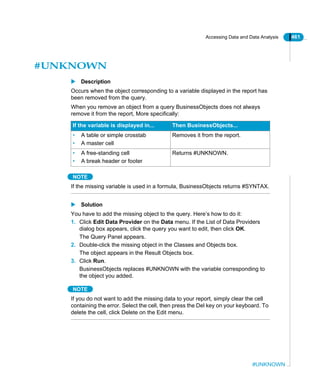
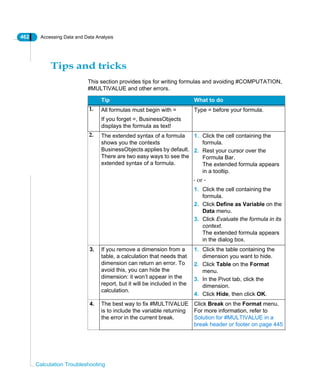
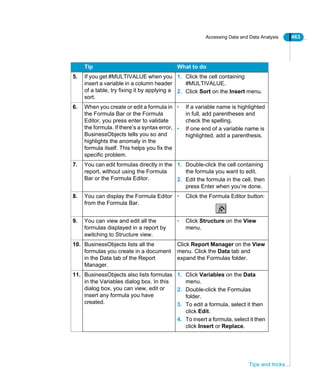
This document provides an overview and user guide for BusinessObjects 6.1 for accessing data and performing data analysis. It covers topics such as building queries on universes and other data sources, combining data from different sources, filtering and customizing report data, analyzing data in drill mode and slice-and-dice mode, and creating calculations. The document is intended to help users maximize their use of BusinessObjects for querying, reporting on, and gaining insights from their data.


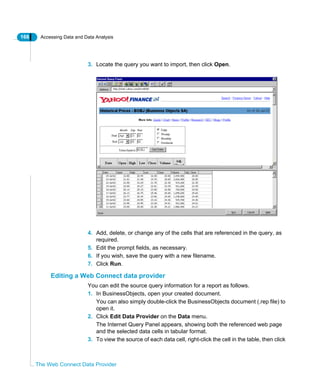
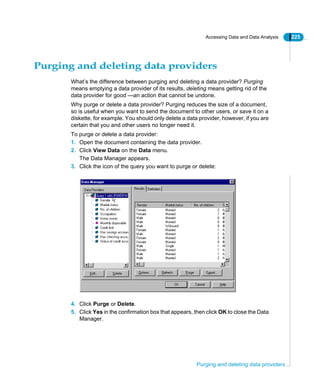
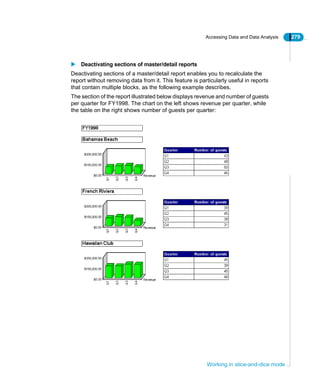
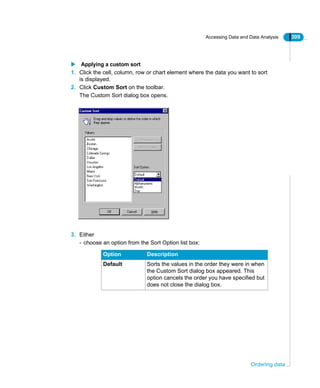
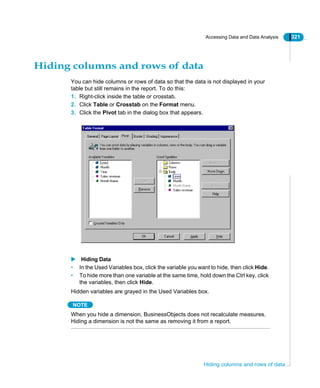
![Accessing Data and Data Analysis 171
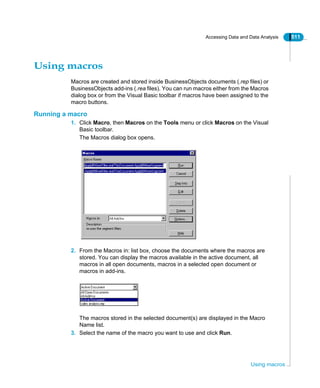
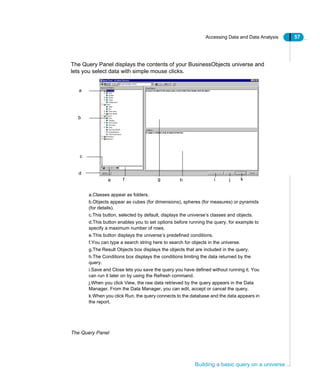
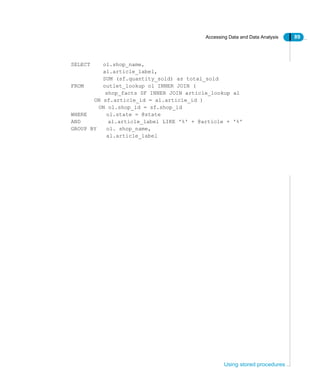
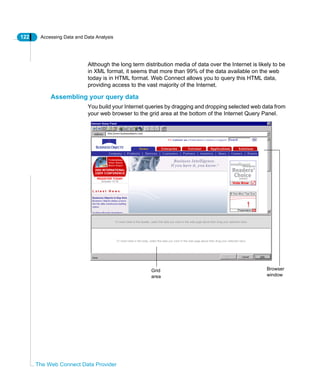
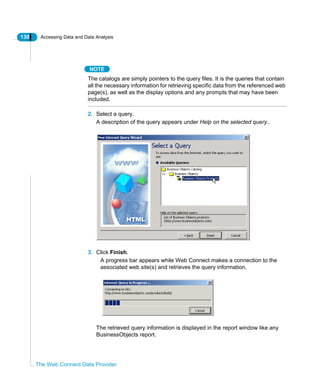
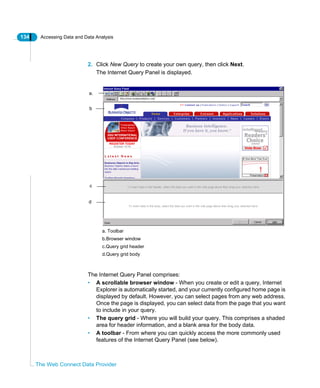
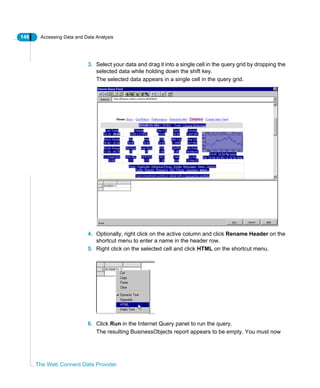
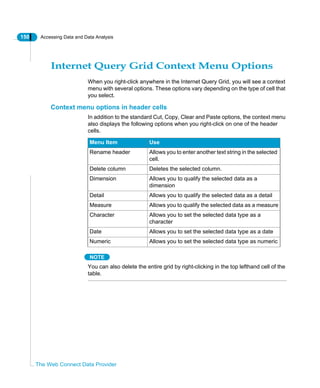
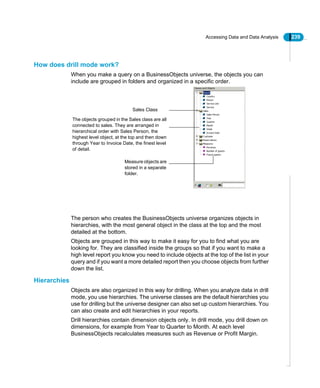
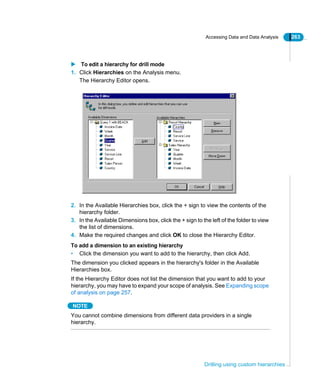
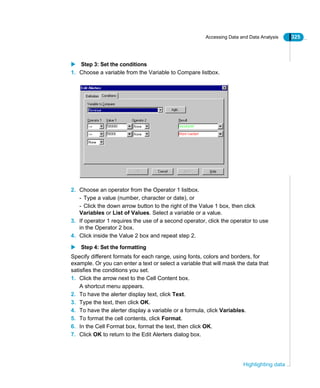
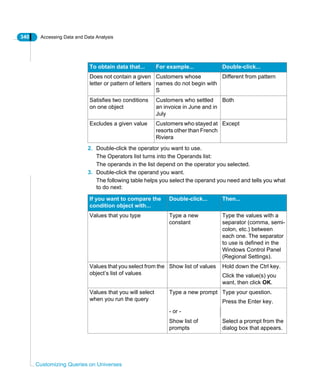
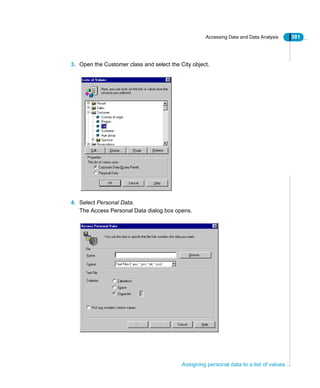
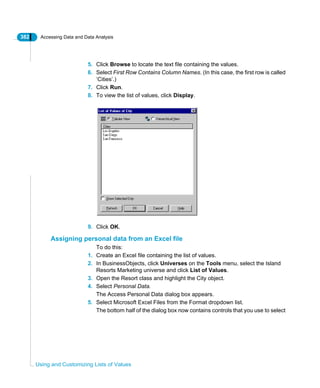
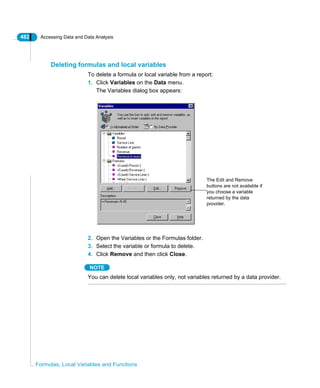
Managing Queries
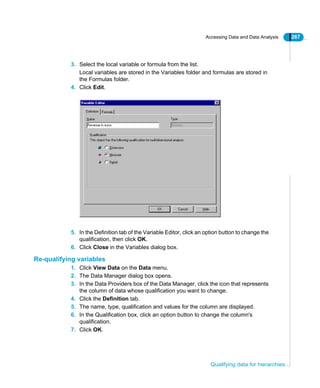
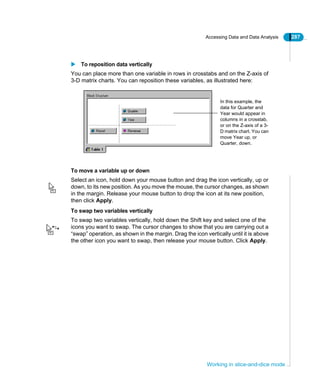
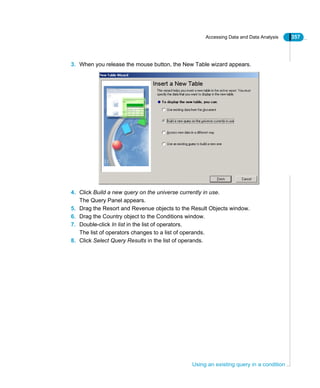
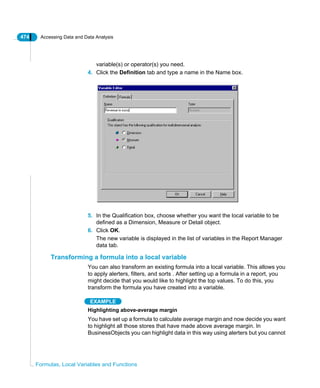
Autoqualifying cells
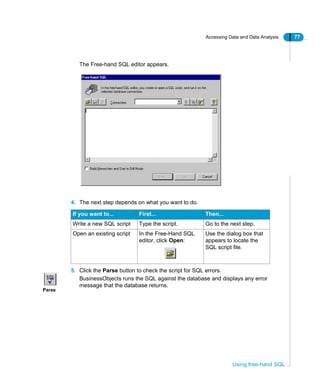
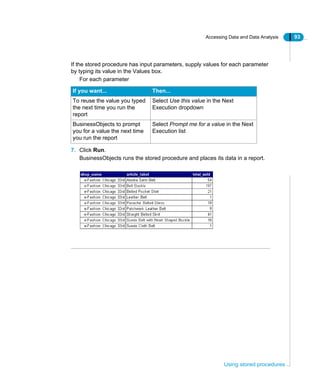
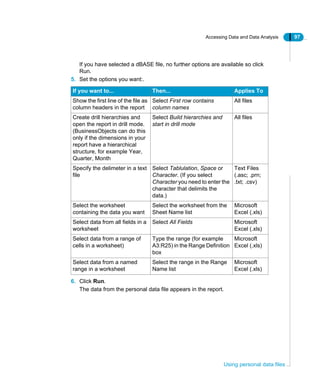
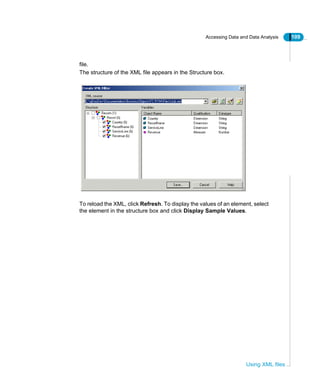
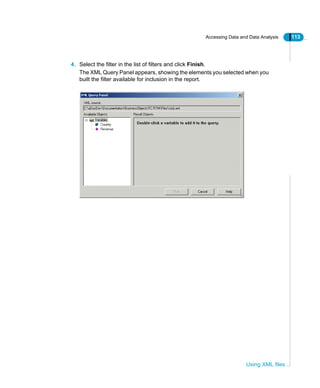
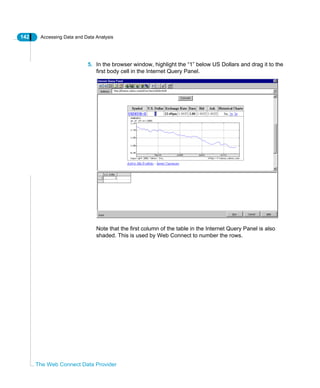
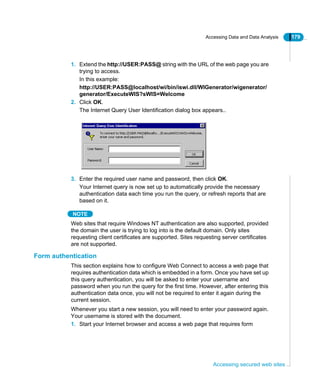
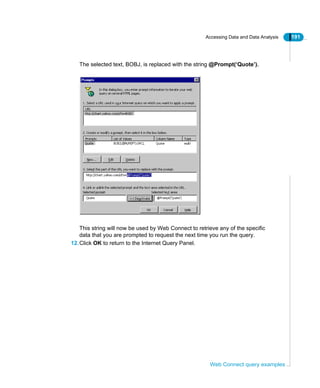
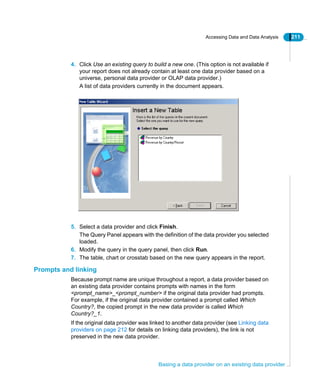
When you create and run your Internet queries, the data is automatically qualified
by Web Connect. This qualification is actually performed when you click Run.
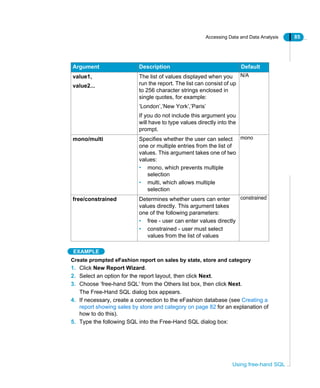
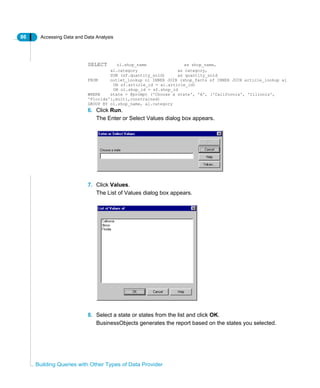
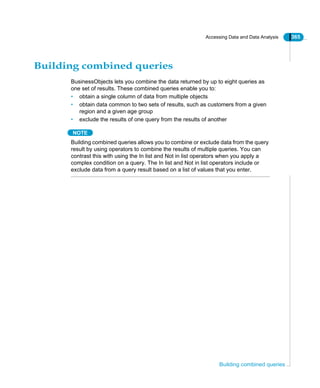
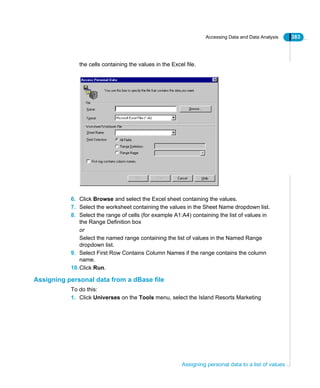
However, as you have seen in Internet Query Grid Context Menu Options on
page 150, you can manually qualify any of the data cells in the Query grid. If you
do this, then whenever you run the query, Web Connect will always use your
manual data qualifications.
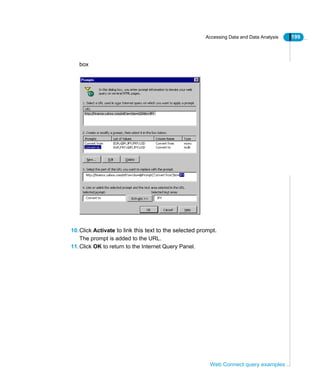
To override any manual qualifications you may have made, you must autoqualify
the data in the Query grid. This resets all manual qualifications, forcing
autoqualification on previously qualified columns.
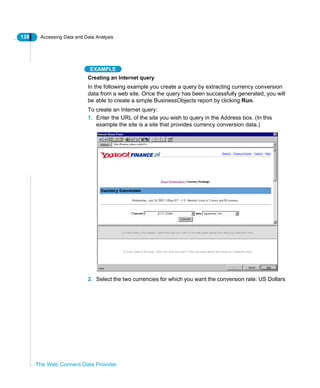
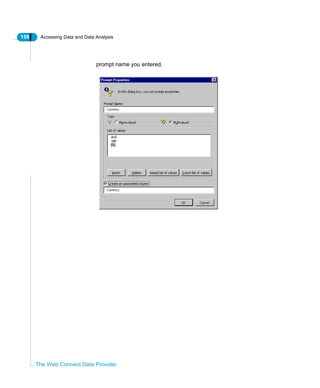
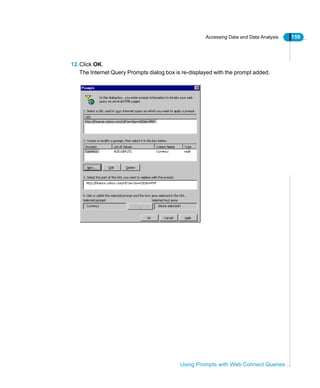
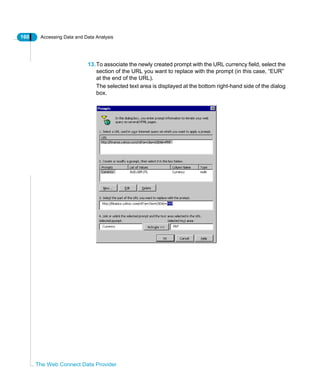
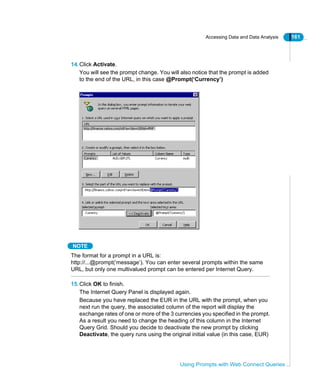
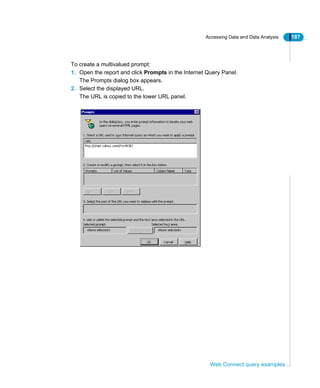
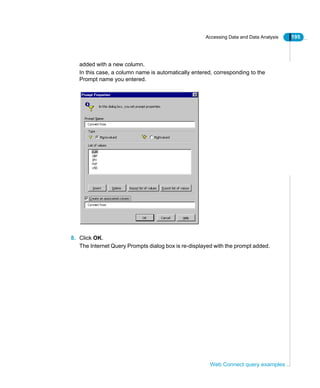
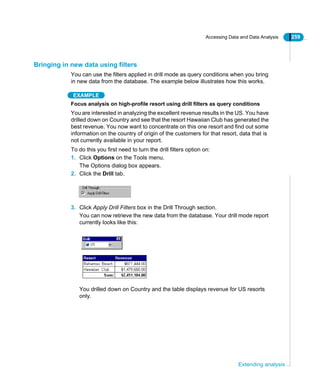
1. Open or create your Internet query.
2. Click Autoqualify on the Internet Query Panel
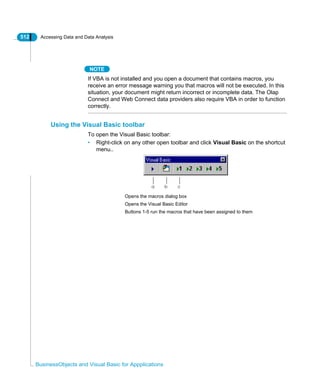
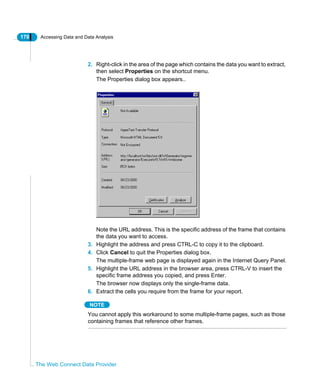
Parsing cells involves retrieving their content and checking it for possible
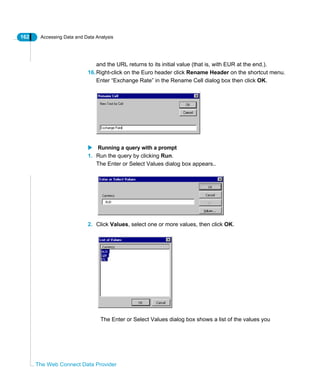
conversion to numeric data.. A numeric cell can only contain numbers and two
additional character types ([ ], ['] [.] and [,] for thousands separator and [.] or
[,] for decimal separator. [+] and [-] are also accepted in front of the number).
For example, the following strings can be converted to numeric:
• 1 000 432
• 1.234.345,23
• 1.43
• 1'324.23
NOTE
A column can only be autoqualified to a Dimension/Character or Measure/
Numeric.
When there is an ambiguity (1.123 can be either 1123 or 1[decimal
separator]123) the decimal separator entered in the Options dialog is used. If
one cell fails to be converted to Measure/Numeric, the whole column is
converted to Dimension/Character.
NOTE
The autoqualify button forces autoqualification for all columns, whether
previously qualified or not.](https://image.slidesharecdn.com/businessobjectsaccessanalysis-130422050630-phpapp01/85/Businessobjects-access-analysis-171-320.jpg)
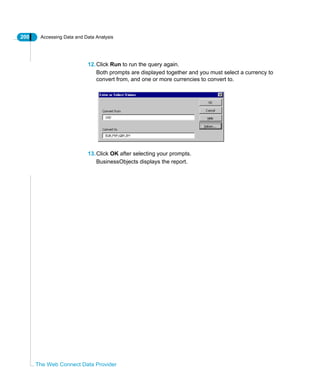


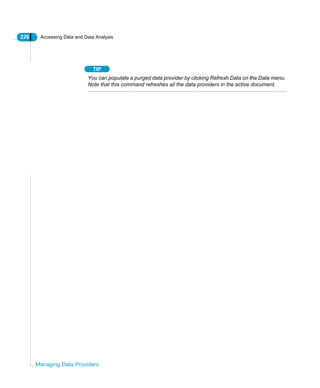


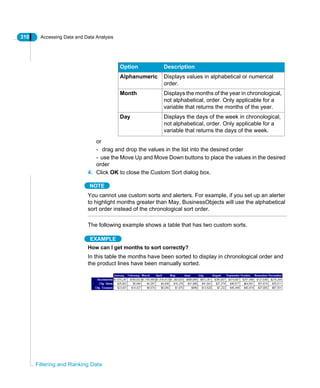
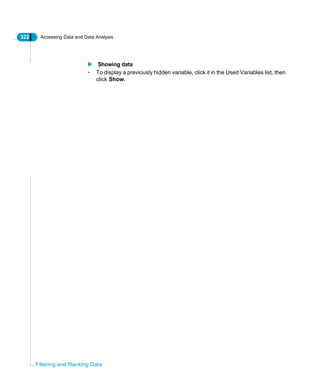
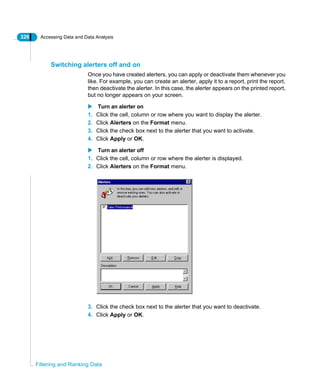

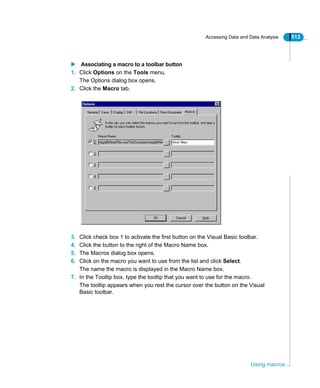
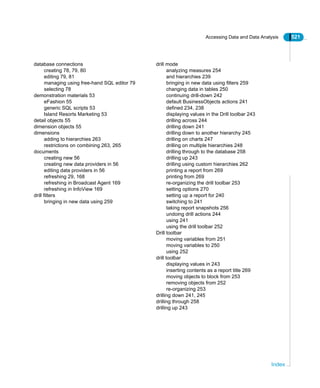
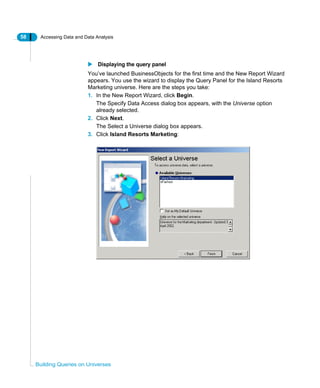
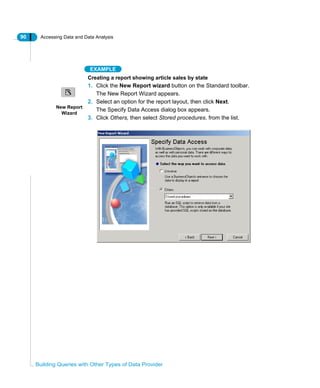
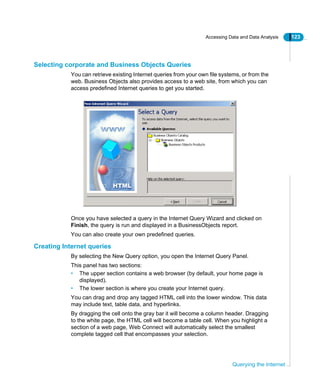
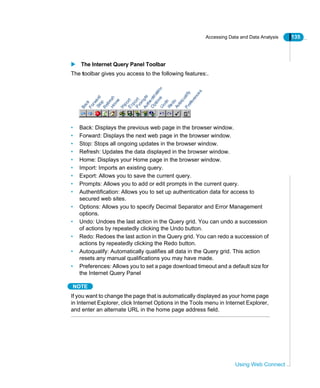
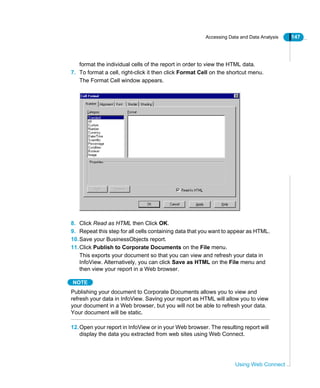
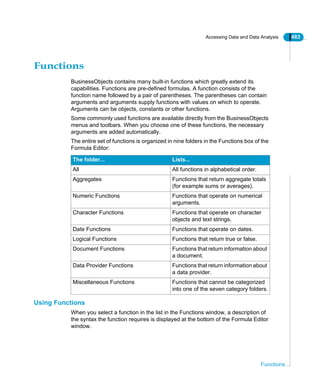
![334 Accessing Data and Data Analysis
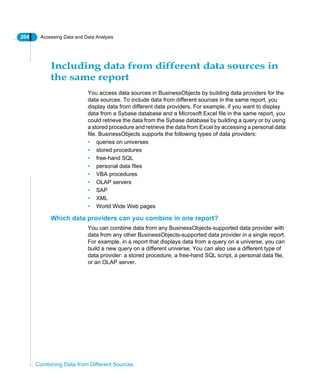
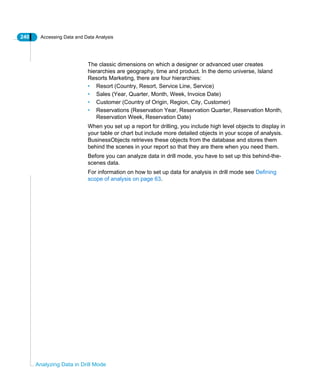
Customizing Queries on Universes
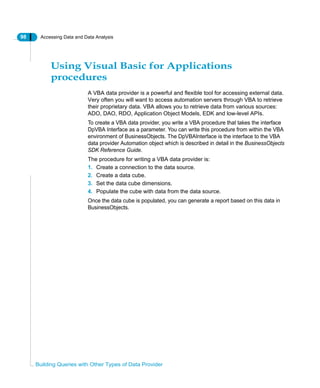
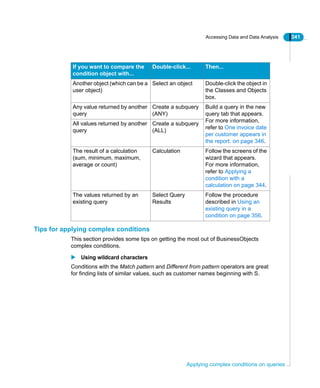
next time you build or edit a query on the universe, the user object you have
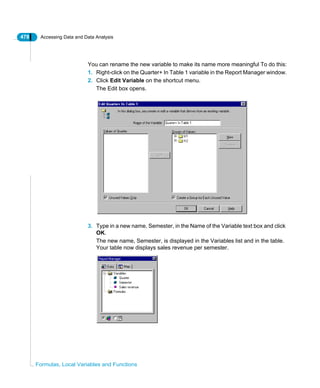
created will appear in the User Objects class.
REMINDER
You can create a user object by clicking User Objects on the Query Panel
toolbar. Using this method you can create user objects only in the universe you
selected for the query you are working on. The workflow is the same as the one
described in this section.
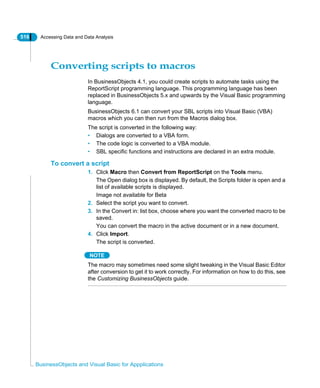
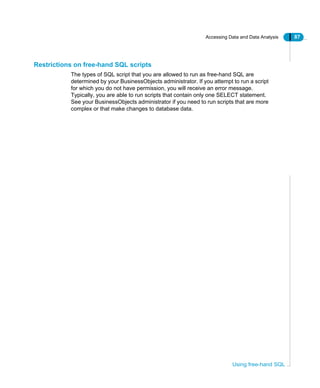
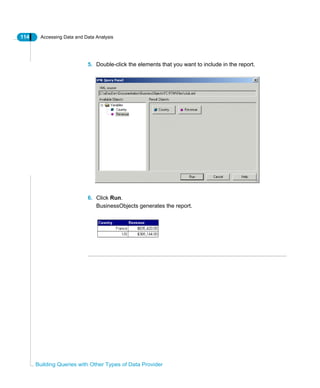
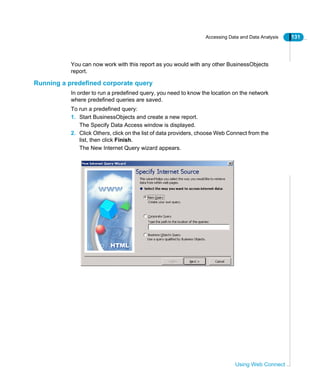
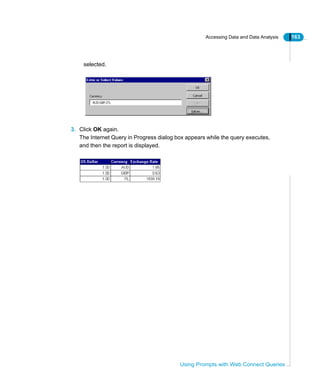
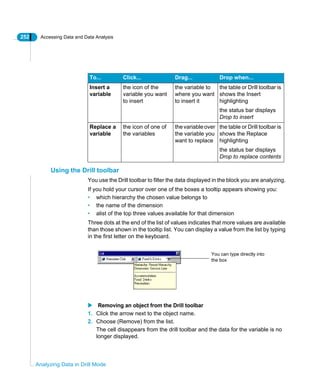
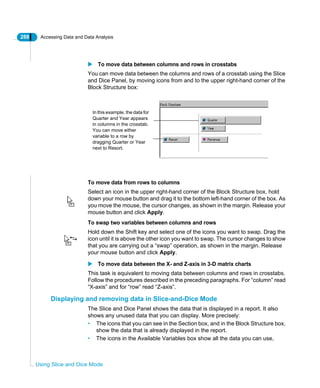
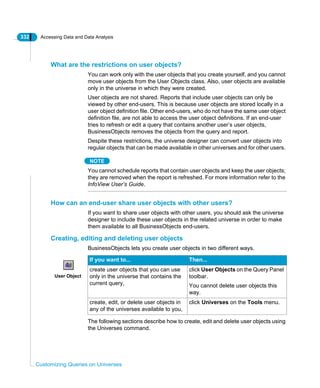
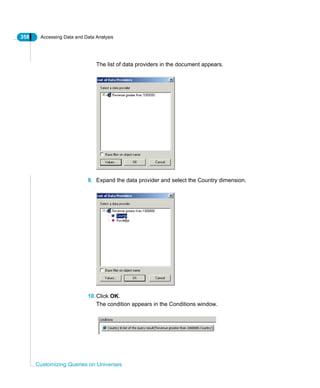
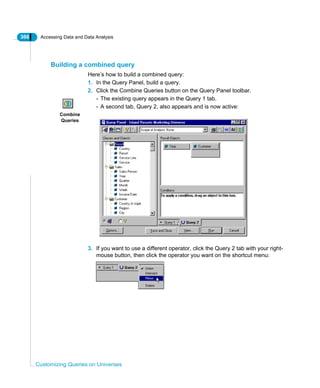
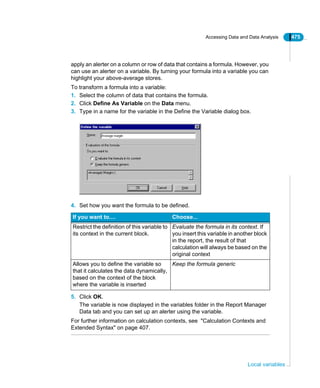
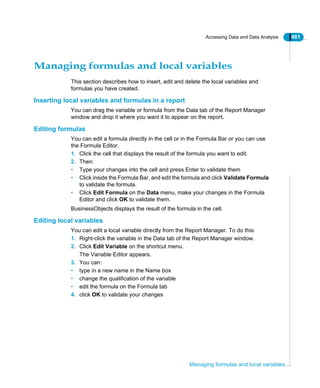
To write the formula of a user object
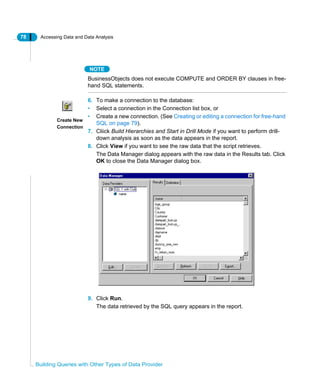
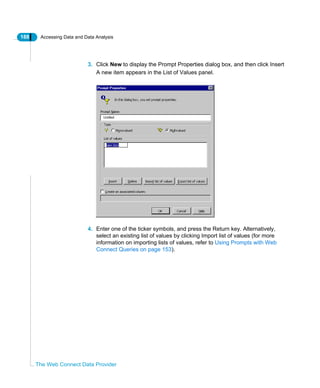
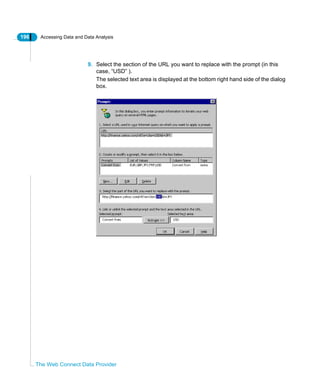
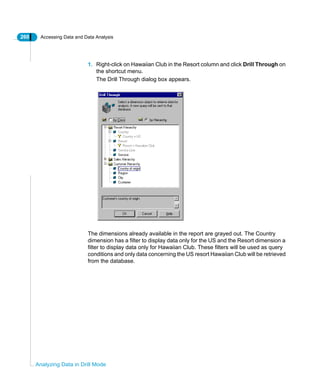
1. Display the User Object dialog box by following steps 1 to 3 under To create
a user object in any universe available to you on page 333.
2. Click the Formula tab, then check Get Assistance on Functions:
3. Double-click the objects, functions and operators you want to use in the user
object formula.
- When you double-click an object or an operator, it appears in the Formula
box. The functions and operators you can select depend on the database at
your site.
- When you double-click a function, the Function[FunctionName] dialog box
User Object](https://image.slidesharecdn.com/businessobjectsaccessanalysis-130422050630-phpapp01/85/Businessobjects-access-analysis-334-320.jpg)
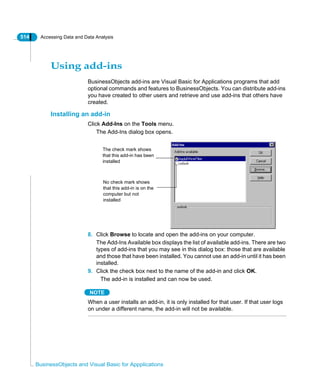
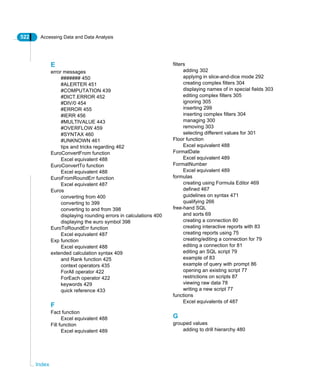
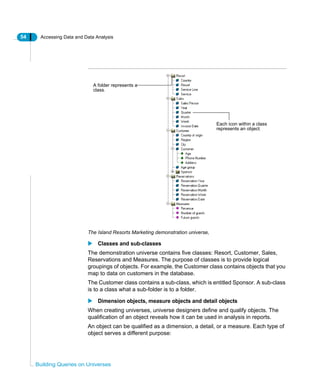
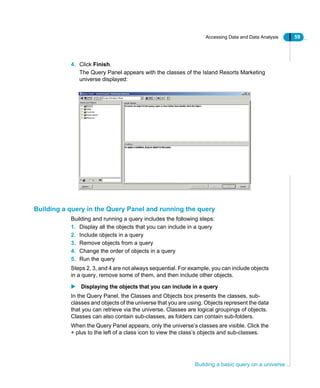
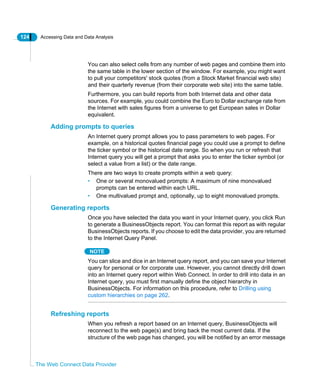
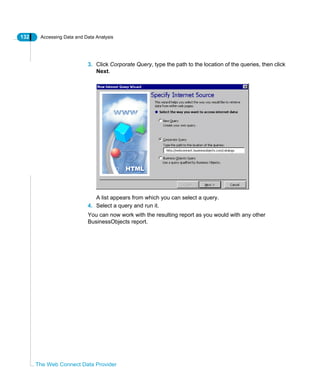
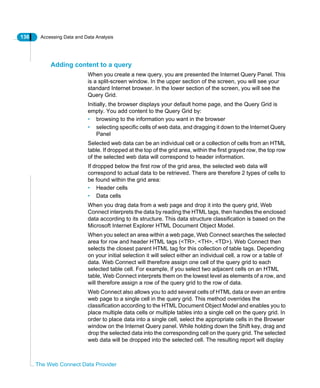
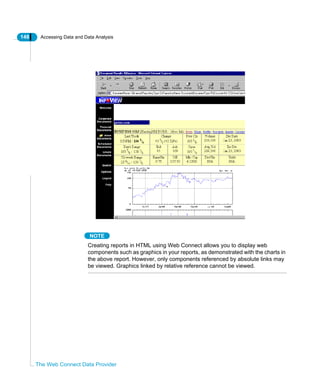
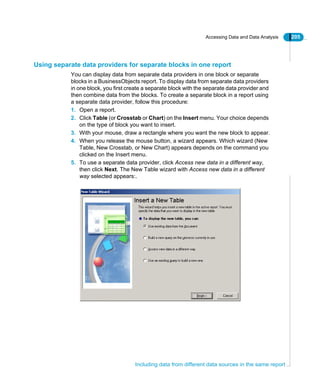
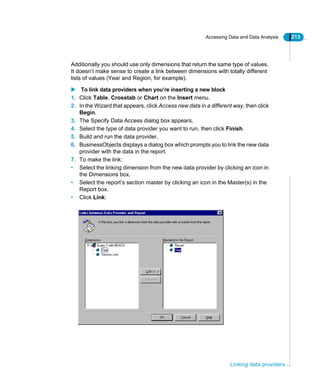
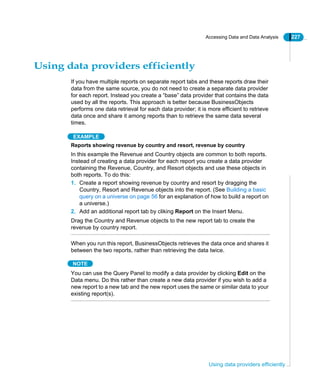
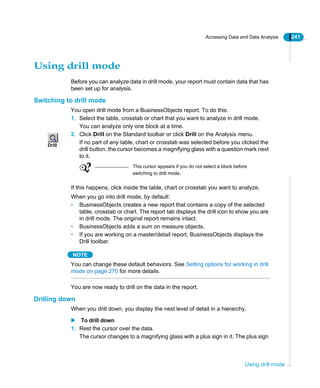
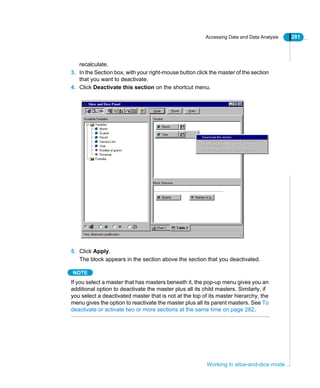
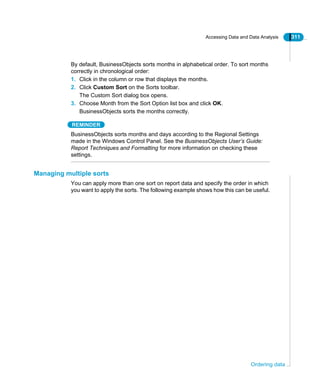
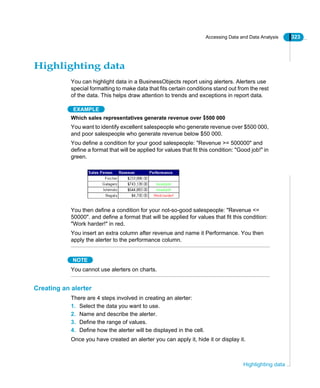
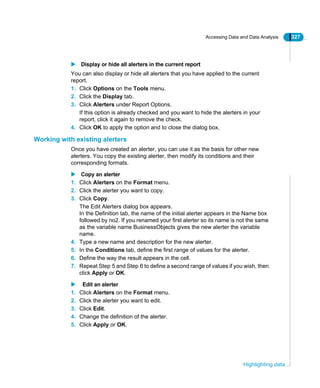
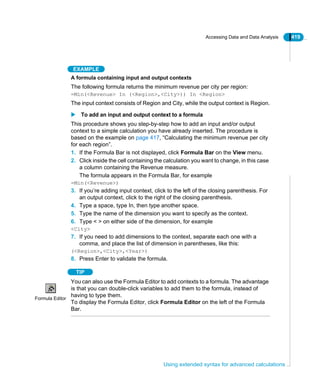
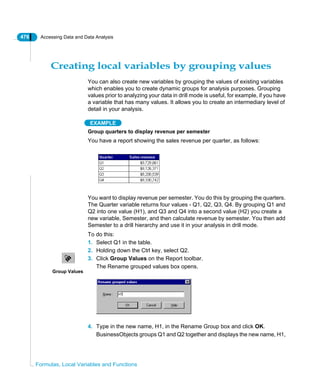
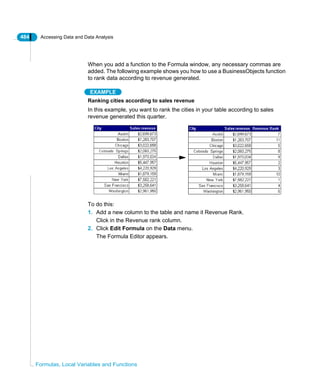
![Accessing Data and Data Analysis 335
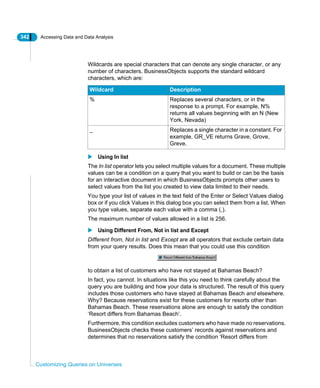
Creating user objects
appears.
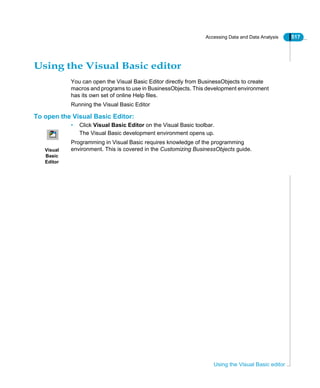
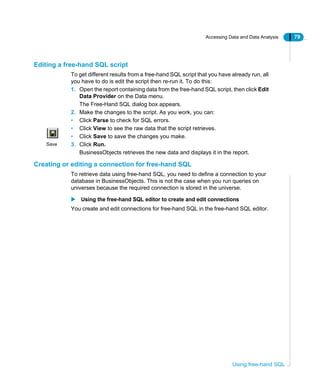
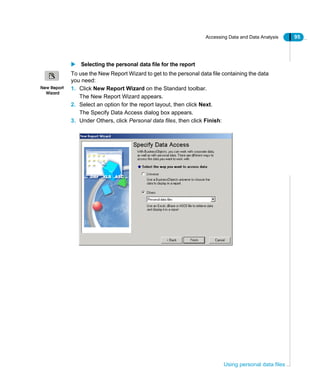
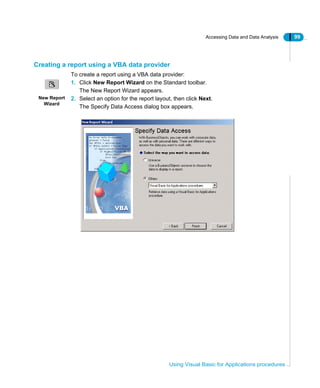
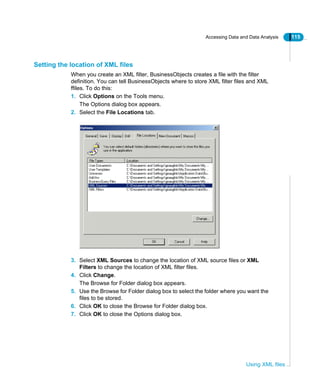
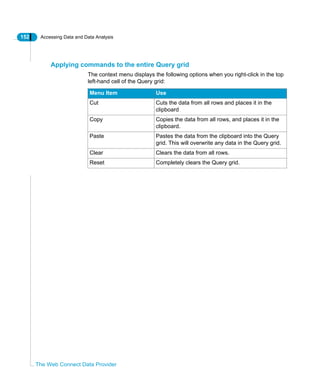
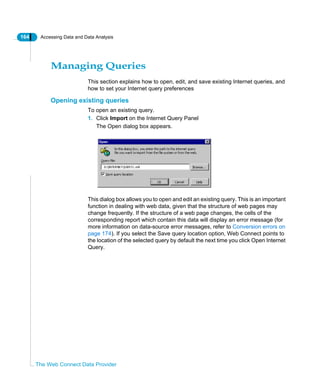
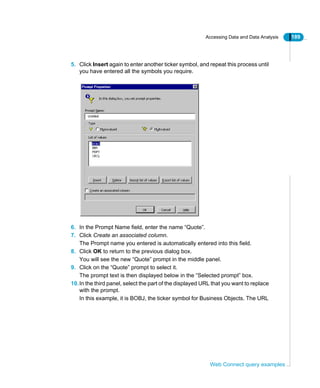
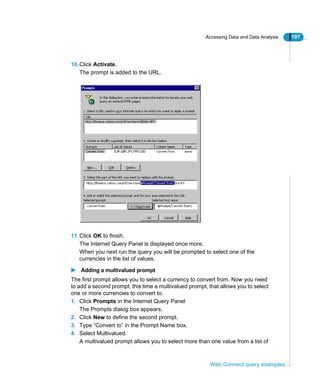
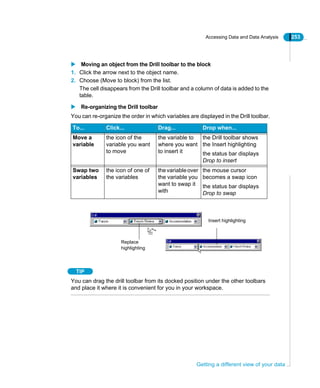
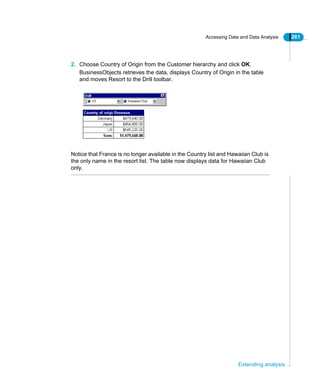
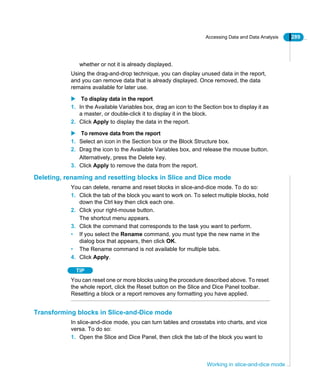
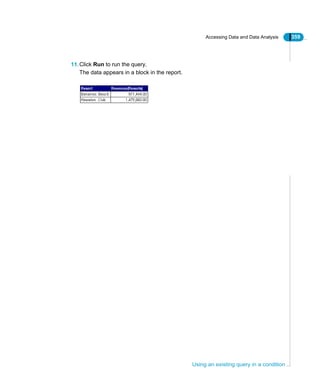
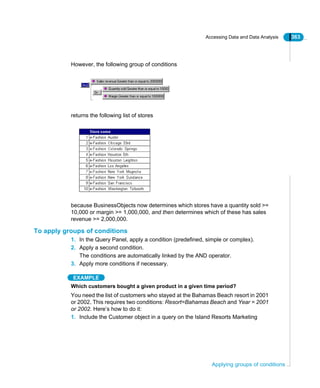
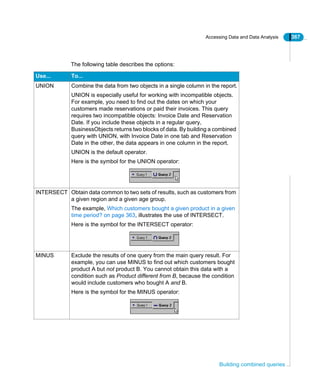
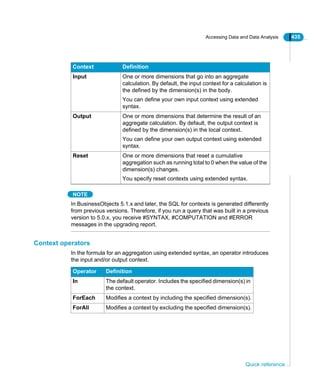
4. In the Function[FunctionName] dialog box, type an argument in each field.
- If the function's arguments include objects, user objects, functions or
operators, you can double-click them to insert them in the function formula.
- The arguments appear in the Formula box.
5. If necessary, type text, numbers or dates in the formula.
You must type quotes (") before and after text and numbers, but type a single
quote (') before and after dates.
6. Click OK, then click Test to check the syntax of the formula.
To edit a user object
Editing a user object enables you to change the object’s name, type, and
definition (formula). To edit a user object:
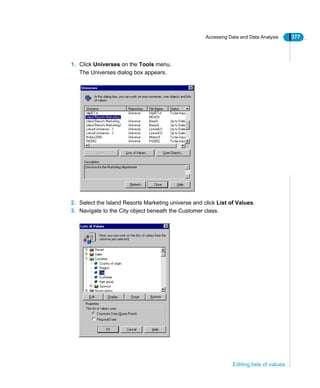
1. Click Universes on the Tools menu.
The Universes dialog box appears.
2. Select the universe that contains the user object that you want to edit, then
Type function
arguments here](https://image.slidesharecdn.com/businessobjectsaccessanalysis-130422050630-phpapp01/85/Businessobjects-access-analysis-335-320.jpg)


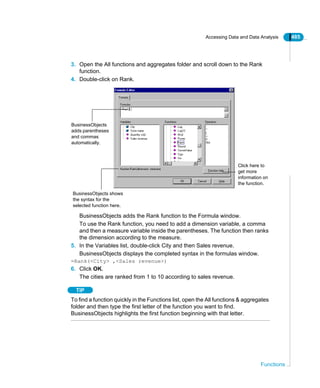


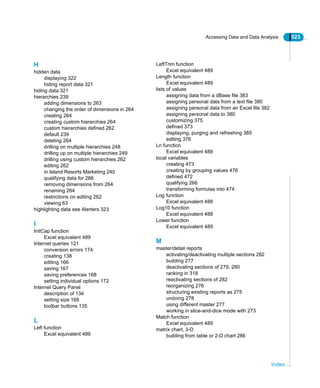
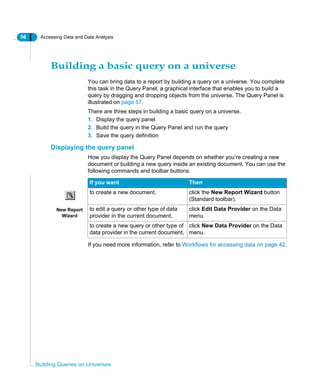
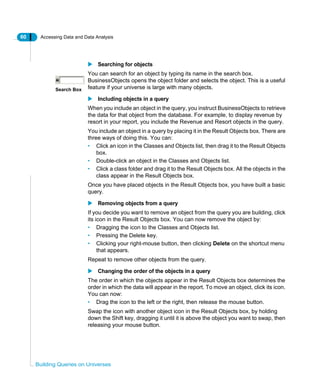
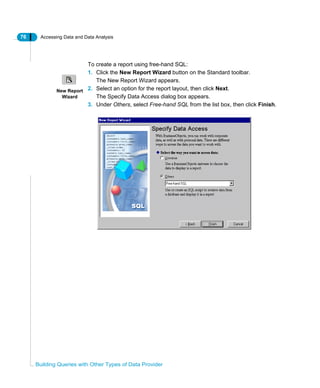
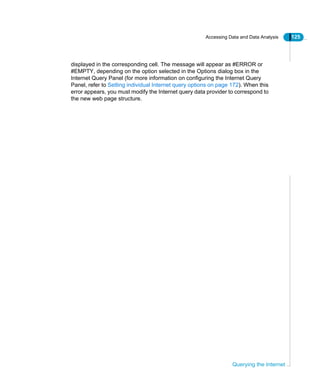
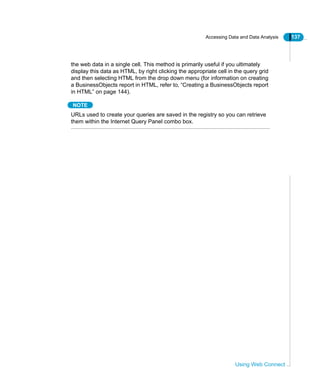
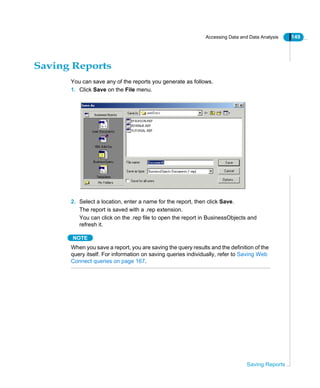
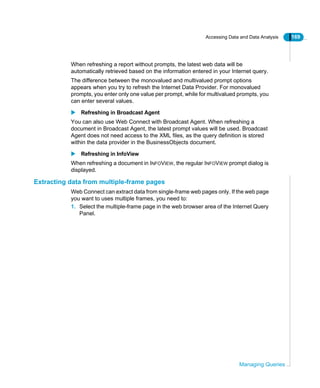
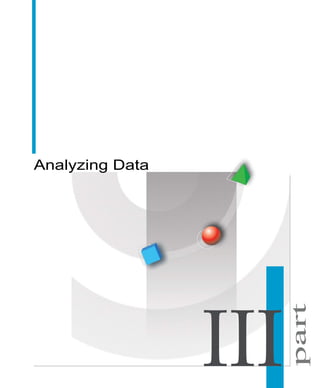
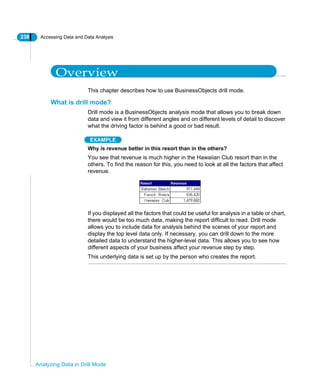
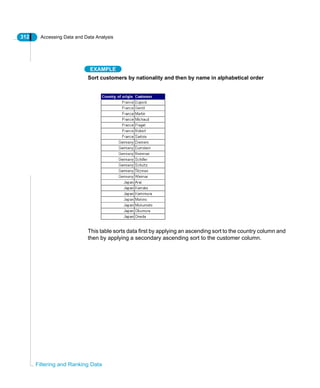
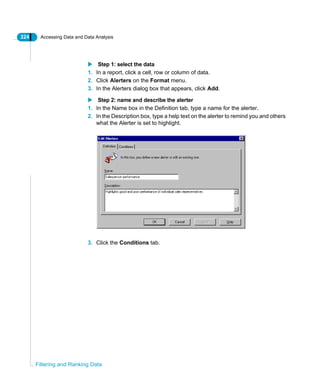
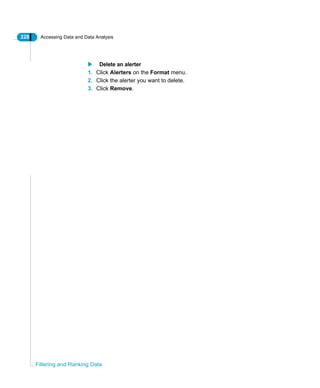
![506 Accessing Data and Data Analysis
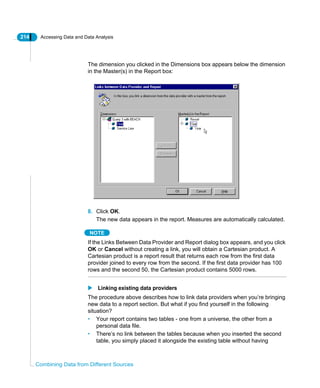
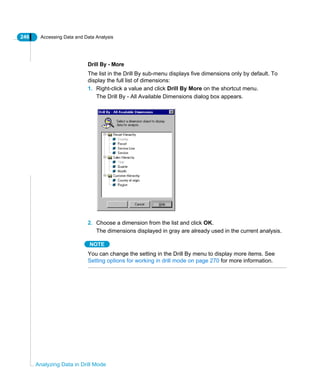
Launching BusinessObjects with the Run Command
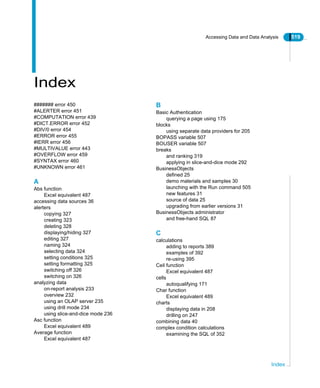
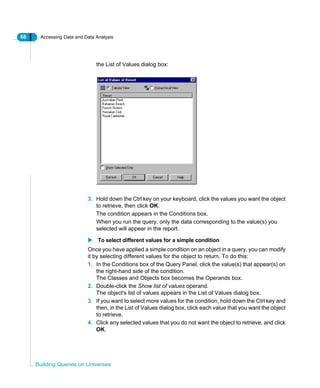
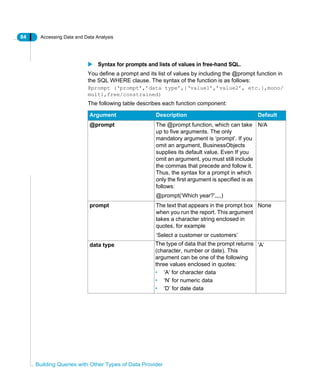
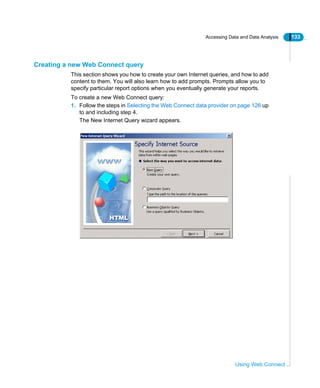
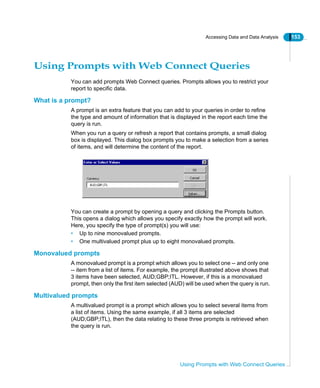
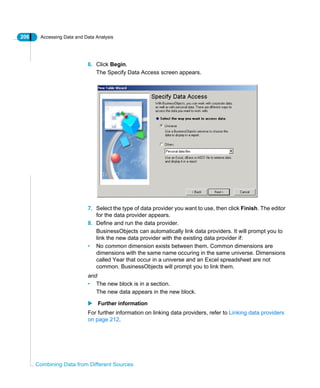
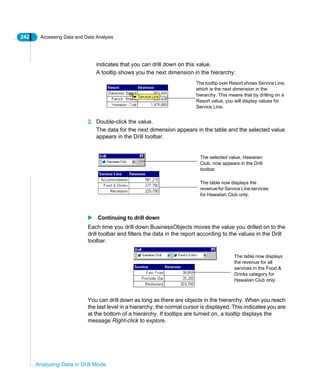
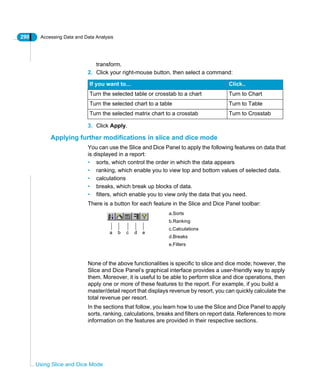
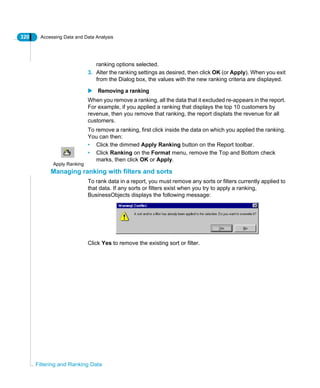
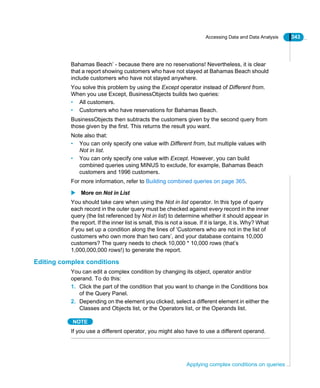
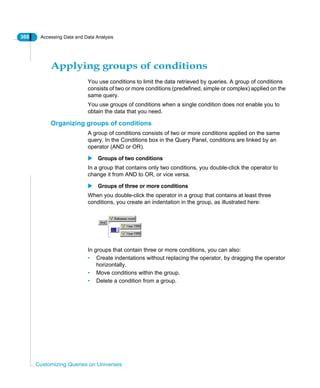
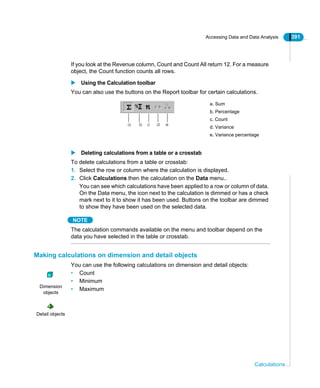
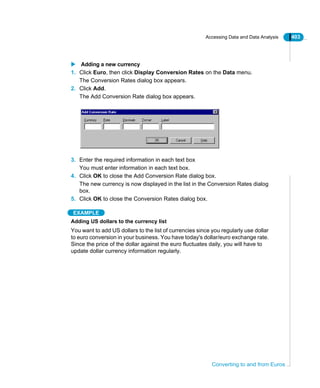
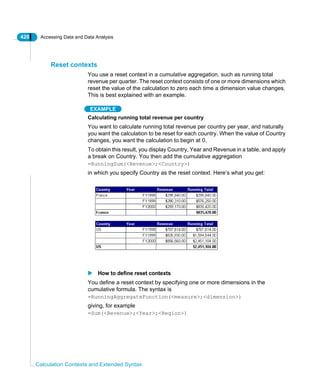
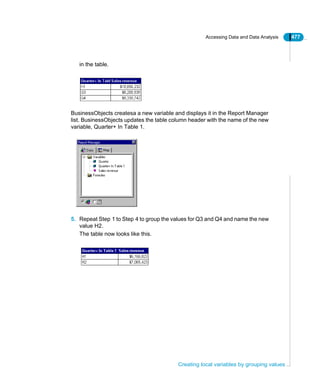
Run command options
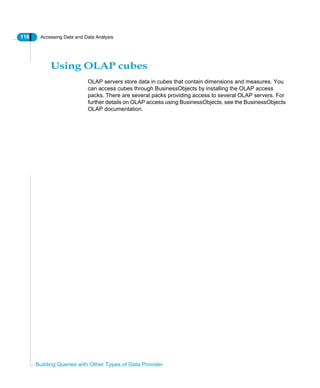
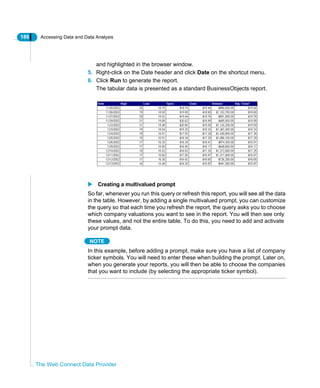
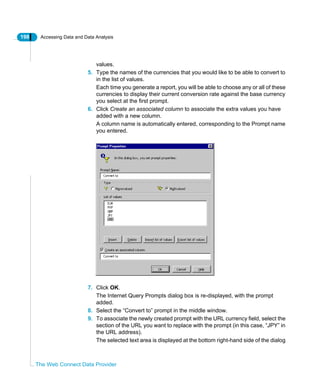
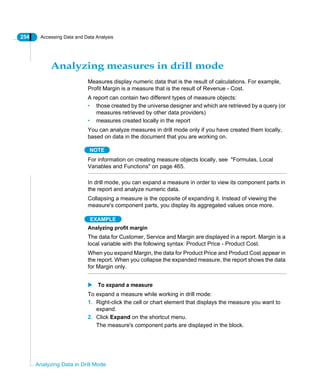
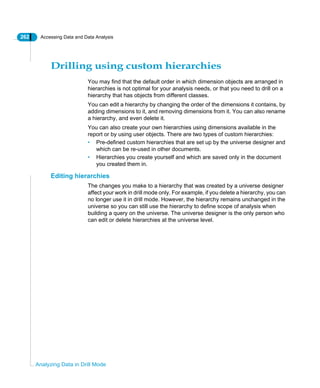
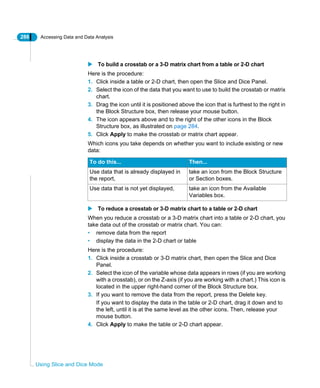
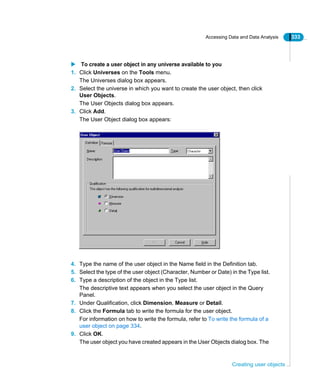
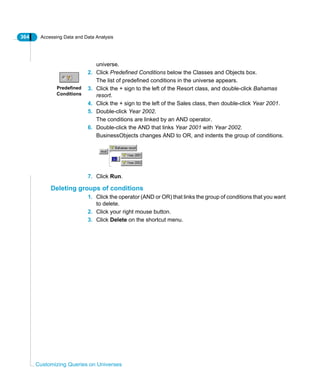
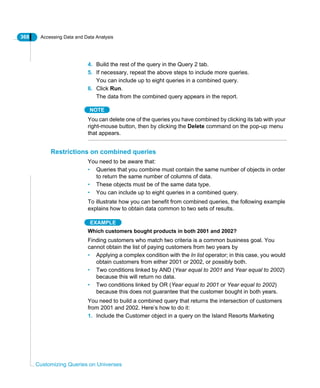
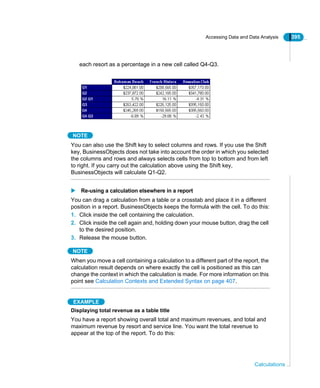
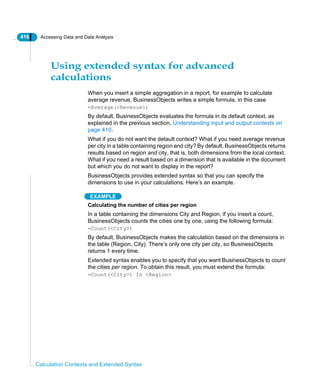
Run command options allow you to log in to BusinessObjects with your user
name and password. The table below describes the options that you can use.
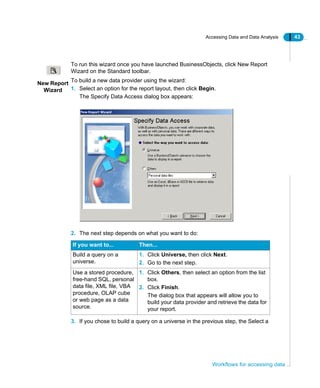
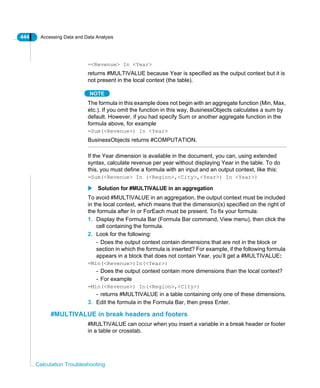
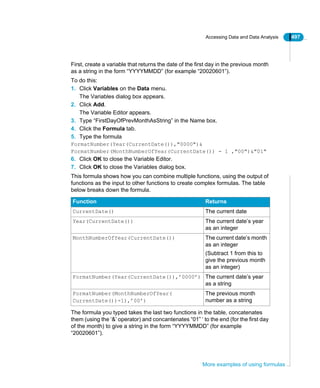
Option Description
-user [user name] The user name assigned to you by your supervisor.
User names that include spaces must be written in
double quotes, for example “user name”.
-pass [password] The password assigned to you by your supervisor.
This option is mandatory if you enter the -user
option. Passwords that include spaces must be
written in double quotes, for example “my
password”.
-online or
-offline
By default, the last connection mode of the specified
user, or “online” the first time you launch
BusinessObjects.
Offline mode disconnects you from the repository
and therefore disables remote connections during
your work session.
repname.rep The name of the document that you wish to work
with on launching BusinessObjects. You must
include the path to this file, for example:
c:BusinessObjectsuserdocssales.rep
-keyfile [keyfile name If you are working with multiple repositories,
specifies the repository you want to work with.
-nologo Runs BusinessObjects without showing the logo
screen.
-vars myfile.txt Name of a text file in which variables are specified.
You can specify BOUSER and BOPASS, which
manage your access to BusinessObjects. You can
also declare your own variables in the file. For more
information on these variables, refer to “Specifying
BOUSER, BOPASS and Other Variables” below.](https://image.slidesharecdn.com/businessobjectsaccessanalysis-130422050630-phpapp01/85/Businessobjects-access-analysis-508-320.jpg)