1. BUSINESS VALUATION METHODS
(All Valuations MUST BE based on Historical Data)
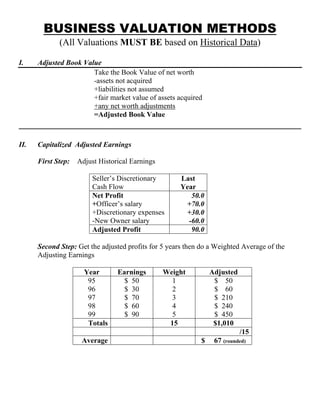
I. Adjusted Book Value
Take the Book Value of net worth
-assets not acquired
+liabilities not assumed
+fair market value of assets acquired
+any net worth adjustments
=Adjusted Book Value
____________________________________________________________
II. Capitalized Adjusted Earnings
First Step: Adjust Historical Earnings
Seller’s Discretionary
Cash Flow
Last
Year
Net Profit
+Officer’s salary
+Discretionary expenses
-New Owner salary
50.0
+70.0
+30.0
-60.0
Adjusted Profit 90.0
Second Step: Get the adjusted profits for 5 years then do a Weighted Average of the
Adjusting Earnings
Year Earnings Weight Adjusted
95
96
97
98
99
$ 50
$ 30
$ 70
$ 60
$ 90
1
2
3
4
5
$ 50
$ 60
$ 210
$ 240
$ 450
Totals 15 $1,010
/15
Average $ 67 (rounded)
2. Third Step: Calculate a Discount Rate
Determine T-Bill Rate 5.0%
Determine Offset Risk Rate
√ Establish rate of return based on risk
factors
√ Establish rate of return based on general
economy
12.0%
Determine Offset Illiquidity Rate 3.0%
Total the Rates 20.0%
Fourth Step: Take the weighted average of the adjusted earnings and divide by the
discount rate.
Example:
$67/.20 = $335
___________________________________________________________________
III. Discounted Future Earnings
First Step: Adjust Historical Earnings
Last
Year
Net Profit
+Officer’s salary
+Discretionary expenses
-New Owner salary
50.0
+70.0
+30.0
-60.0
Adjusted Profit 90.0
Second Step: Get the adjusted profits for 5 years then do a Weighted Average of the
Adjusting Earnings
Year Earnings Weight Adjusted
95
96
97
98
99
$ 50
$ 30
$ 70
$ 60
$ 90
1
2
3
4
5
$ 50
$ 60
$ 210
$ 240
$ 450
Totals 15 $1,010
/15
Average $ 67 (rounded)
3. Third Step: Determine the discount rate
Determine T-Bill Rate 7.0%
Determine Offset Risk Rate
√ Establish rate of return based on
risk factors
√ Establish rate of return based on
general economy
12.0%
Determine Offset Illiquidity Rate 6.0%
Total the Rates 25.0%
Fourth Step: Estimate growth, both real and inflationary (for this example, we are estimating a 5%
growth rate).
Fifth Step: Multiply the estimated earnings for each year by the estimated growth rate until estimated
earnings for the next ten years are determined.
Sixth Step: Multiply the adjusted, weighted earnings by the estimated growth (1 plus the growth rate) to
determine the estimated earnings for the first year.
Seventh Step: Using the net present value table, multiply the estimated earnings for each year by the
factor for the discount rate for each respective year to determine the discounted value of future earnings.
Eighth Step: Total the discounted earnings.
Ninth Step: Determine the residual value by subtracting the growth rate from the discount rate and
dividing the difference into the discounted earnings for year ten.
Tenth Step: Add the residual value to the total discounted earnings.
Year Previous
Year
Earnings
Growth
(1+5%)
Adjusted
Earnings
Factor
(25%)
Net Present
Value
1 67.0 1.05 70.4 0.80000 56.3
2 70.4 1.05 73.9 0.64000 47.3
3 73.9 1.05 77.6 0.51200 39.7
4 77.6 1.05 81.5 0.40960 33.4
5 81.5 1.05 85.6 0.32768 28.0
6 85.6 1.05 89.9 0.26214 23.6
7 89.9 1.05 94.4 0.20972 19.8
8 94.4 1.05 99.1 0.16777 16.6
9 99.1 1.05 104.1 0.13422 14.0
10 104.1 1.05 109.3 0.10737 11.7
Net Total 290.4
Residual 58.5
Total 348.9
4. IV. Cash Flow Method
First Step: Identify Available cash for debt service via rule of thumb, sources/uses, or any other
acceptable method.
Last
Year
Net Profit
+ Depreciation
10.0
5.0
Adjusted Profit 15.0
Second Step: Choose a reasonable maturity and market interest rate for the financing requested.
Years
Fixed Asset Purchases
Working Capital
10
7
Average Maturity 8.5
Interest Rate 12%
Third Step: Reverse-compute the amount of total funds that the cash flow can support given the
maturity and interest rate chosen (using an amortization table or calculator).
Cash flow of $15,000 annually at 12% for 8.5 years is an annual debt service for the total amount of $
79,696.69 (computed on a monthly payment basis) or $77,295.78 (computed on an annual payment
basis).
Cash flow valuation establishes a range of $77,000 to $80,000.
V. Gross Revenue Multiplier
Please use the attached table (Top 30 Business by SIC Code) and the following:
• SDC or SDCF = Seller’s discretionary cash flow [same as Method II, step 1]
• EBIT = Earning before Interest and Taxes
• EBITDA = Earning before Interest, Taxes, Depreciation and Amortization
Example:
Last Year’s Sales * Multiplier
5. Top 30 Type of Business by SIC Code
(Counted from 10/98 to 8/02)
Ranking
# of
Loans
SIC
Code Description Rule of Thumb1
or Multiplier
1 1900 5812 Eating and Drinking Places 2X SDCF or 25 – 35% of annual sales
2 405 7231 Beauty Shops 1.5X SDCF or 4X mthly sales + inventory
3 337 7538 General Automotive Repair Shops 35% of annual sales, 1.5X SDCF
4 325 5411 Grocery Stores 1 – 2X mthly sales or 11% of sales
5 260 8041 Offices and Clinics of Chiropractors 20 – 70% of annual fees + FF & E
6 235 5999 Miscellaneous Retail Stores 25 – 50% annual sales + inventory
7 231 7389 Business Services 63% of annual sales
8 228 8351 Child Day Care Services 2X SDCF or $1500 - $3000/per enrolled child
9 175 8011 Offices and Clinics of Doctors of Medicine 20 – 40% of annual fees or 1X SDC
10 165 7299 Miscellaneous Personal Services 70 –75% annual sales
11 165 5813 Drinking Places (Alcoholic Beverages) 40 – 45% annual sales + inventory
12 163 5947 Gift, Novelty, and Souvenir Shops 4X mthly sales + inventory or 1.5X SDCF
13 142 7991 Physical Fitness Facilities 1 year’s annual revenues
14 129 4212 Local Trucking Without Storage 5X EBIT
15 127 7379 Computer Related Services 57% of annual revenue
16 124 5531 Auto and Home Supply Stores 35% of annual sales + inventory, FF & E
17 120 5461 Retail Bakeries 4X mthly sales + inventory, FF & E
18 117 0781 Landscape Counseling and Planning 1 – 1.5X SDCF + FF & E
19 113 6411 Insurance Agents, Brokers, and Service 100% annual commissions
20 112 7999 Amusement and Recreation Services 45-50% of annual sales
21 112 5992 Florists 34% of annual sales + inventory
22 108 1751 Carpentry Work 4 - 5X EBIT
23 105 5541 Gasoline Service Stations 3X EBITDA – business only
24 105 7349 Building Cleaning and Maintenance
Services
50% of annual revenue or 1.5X SDCF
25 105 8021 Offices and Clinics of Dentists 1 – 1.5X SDCF + FF & E, 50-70% Revenue
26 105 4213 Trucking, Except Local 1 – 1.5X SDCF + FMV of fixed assets
27 103 5941 Sporting Goods Stores and Bicycle Shops 4X mthly sales + inventory
28 99 7215 Coin-Operated Laundries and Dry-cleaning 70 – 100% annual sales or 2.3 – 2.5X SDCF
29 94 7532 Auto Body and Upholstery Repair Shops 35% of annual sales or 1.75X SDCF
30 94 5399 Miscellaneous General Merchandise Stores 15 – 25% of annual sales + inventory
31 92 1799 Special Trade Contractors 45 – 55% annual sales
32 90 1711 Plumbing, Heating, and Air-Conditioning 24% of annual revenues or 1.5X SDCF
33 88 5499 Miscellaneous Food Stores 4 – 5X SDCF
34 88 2752 Commercial Printing, Lithographic 50% of annual sales and inventory, FF & E
1 – 1.5X SDC
1
Source: The Business Reference Guide 2002 tenth edition, by Tom West, 2002.