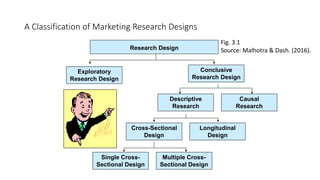
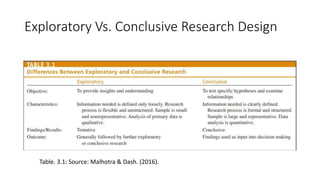
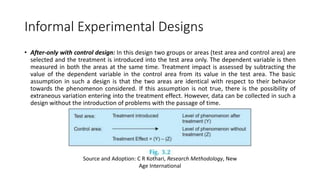
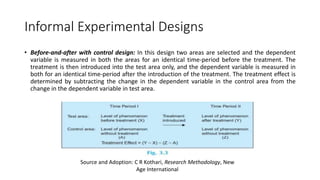
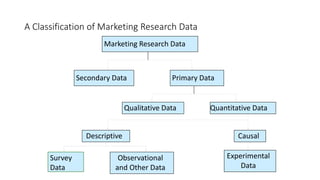
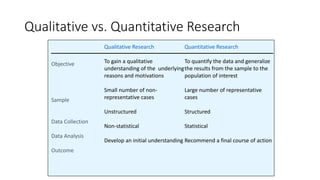
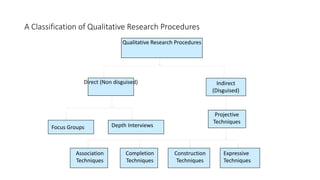
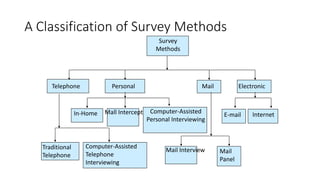
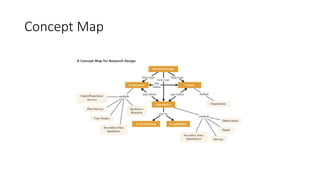
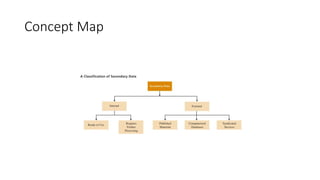
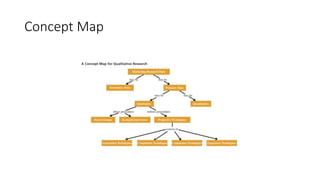
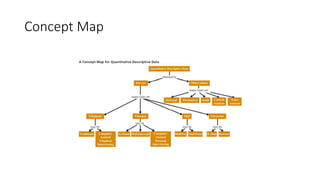
Business Research Methods-UNIT-II
• Course book Source and Adoption: C R Kothari, Research
Methodology, New Age International
UNIT CONTENT
• Research design
• Concept, Features of a good research design
• Use of a good research design
• Qualitative and Quantitative research approaches
• Comparison – Pros and Cons of both approaches.
• Research Designs: Concept, types and uses.
• Concept of Cross-sectional and Longitudinal Research.
• Experimental Design: Concept of Cause, Causal relationships, Concept of
Independent & Dependent variables, extraneous variable, Treatment,
Control group
Research design
• Research design A framework or blueprint for conducting the
marketing research project. It specifies the details of the procedures
necessary for obtaining the information needed to structure and/or
solve marketing research problems.
• Research design stands for advance planning of the methods to be
adopted for collecting the relevant data and the techniques to be
used in their analysis, keeping in view the objective of the research
and the availability of staff, time and money.
Components of a Good Research Design
• 1. Define the information needed.
• 2. Design the exploratory, descriptive, and/or causal phases of the
research .
• 3. The availability of time and money for the research work.
• 4. Specify the measurement and scaling procedures.
• 5. Construct and pretest a questionnaire (interviewing form) or an
appropriate form for data collection.
• 6. Specify the sampling process and sample size .
• 7. Develop a plan of data analysis.
NEED FOR RESEARCH DESIGN
• Research design is needed because it facilitates the smooth sailing of
the various research operations
• Making research as efficient as possible yielding maximal information
with minimal expenditure of effort,
• Saves time and money.
• Example: Just as for better, economical and attractive construction of
a house, we need a blueprint (or what is commonly called the map of
the house) well thought out and prepared by an expert architect,
similarly we need a research design or a plan in advance of data
collection and analysis for our research project.
A Classification of Marketing Research Designs
Single Cross-
Sectional Design
Multiple Cross-
Sectional Design
Fig. 3.1
Source: Malhotra & Dash. (2016).
Research Design
Conclusive
Research Design
Exploratory
Research Design
Descriptive
Research
Causal
Research
Cross-Sectional
Design
Longitudinal
Design
Exploratory Vs. Conclusive Research Design
Table. 3.1: Source: Malhotra & Dash. (2016).
Exploratory Research
• Exploratory Research: As its name implies, the objective of
exploratory research is to explore or search through a problem or
situation to provide insights and understanding (Table 3.2).
Exploratory research could be used for any of the following purposes:
• Formulate a problem or define a problem more precisely.
• Identify alternative courses of action.
• Develop hypotheses.
• Isolate key variables and relationships for further examination.
• Gain insights for developing an approach to the problem.
• Establish priorities for further research.
Comparison of Research Design
Table. 3.2: Source: Malhotra & Dash. (2016).
Descriptive Research
• As the name implies, the major objective of descriptive research is to describe something—
usually market characteristics or functions (see Table 3.2). Descriptive research is conducted for
the following reasons:
• 1. To describe the characteristics of relevant groups, such as consumers, salespeople,
organizations, or market areas. For example, we could develop a profile of the “heavy users”
(frequent shoppers) of prestigious department stores like Saks Fifth Avenue and Neiman Marcus.
• 2. To estimate the percentage of units in a specified population exhibiting a certain behavior. For
example, we might be interested in estimating the percentage of heavy users of prestigious
department stores who also patronize discount department stores.
• 3. To determine the perceptions of product characteristics. For example, how do households
perceive the various department stores in terms of salient factors of the choice criteria?
• 4. To determine the degree to which marketing variables are associated. For example, to what
extent is shopping at department stores related to eating out?
• 5. To make specific predictions. For example, what will be the retail sales of Neiman Marcus
(specific store) for fashion clothing (specific product category) in the Dallas area (specific region)?
Project Research: The Six Ws
1. Who—Who should be considered a patron of a particular department store? Some of the
possibilities are:
• a. Anyone who enters the department store, whether or not she or he purchases anything
• b. Anyone who purchases anything from the store
• c. Anyone who makes purchases at the department store at least once a month
• d. The person in the household most responsible for department store shopping
2. What—What information should be obtained from the respondents? A wide variety of
information could be obtained, including:
a. Frequency with which different department stores are patronized for specific product
categories
b. Evaluation of the various department stores in terms of the salient choice criteria
c. Information pertaining to specific hypotheses to be tested
d. Psychographics and lifestyles, media consumption habits, and demographics
Project Research: The Six Ws
3. When—When should the information be obtained from the respondents? The available options
include:
a. Before shopping
b. While shopping
c. Immediately after shopping
d. Some time after shopping to allow time for evaluation of their shopping experience
4. Where—Where should the respondents be contacted to obtain the required information?
Possibilities include contacting the respondents:
• a. In the store
• b. Outside the store but in the shopping mall
• c. In the parking lot
• d. At home
Project Research: The Six Ws
5. Why—Why are we obtaining information from the respondents? Why is the marketing research project
being conducted? Possible reasons could be to:
• a. Improve the image of the sponsoring store
• b. Improve patronage and market share
• c. Change the product mix
• d. Develop a suitable promotional campaign
• e. Decide on the location of a new store
6. Way—In what way are we going to obtain information from the respondents? The possible ways could be:
• a. Observation of respondents’ behavior
• b. Personal interviews
• c. Telephone interviews
• d. Mail interviews
• e. Electronic (e-mail or Internet) interviews
Other Examples of Descriptive Studies
• Market studies, which describe the size of the market, buying power of the consumers,
availability of distributors, and consumer profiles
• Market share studies, which determine the proportion of total sales received by a
company and its competitors
• Sales analysis studies, which describe sales by geographic region, product line, type and
size of the account
• Image studies, which determine consumer perceptions of the firm and its products
• Product usage studies, which describe consumption patterns
• Distribution studies, which determine traffic flow patterns and the number and location
of distributors
• Pricing studies, which describe the range and frequency of price changes and probable
consumer response to proposed price changes
• Advertising studies, which describe media consum
Cross-sectional Designs
• Involve the collection of information from any given sample of
population elements only once.
• In single cross-sectional designs, there is only one sample of
respondents and information is obtained from this sample only once.
• In multiple cross-sectional designs, there are two or more samples of
respondents, and information from each sample is obtained only
once. Often, information from different samples is obtained at
different times.
Longitudinal Designs
• A fixed sample (or samples) of population elements is measured
repeatedly on the same variables
• A longitudinal design differs from a cross-sectional design in that the
sample or samples remain the same over time
Relative Advantages and Disadvantages of
Longitudinal and Cross-Sectional Designs
Evaluation
Criteria
Cross-Sectional Design Longitudinal Design
Detecting Change
Large amount of data collection
Accuracy
Representative Sampling
Response bias
-
-
-
+
+
+
+
+
-
-
Note: A “+” indicates a relative advantage over the other design, whereas a “-”
indicates a relative disadvantage.
Table 3.4
Uses of Casual Research
• To understand which variables are the cause (independent variables)
and which variables are the effect (dependent variables) of a
phenomenon
• To determine the nature of the relationship between the causal
variables and the effect to be predicted
• METHOD: Experiments
Concepts in Research Design
• Variable: A concept which can take on different quantitative values is called a variable. As such the
concepts like weight, height, income are all examples of variables. Qualitative phenomena (or the
attributes) are also quantified on the basis of the presence or absence of the concerning attribute(s).
Phenomena which can take on quantitatively different values even in decimal points are called
‘continuous variables’.* But all variables are not continuous. If they can only be expressed in integer
values, they are non-continuous variables or in statistical language ‘discrete variables’. Age is an
example of continuous variable, but the number of children is an example of non-continuous variable
• Dependent Variable: If one variable depends upon or is a consequence of the other variable, it is
termed as a dependent variable.
• Independent Variable: The variable that is antecedent to the dependent variable is termed as an
independent variable.
• Example: For instance, if we say that height depends upon age, then height is a dependent variable
and age is an independent variable. Further, if in addition to being dependent upon age, height also
depends upon the individual’s sex, then height is a dependent variable and age and sex are
independent variables.
Concepts in Research Design
• Extraneous variable: Independent variables that are not related to the purpose of the study, but
may affect the dependent variable are termed as extraneous variables.
• Example: The researcher wants to test the hypothesis that there is a relationship between
children’s gains in social studies achievement and their self-concepts. In this case self-concept is
an independent variable and social studies achievement is a dependent variable. Intelligence may
as well affect the social studies achievement, but since it is not related to the purpose of the
study undertaken by the researcher, it will be termed as an extraneous variable.
• Whatever effect is noticed on dependent variable as a result of extraneous variable(s) is
technically described as an ‘experimental error’.
• A study must always be so designed that the effect upon the dependent variable is attributed
entirely to the independent variable(s), and not to some extraneous variable or variables.
Concepts in Research Design
• Control: One important characteristic of a good research design is to minimize the influence or
effect of extraneous variable(s). The technical term ‘control’ is used when we design the study
minimising the effects of extraneous independent variables. In experimental researches, the term
‘control’ is used to refer to restrain experimental conditions
• Confounded relationship: When the dependent variable is not free from the influence of
extraneous variable(s), the relationship between the dependent and independent variables is said
to be confounded by an extraneous variable(s).
• The research hypothesis is a predictive statement that relates an independent variable to a
dependent variable. Usually a research hypothesis must contain, at least, one independent and
one dependent variable. Predictive statements which are not to be objectively verified or the
relationships that are assumed but not to be tested, are not termed research hypotheses
Concepts in Research Design
• Experimental and non-experimental hypothesis-testing research: When the purpose of research is to test a
research hypothesis, it is termed as hypothesis-testing research. It can be of the experimental design or of
the non-experimental design.
• Research in which the independent variable is manipulated is termed ‘experimental hypothesis-testing
research’ and a research in which an independent variable is not manipulated is called ‘non-experimental
hypothesis-testing research’.
• For instance, suppose a researcher wants to study whether intelligence affects reading ability for a group of
students and for this purpose he randomly selects 50 students and tests their intelligence and reading ability
by calculating the coefficient of correlation between the two sets of scores. This is an example of non-
experimental hypothesis-testing research because herein the independent variable, intelligence, is not
manipulated.
• But now suppose that our researcher randomly selects 50 students from a group of students who are to take
a course in statistics and then divides them into two groups by randomly assigning 25 to Group A, the usual
studies programme, and 25 to Group B, the special studies programme. At the end of the course, he
administers a test to each group in order to judge the effectiveness of the training programme on the
student’s performance-level. This is an example of experimental hypothesis-testing research because in this
case the independent variable, viz., the type of training programme, is manipulated
Concepts in Research Design
• Experimental and control groups: In an experimental hypothesis-testing research when a group is
exposed to usual conditions, it is termed a ‘control group’, but when the group is exposed to some
novel or special condition, it is termed an ‘experimental group’. It is possible to design studies which
include only experimental groups or studies which include both experimental and control groups.
• Treatments: The different conditions under which experimental and control groups are put are usually
referred to as ‘treatments’. In the illustration taken above, the two treatments are the usual studies
programme and the special studies programme. Similarly, if we want to determine through an
experiment the comparative impact of three varieties of fertilizers on the yield of wheat, in that case
the three varieties of fertilizers will be treated as three treatments
• Experiment: The process of examining the truth of a statistical hypothesis, relating to some research
problem, is known as an experiment. For example, we can conduct an experiment to examine the
usefulness of a certain newly developed drug. Experiments can be of two types viz., absolute
experiment and comparative experiment. If we want to determine the impact of a fertilizer on the yield
of a crop, it is a case of absolute experiment; but if we want to determine the impact of one fertilizer as
compared to the impact of some other fertilizer, our experiment then will be termed as a comparative
experiment. Often, we undertake comparative experiments when we talk of designs of experiments.
Important Experimental Designs
Experimental
Research
Design
Informal
Before and
After without
control design
After and Only
With Control
Design
Before and
after with
control design
Formal
Completely
Randomized
Design
Randomized
block design
Latin Square
Design
Factorial
Design
Informal Experimental Designs
• Before-and-after without control design: In such a design a single test group or area is selected
and the dependent variable is measured before the introduction of the treatment. The treatment
is then introduced and the dependent variable is measured again after the treatment has been
introduced. The effect of the treatment would be equal to the level of the phenomenon after the
treatment minus the level of the phenomenon before the treatment. The main difficulty of such a
design is that with the passage of time considerable extraneous variations may be there in its
treatment effect.
Source and Adoption: C R Kothari, Research Methodology, New
Age International
Informal Experimental Designs
• After-only with control design: In this design two groups or areas (test area and control area) are
selected and the treatment is introduced into the test area only. The dependent variable is then
measured in both the areas at the same time. Treatment impact is assessed by subtracting the
value of the dependent variable in the control area from its value in the test area. The basic
assumption in such a design is that the two areas are identical with respect to their behavior
towards the phenomenon considered. If this assumption is not true, there is the possibility of
extraneous variation entering into the treatment effect. However, data can be collected in such a
design without the introduction of problems with the passage of time.
Source and Adoption: C R Kothari, Research Methodology, New
Age International
Informal Experimental Designs
• Before-and-after with control design: In this design two areas are selected and the dependent
variable is measured in both the areas for an identical time-period before the treatment. The
treatment is then introduced into the test area only, and the dependent variable is measured in
both for an identical time-period after the introduction of the treatment. The treatment effect is
determined by subtracting the change in the dependent variable in the control area from the
change in the dependent variable in test area.
Source and Adoption: C R Kothari, Research Methodology, New
Age International
Formal Experimental Designs
A Classification of Marketing Research Data
Survey
Data
Observational
and Other Data
Experimental
Data
Qualitative Data Quantitative Data
Descriptive Causal
Marketing Research Data
Secondary Data Primary Data
Qualitative vs. Quantitative Research
Qualitative Research
To gain a qualitative
understanding of the underlying
reasons and motivations
Small number of non-
representative cases
Unstructured
Non-statistical
Develop an initial understanding
Objective
Sample
Data Collection
Data Analysis
Outcome
Quantitative Research
To quantify the data and generalize
the results from the sample to the
population of interest
Large number of representative
cases
Structured
Statistical
Recommend a final course of action
A Classification of Qualitative Research Procedures
Association
Techniques
Completion
Techniques
Construction
Techniques
Expressive
Techniques
Direct (Non disguised) Indirect
(Disguised)
Focus Groups Depth Interviews
Projective
Techniques
Qualitative Research Procedures
A Classification of Survey Methods
Traditional
Telephone
Computer-Assisted
Telephone
Interviewing
Mail Interview Mail
Panel
In-Home Mall Intercept Computer-Assisted
Personal Interviewing
E-mail Internet
Survey
Methods
Telephone Personal Mail Electronic
Observation Methods
Disguised versus Undisguised Observation
• In disguised observation, the respondents are unaware that they are
being observed. Disguise may be accomplished by using one-way
mirrors, hidden cameras, or inconspicuous mechanical devices.
Observers may be disguised as shoppers or sales clerks.
• In undisguised observation, the respondents are aware that they are
under observation.
Observation Methods
Natural versus Contrived Observation
• Natural observation involves observing behavior as it takes places in
the environment. For example, one could observe the behavior of
respondents eating fast food in Burger King.
• In contrived observation, respondents' behavior is observed in an
artificial environment, such as a test kitchen.
A Classification of Observation Methods
Observation Methods
Personal
Observation
Mechanical
Observation
Trace
Analysis
Content
Analysis
Audit
Observation Methods
Personal Observation
• A researcher observes actual behavior as it occurs.
• The observer does not attempt to manipulate the phenomenon being
observed but merely records what takes place.
• For example, a researcher might record traffic counts and observe
traffic flows in a department store.
Observation Methods
Mechanical Observation
Do not require respondents' direct participation.
• the AC Nielsen audimeter
• turnstiles that record the number of people entering or leaving a building.
• On-site cameras (still, motion picture, or video)
• Optical scanners in supermarkets
Do require respondent involvement.
• eye-tracking monitors
• pupilometers
• psychogalvanometers
• voice pitch analyzers
• devices measuring response latency
Observation Methods
Audit
• The researcher collects data by examining physical records or
performing inventory analysis.
• Data are collected personally by the researcher.
• The data are based upon counts, usually of physical objects.
• Retail and wholesale audits conducted by marketing research
suppliers were discussed in the context of syndicated data in
Observation Methods
Content Analysis
• The objective, systematic, and quantitative description of the
manifest content of a communication.
• The unit of analysis may be words, characters (individuals or objects),
themes (propositions), space and time measures (length or duration
of the message), or topics (subject of the message).
• Analytical categories for classifying the units are developed and the
communication is broken down according to prescribed rules.
Observation Methods
Trace Analysis
Data collection is based on physical traces, or evidence, of past
behavior.
• The selective erosion of tiles in a museum indexed by the replacement rate was used to
determine the relative popularity of exhibits.
• The number of different fingerprints on a page was used to gauge the readership of various
advertisements in a magazine.
• The position of the radio dials in cars brought in for service was used to estimate share of
listening audience of various radio stations.
• The age and condition of cars in a parking lot were used to assess the affluence of customers.
• The magazines people donated to charity were used to determine people's favorite magazines.
• Internet visitors leave traces which can be analyzed to examine browsing and usage behavior by
using cookies.
A Comparative Evaluation of Observation Methods
Criteria Personal Mechanical Audit Content Trace
Observation Observation Analysis Analysis Analysis
Degree of structure Low Low to high High High Medium
Degree of disguise Medium Low to high Low High High
Ability to observe High Low to high High Medium Low
in natural setting
Observation bias High Low Low Medium Medium
Analysis Bias High Low to Low Low Medium
Medium
General remarks Most Can be Expensive Limited to Method of
flexible intrusive commu- last resort
nications
Relative Advantages of Observation
• They permit measurement of actual behavior rather than reports of
intended or preferred behavior.
• There is no reporting bias, and potential bias caused by the
interviewer and the interviewing process is eliminated or reduced.
• Certain types of data can be collected only by observation.
• If the observed phenomenon occurs frequently or is of short
duration, observational methods may be cheaper and faster than
survey methods.
Relative Disadvantages of Observation
• The reasons for the observed behavior may not be determined since little is
known about the underlying motives, beliefs, attitudes, and preferences.
• Selective perception (bias in the researcher's perception) can bias the data.
• Observational data are often time-consuming and expensive, and it is difficult to
observe certain forms of behavior.
• In some cases, the use of observational methods may be unethical, as in
observing people without their knowledge or consent.
It is best to view observation as a complement to survey methods, rather than as
being in competition with them.
A Comparative Evaluation of Survey Methods for International
Marketing Research
Criteria Telephone Personal Mail Electronic
High sample control + + - -
Difficulty in locating + - + +
respondents at home
Inaccessibility of homes + - + +
Unavailability of a large + - + +
pool of trained interviewers
Large population in rural areas - + - -
Unavailability of maps + - + +
Unavailability of current - + - +
telephone directory
Unavailability of mailing lists + + - +
Low penetration of telephones - + + -
Lack of an efficient postal system + + - +
Low level of literacy - + - -
Face-to-face communication culture - + - -
Poor access to computers & Internet ? + ? -
Note: A (+) denotes an advantage, and a (–) denotes a disadvantage.
Table 6.4
Concept Map
Concept Map
Concept Map
Concept Map

Business Research Methods lol.pptx

  • 1.
    Business Research Methods-UNIT-II •Course book Source and Adoption: C R Kothari, Research Methodology, New Age International
  • 2.
    UNIT CONTENT • Researchdesign • Concept, Features of a good research design • Use of a good research design • Qualitative and Quantitative research approaches • Comparison – Pros and Cons of both approaches. • Research Designs: Concept, types and uses. • Concept of Cross-sectional and Longitudinal Research. • Experimental Design: Concept of Cause, Causal relationships, Concept of Independent & Dependent variables, extraneous variable, Treatment, Control group
  • 3.
    Research design • Researchdesign A framework or blueprint for conducting the marketing research project. It specifies the details of the procedures necessary for obtaining the information needed to structure and/or solve marketing research problems. • Research design stands for advance planning of the methods to be adopted for collecting the relevant data and the techniques to be used in their analysis, keeping in view the objective of the research and the availability of staff, time and money.
  • 4.
    Components of aGood Research Design • 1. Define the information needed. • 2. Design the exploratory, descriptive, and/or causal phases of the research . • 3. The availability of time and money for the research work. • 4. Specify the measurement and scaling procedures. • 5. Construct and pretest a questionnaire (interviewing form) or an appropriate form for data collection. • 6. Specify the sampling process and sample size . • 7. Develop a plan of data analysis.
  • 5.
    NEED FOR RESEARCHDESIGN • Research design is needed because it facilitates the smooth sailing of the various research operations • Making research as efficient as possible yielding maximal information with minimal expenditure of effort, • Saves time and money. • Example: Just as for better, economical and attractive construction of a house, we need a blueprint (or what is commonly called the map of the house) well thought out and prepared by an expert architect, similarly we need a research design or a plan in advance of data collection and analysis for our research project.
  • 6.
    A Classification ofMarketing Research Designs Single Cross- Sectional Design Multiple Cross- Sectional Design Fig. 3.1 Source: Malhotra & Dash. (2016). Research Design Conclusive Research Design Exploratory Research Design Descriptive Research Causal Research Cross-Sectional Design Longitudinal Design
  • 7.
    Exploratory Vs. ConclusiveResearch Design Table. 3.1: Source: Malhotra & Dash. (2016).
  • 8.
    Exploratory Research • ExploratoryResearch: As its name implies, the objective of exploratory research is to explore or search through a problem or situation to provide insights and understanding (Table 3.2). Exploratory research could be used for any of the following purposes: • Formulate a problem or define a problem more precisely. • Identify alternative courses of action. • Develop hypotheses. • Isolate key variables and relationships for further examination. • Gain insights for developing an approach to the problem. • Establish priorities for further research.
  • 9.
    Comparison of ResearchDesign Table. 3.2: Source: Malhotra & Dash. (2016).
  • 10.
    Descriptive Research • Asthe name implies, the major objective of descriptive research is to describe something— usually market characteristics or functions (see Table 3.2). Descriptive research is conducted for the following reasons: • 1. To describe the characteristics of relevant groups, such as consumers, salespeople, organizations, or market areas. For example, we could develop a profile of the “heavy users” (frequent shoppers) of prestigious department stores like Saks Fifth Avenue and Neiman Marcus. • 2. To estimate the percentage of units in a specified population exhibiting a certain behavior. For example, we might be interested in estimating the percentage of heavy users of prestigious department stores who also patronize discount department stores. • 3. To determine the perceptions of product characteristics. For example, how do households perceive the various department stores in terms of salient factors of the choice criteria? • 4. To determine the degree to which marketing variables are associated. For example, to what extent is shopping at department stores related to eating out? • 5. To make specific predictions. For example, what will be the retail sales of Neiman Marcus (specific store) for fashion clothing (specific product category) in the Dallas area (specific region)?
  • 11.
    Project Research: TheSix Ws 1. Who—Who should be considered a patron of a particular department store? Some of the possibilities are: • a. Anyone who enters the department store, whether or not she or he purchases anything • b. Anyone who purchases anything from the store • c. Anyone who makes purchases at the department store at least once a month • d. The person in the household most responsible for department store shopping 2. What—What information should be obtained from the respondents? A wide variety of information could be obtained, including: a. Frequency with which different department stores are patronized for specific product categories b. Evaluation of the various department stores in terms of the salient choice criteria c. Information pertaining to specific hypotheses to be tested d. Psychographics and lifestyles, media consumption habits, and demographics
  • 12.
    Project Research: TheSix Ws 3. When—When should the information be obtained from the respondents? The available options include: a. Before shopping b. While shopping c. Immediately after shopping d. Some time after shopping to allow time for evaluation of their shopping experience 4. Where—Where should the respondents be contacted to obtain the required information? Possibilities include contacting the respondents: • a. In the store • b. Outside the store but in the shopping mall • c. In the parking lot • d. At home
  • 13.
    Project Research: TheSix Ws 5. Why—Why are we obtaining information from the respondents? Why is the marketing research project being conducted? Possible reasons could be to: • a. Improve the image of the sponsoring store • b. Improve patronage and market share • c. Change the product mix • d. Develop a suitable promotional campaign • e. Decide on the location of a new store 6. Way—In what way are we going to obtain information from the respondents? The possible ways could be: • a. Observation of respondents’ behavior • b. Personal interviews • c. Telephone interviews • d. Mail interviews • e. Electronic (e-mail or Internet) interviews
  • 14.
    Other Examples ofDescriptive Studies • Market studies, which describe the size of the market, buying power of the consumers, availability of distributors, and consumer profiles • Market share studies, which determine the proportion of total sales received by a company and its competitors • Sales analysis studies, which describe sales by geographic region, product line, type and size of the account • Image studies, which determine consumer perceptions of the firm and its products • Product usage studies, which describe consumption patterns • Distribution studies, which determine traffic flow patterns and the number and location of distributors • Pricing studies, which describe the range and frequency of price changes and probable consumer response to proposed price changes • Advertising studies, which describe media consum
  • 15.
    Cross-sectional Designs • Involvethe collection of information from any given sample of population elements only once. • In single cross-sectional designs, there is only one sample of respondents and information is obtained from this sample only once. • In multiple cross-sectional designs, there are two or more samples of respondents, and information from each sample is obtained only once. Often, information from different samples is obtained at different times.
  • 16.
    Longitudinal Designs • Afixed sample (or samples) of population elements is measured repeatedly on the same variables • A longitudinal design differs from a cross-sectional design in that the sample or samples remain the same over time
  • 17.
    Relative Advantages andDisadvantages of Longitudinal and Cross-Sectional Designs Evaluation Criteria Cross-Sectional Design Longitudinal Design Detecting Change Large amount of data collection Accuracy Representative Sampling Response bias - - - + + + + + - - Note: A “+” indicates a relative advantage over the other design, whereas a “-” indicates a relative disadvantage. Table 3.4
  • 18.
    Uses of CasualResearch • To understand which variables are the cause (independent variables) and which variables are the effect (dependent variables) of a phenomenon • To determine the nature of the relationship between the causal variables and the effect to be predicted • METHOD: Experiments
  • 19.
    Concepts in ResearchDesign • Variable: A concept which can take on different quantitative values is called a variable. As such the concepts like weight, height, income are all examples of variables. Qualitative phenomena (or the attributes) are also quantified on the basis of the presence or absence of the concerning attribute(s). Phenomena which can take on quantitatively different values even in decimal points are called ‘continuous variables’.* But all variables are not continuous. If they can only be expressed in integer values, they are non-continuous variables or in statistical language ‘discrete variables’. Age is an example of continuous variable, but the number of children is an example of non-continuous variable • Dependent Variable: If one variable depends upon or is a consequence of the other variable, it is termed as a dependent variable. • Independent Variable: The variable that is antecedent to the dependent variable is termed as an independent variable. • Example: For instance, if we say that height depends upon age, then height is a dependent variable and age is an independent variable. Further, if in addition to being dependent upon age, height also depends upon the individual’s sex, then height is a dependent variable and age and sex are independent variables.
  • 20.
    Concepts in ResearchDesign • Extraneous variable: Independent variables that are not related to the purpose of the study, but may affect the dependent variable are termed as extraneous variables. • Example: The researcher wants to test the hypothesis that there is a relationship between children’s gains in social studies achievement and their self-concepts. In this case self-concept is an independent variable and social studies achievement is a dependent variable. Intelligence may as well affect the social studies achievement, but since it is not related to the purpose of the study undertaken by the researcher, it will be termed as an extraneous variable. • Whatever effect is noticed on dependent variable as a result of extraneous variable(s) is technically described as an ‘experimental error’. • A study must always be so designed that the effect upon the dependent variable is attributed entirely to the independent variable(s), and not to some extraneous variable or variables.
  • 21.
    Concepts in ResearchDesign • Control: One important characteristic of a good research design is to minimize the influence or effect of extraneous variable(s). The technical term ‘control’ is used when we design the study minimising the effects of extraneous independent variables. In experimental researches, the term ‘control’ is used to refer to restrain experimental conditions • Confounded relationship: When the dependent variable is not free from the influence of extraneous variable(s), the relationship between the dependent and independent variables is said to be confounded by an extraneous variable(s). • The research hypothesis is a predictive statement that relates an independent variable to a dependent variable. Usually a research hypothesis must contain, at least, one independent and one dependent variable. Predictive statements which are not to be objectively verified or the relationships that are assumed but not to be tested, are not termed research hypotheses
  • 22.
    Concepts in ResearchDesign • Experimental and non-experimental hypothesis-testing research: When the purpose of research is to test a research hypothesis, it is termed as hypothesis-testing research. It can be of the experimental design or of the non-experimental design. • Research in which the independent variable is manipulated is termed ‘experimental hypothesis-testing research’ and a research in which an independent variable is not manipulated is called ‘non-experimental hypothesis-testing research’. • For instance, suppose a researcher wants to study whether intelligence affects reading ability for a group of students and for this purpose he randomly selects 50 students and tests their intelligence and reading ability by calculating the coefficient of correlation between the two sets of scores. This is an example of non- experimental hypothesis-testing research because herein the independent variable, intelligence, is not manipulated. • But now suppose that our researcher randomly selects 50 students from a group of students who are to take a course in statistics and then divides them into two groups by randomly assigning 25 to Group A, the usual studies programme, and 25 to Group B, the special studies programme. At the end of the course, he administers a test to each group in order to judge the effectiveness of the training programme on the student’s performance-level. This is an example of experimental hypothesis-testing research because in this case the independent variable, viz., the type of training programme, is manipulated
  • 23.
    Concepts in ResearchDesign • Experimental and control groups: In an experimental hypothesis-testing research when a group is exposed to usual conditions, it is termed a ‘control group’, but when the group is exposed to some novel or special condition, it is termed an ‘experimental group’. It is possible to design studies which include only experimental groups or studies which include both experimental and control groups. • Treatments: The different conditions under which experimental and control groups are put are usually referred to as ‘treatments’. In the illustration taken above, the two treatments are the usual studies programme and the special studies programme. Similarly, if we want to determine through an experiment the comparative impact of three varieties of fertilizers on the yield of wheat, in that case the three varieties of fertilizers will be treated as three treatments • Experiment: The process of examining the truth of a statistical hypothesis, relating to some research problem, is known as an experiment. For example, we can conduct an experiment to examine the usefulness of a certain newly developed drug. Experiments can be of two types viz., absolute experiment and comparative experiment. If we want to determine the impact of a fertilizer on the yield of a crop, it is a case of absolute experiment; but if we want to determine the impact of one fertilizer as compared to the impact of some other fertilizer, our experiment then will be termed as a comparative experiment. Often, we undertake comparative experiments when we talk of designs of experiments.
  • 24.
    Important Experimental Designs Experimental Research Design Informal Beforeand After without control design After and Only With Control Design Before and after with control design Formal Completely Randomized Design Randomized block design Latin Square Design Factorial Design
  • 25.
    Informal Experimental Designs •Before-and-after without control design: In such a design a single test group or area is selected and the dependent variable is measured before the introduction of the treatment. The treatment is then introduced and the dependent variable is measured again after the treatment has been introduced. The effect of the treatment would be equal to the level of the phenomenon after the treatment minus the level of the phenomenon before the treatment. The main difficulty of such a design is that with the passage of time considerable extraneous variations may be there in its treatment effect. Source and Adoption: C R Kothari, Research Methodology, New Age International
  • 26.
    Informal Experimental Designs •After-only with control design: In this design two groups or areas (test area and control area) are selected and the treatment is introduced into the test area only. The dependent variable is then measured in both the areas at the same time. Treatment impact is assessed by subtracting the value of the dependent variable in the control area from its value in the test area. The basic assumption in such a design is that the two areas are identical with respect to their behavior towards the phenomenon considered. If this assumption is not true, there is the possibility of extraneous variation entering into the treatment effect. However, data can be collected in such a design without the introduction of problems with the passage of time. Source and Adoption: C R Kothari, Research Methodology, New Age International
  • 27.
    Informal Experimental Designs •Before-and-after with control design: In this design two areas are selected and the dependent variable is measured in both the areas for an identical time-period before the treatment. The treatment is then introduced into the test area only, and the dependent variable is measured in both for an identical time-period after the introduction of the treatment. The treatment effect is determined by subtracting the change in the dependent variable in the control area from the change in the dependent variable in test area. Source and Adoption: C R Kothari, Research Methodology, New Age International
  • 28.
  • 29.
    A Classification ofMarketing Research Data Survey Data Observational and Other Data Experimental Data Qualitative Data Quantitative Data Descriptive Causal Marketing Research Data Secondary Data Primary Data
  • 30.
    Qualitative vs. QuantitativeResearch Qualitative Research To gain a qualitative understanding of the underlying reasons and motivations Small number of non- representative cases Unstructured Non-statistical Develop an initial understanding Objective Sample Data Collection Data Analysis Outcome Quantitative Research To quantify the data and generalize the results from the sample to the population of interest Large number of representative cases Structured Statistical Recommend a final course of action
  • 31.
    A Classification ofQualitative Research Procedures Association Techniques Completion Techniques Construction Techniques Expressive Techniques Direct (Non disguised) Indirect (Disguised) Focus Groups Depth Interviews Projective Techniques Qualitative Research Procedures
  • 32.
    A Classification ofSurvey Methods Traditional Telephone Computer-Assisted Telephone Interviewing Mail Interview Mail Panel In-Home Mall Intercept Computer-Assisted Personal Interviewing E-mail Internet Survey Methods Telephone Personal Mail Electronic
  • 33.
    Observation Methods Disguised versusUndisguised Observation • In disguised observation, the respondents are unaware that they are being observed. Disguise may be accomplished by using one-way mirrors, hidden cameras, or inconspicuous mechanical devices. Observers may be disguised as shoppers or sales clerks. • In undisguised observation, the respondents are aware that they are under observation.
  • 34.
    Observation Methods Natural versusContrived Observation • Natural observation involves observing behavior as it takes places in the environment. For example, one could observe the behavior of respondents eating fast food in Burger King. • In contrived observation, respondents' behavior is observed in an artificial environment, such as a test kitchen.
  • 35.
    A Classification ofObservation Methods Observation Methods Personal Observation Mechanical Observation Trace Analysis Content Analysis Audit
  • 36.
    Observation Methods Personal Observation •A researcher observes actual behavior as it occurs. • The observer does not attempt to manipulate the phenomenon being observed but merely records what takes place. • For example, a researcher might record traffic counts and observe traffic flows in a department store.
  • 37.
    Observation Methods Mechanical Observation Donot require respondents' direct participation. • the AC Nielsen audimeter • turnstiles that record the number of people entering or leaving a building. • On-site cameras (still, motion picture, or video) • Optical scanners in supermarkets Do require respondent involvement. • eye-tracking monitors • pupilometers • psychogalvanometers • voice pitch analyzers • devices measuring response latency
  • 38.
    Observation Methods Audit • Theresearcher collects data by examining physical records or performing inventory analysis. • Data are collected personally by the researcher. • The data are based upon counts, usually of physical objects. • Retail and wholesale audits conducted by marketing research suppliers were discussed in the context of syndicated data in
  • 39.
    Observation Methods Content Analysis •The objective, systematic, and quantitative description of the manifest content of a communication. • The unit of analysis may be words, characters (individuals or objects), themes (propositions), space and time measures (length or duration of the message), or topics (subject of the message). • Analytical categories for classifying the units are developed and the communication is broken down according to prescribed rules.
  • 40.
    Observation Methods Trace Analysis Datacollection is based on physical traces, or evidence, of past behavior. • The selective erosion of tiles in a museum indexed by the replacement rate was used to determine the relative popularity of exhibits. • The number of different fingerprints on a page was used to gauge the readership of various advertisements in a magazine. • The position of the radio dials in cars brought in for service was used to estimate share of listening audience of various radio stations. • The age and condition of cars in a parking lot were used to assess the affluence of customers. • The magazines people donated to charity were used to determine people's favorite magazines. • Internet visitors leave traces which can be analyzed to examine browsing and usage behavior by using cookies.
  • 41.
    A Comparative Evaluationof Observation Methods Criteria Personal Mechanical Audit Content Trace Observation Observation Analysis Analysis Analysis Degree of structure Low Low to high High High Medium Degree of disguise Medium Low to high Low High High Ability to observe High Low to high High Medium Low in natural setting Observation bias High Low Low Medium Medium Analysis Bias High Low to Low Low Medium Medium General remarks Most Can be Expensive Limited to Method of flexible intrusive commu- last resort nications
  • 42.
    Relative Advantages ofObservation • They permit measurement of actual behavior rather than reports of intended or preferred behavior. • There is no reporting bias, and potential bias caused by the interviewer and the interviewing process is eliminated or reduced. • Certain types of data can be collected only by observation. • If the observed phenomenon occurs frequently or is of short duration, observational methods may be cheaper and faster than survey methods.
  • 43.
    Relative Disadvantages ofObservation • The reasons for the observed behavior may not be determined since little is known about the underlying motives, beliefs, attitudes, and preferences. • Selective perception (bias in the researcher's perception) can bias the data. • Observational data are often time-consuming and expensive, and it is difficult to observe certain forms of behavior. • In some cases, the use of observational methods may be unethical, as in observing people without their knowledge or consent. It is best to view observation as a complement to survey methods, rather than as being in competition with them.
  • 44.
    A Comparative Evaluationof Survey Methods for International Marketing Research Criteria Telephone Personal Mail Electronic High sample control + + - - Difficulty in locating + - + + respondents at home Inaccessibility of homes + - + + Unavailability of a large + - + + pool of trained interviewers Large population in rural areas - + - - Unavailability of maps + - + + Unavailability of current - + - + telephone directory Unavailability of mailing lists + + - + Low penetration of telephones - + + - Lack of an efficient postal system + + - + Low level of literacy - + - - Face-to-face communication culture - + - - Poor access to computers & Internet ? + ? - Note: A (+) denotes an advantage, and a (–) denotes a disadvantage. Table 6.4
  • 45.
  • 46.
  • 47.
  • 48.