Download to read offline


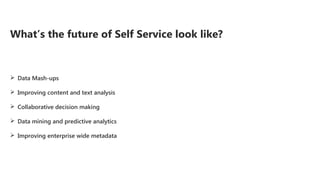


The document discusses the explosive growth of global information and the need for effective business intelligence solutions. It highlights challenges faced by organizations in providing decision makers with necessary insights, emphasizing the importance of self-service business intelligence tools. Key future trends include data mash-ups, improved analytics, and collaborative decision-making processes.


