Download as PDF, PPTX
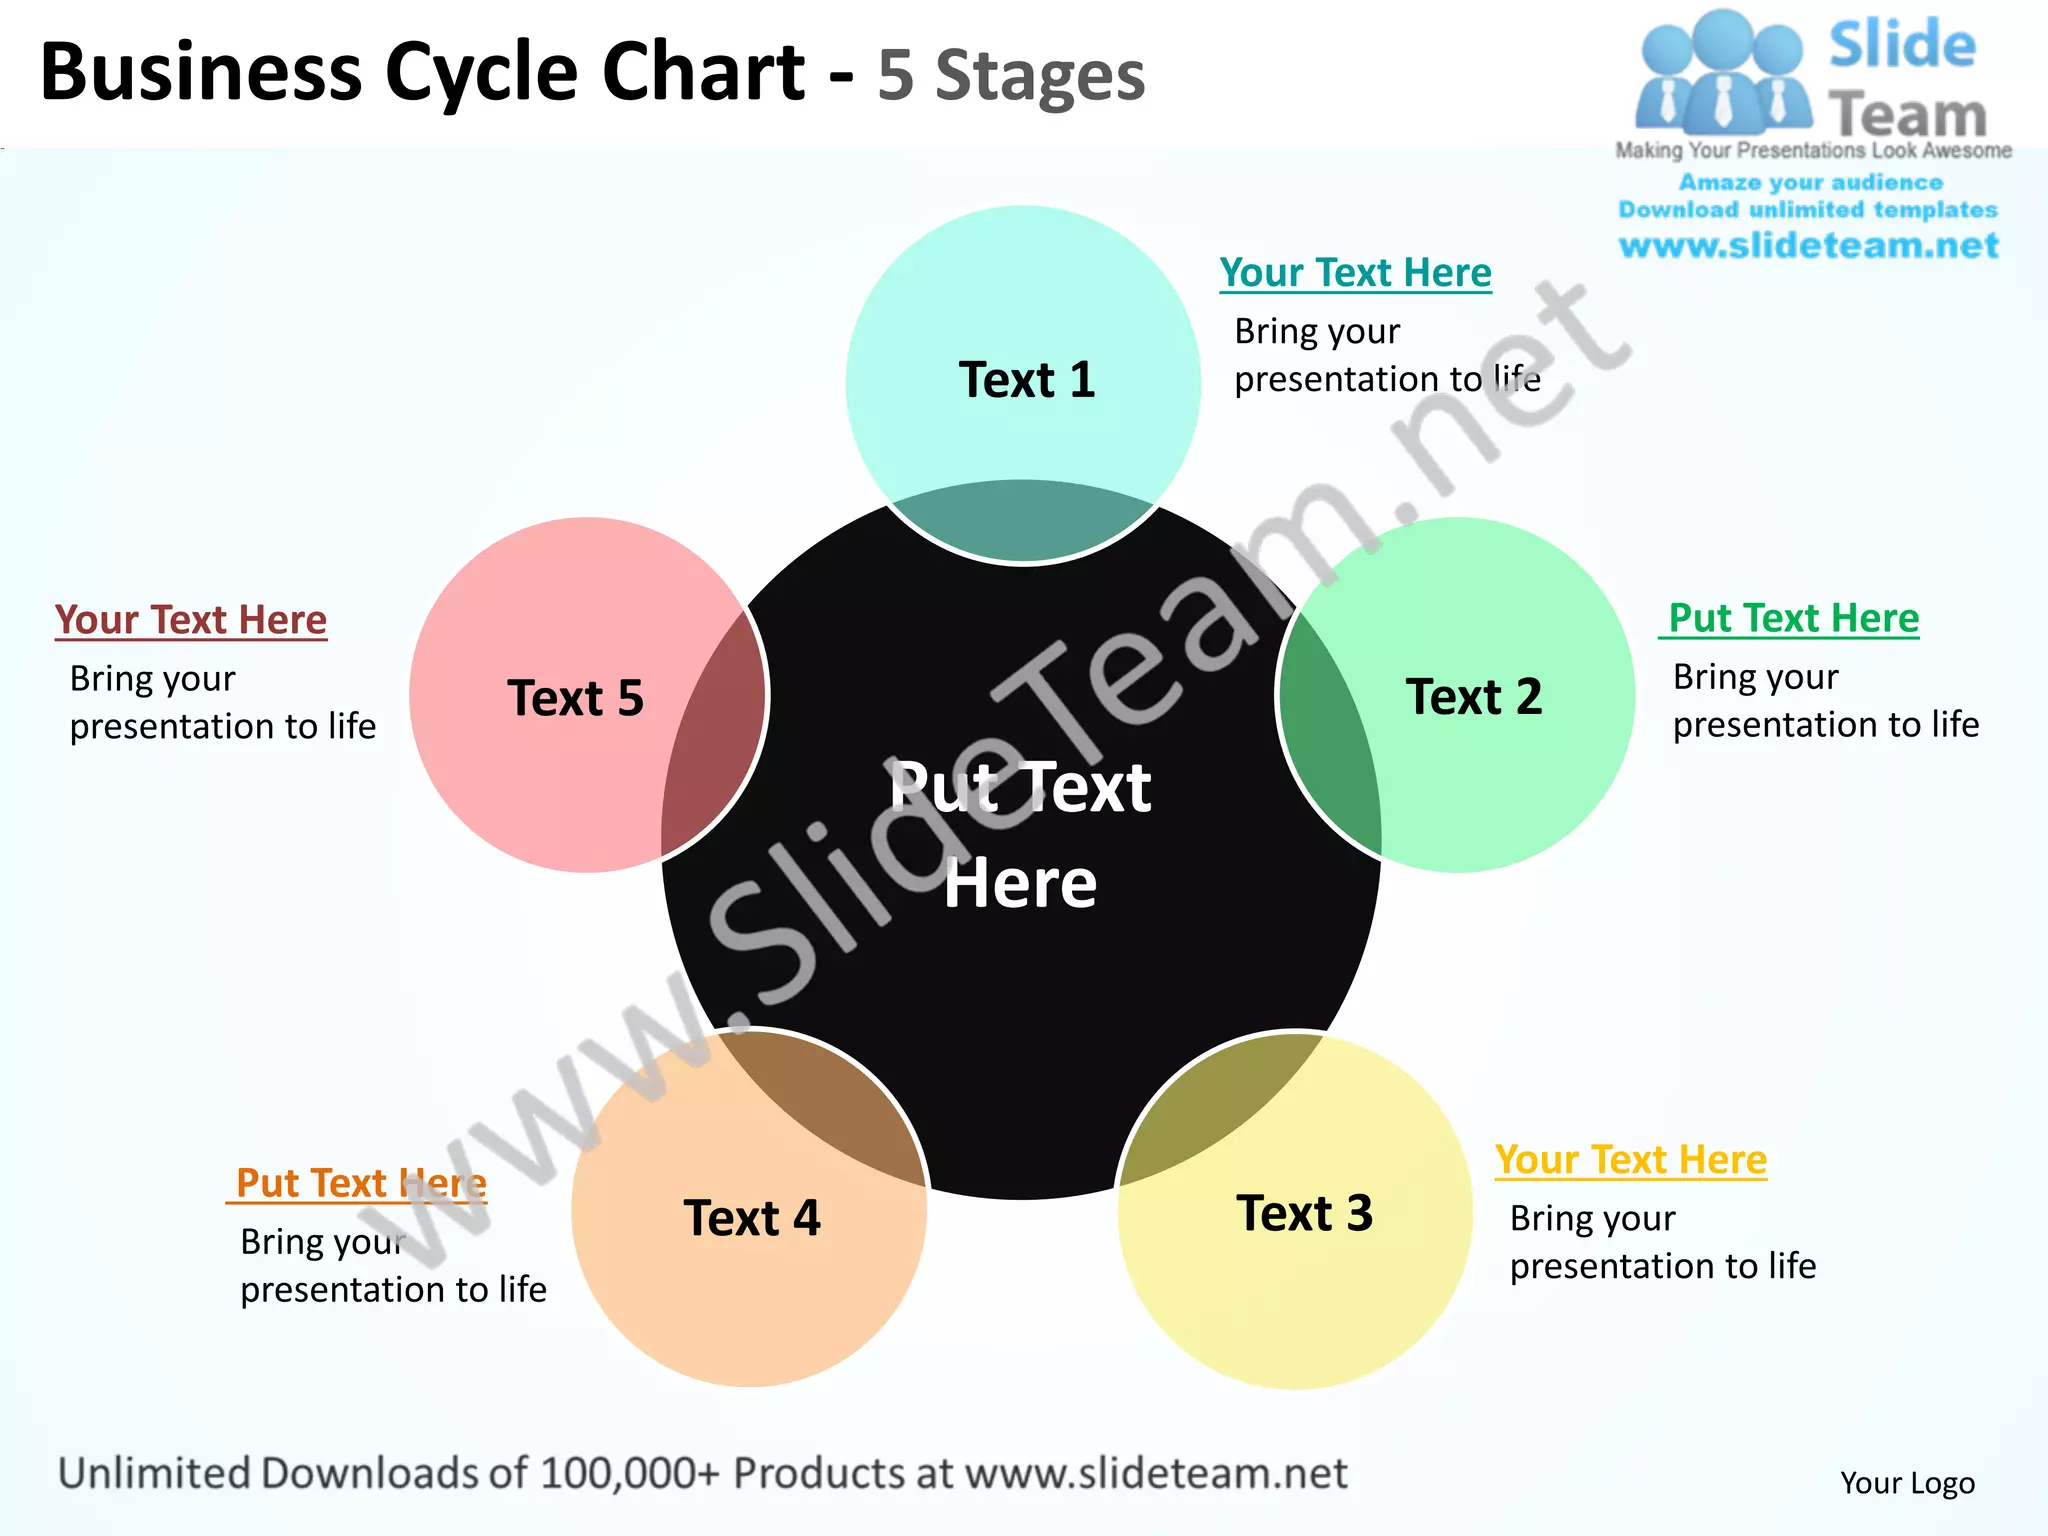
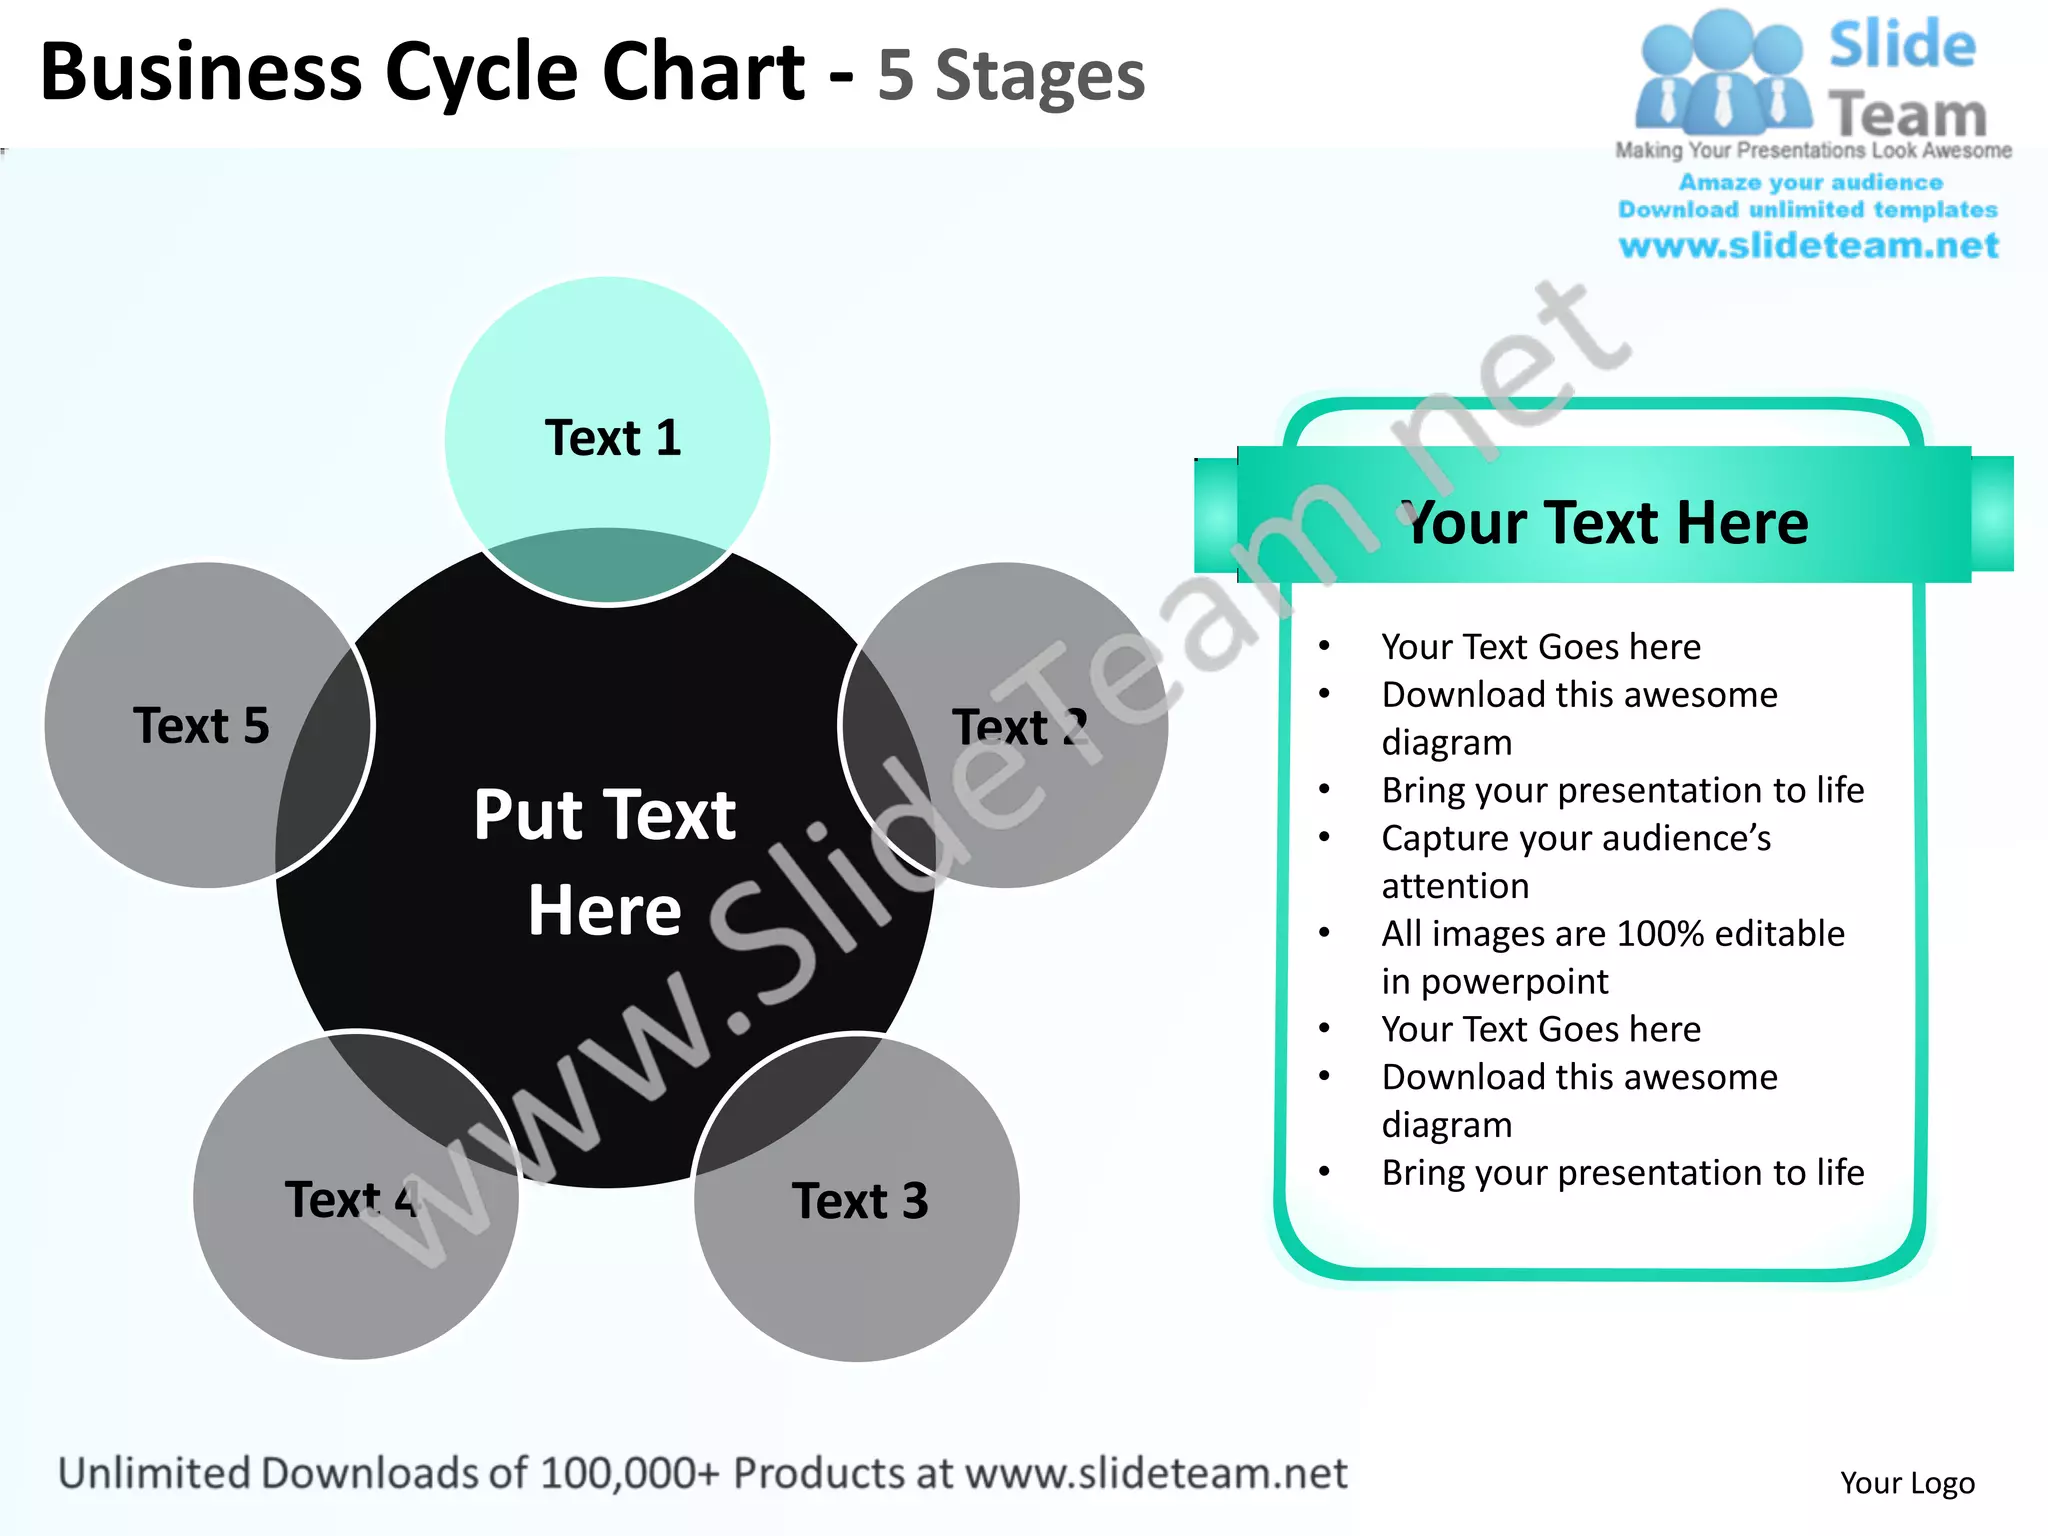
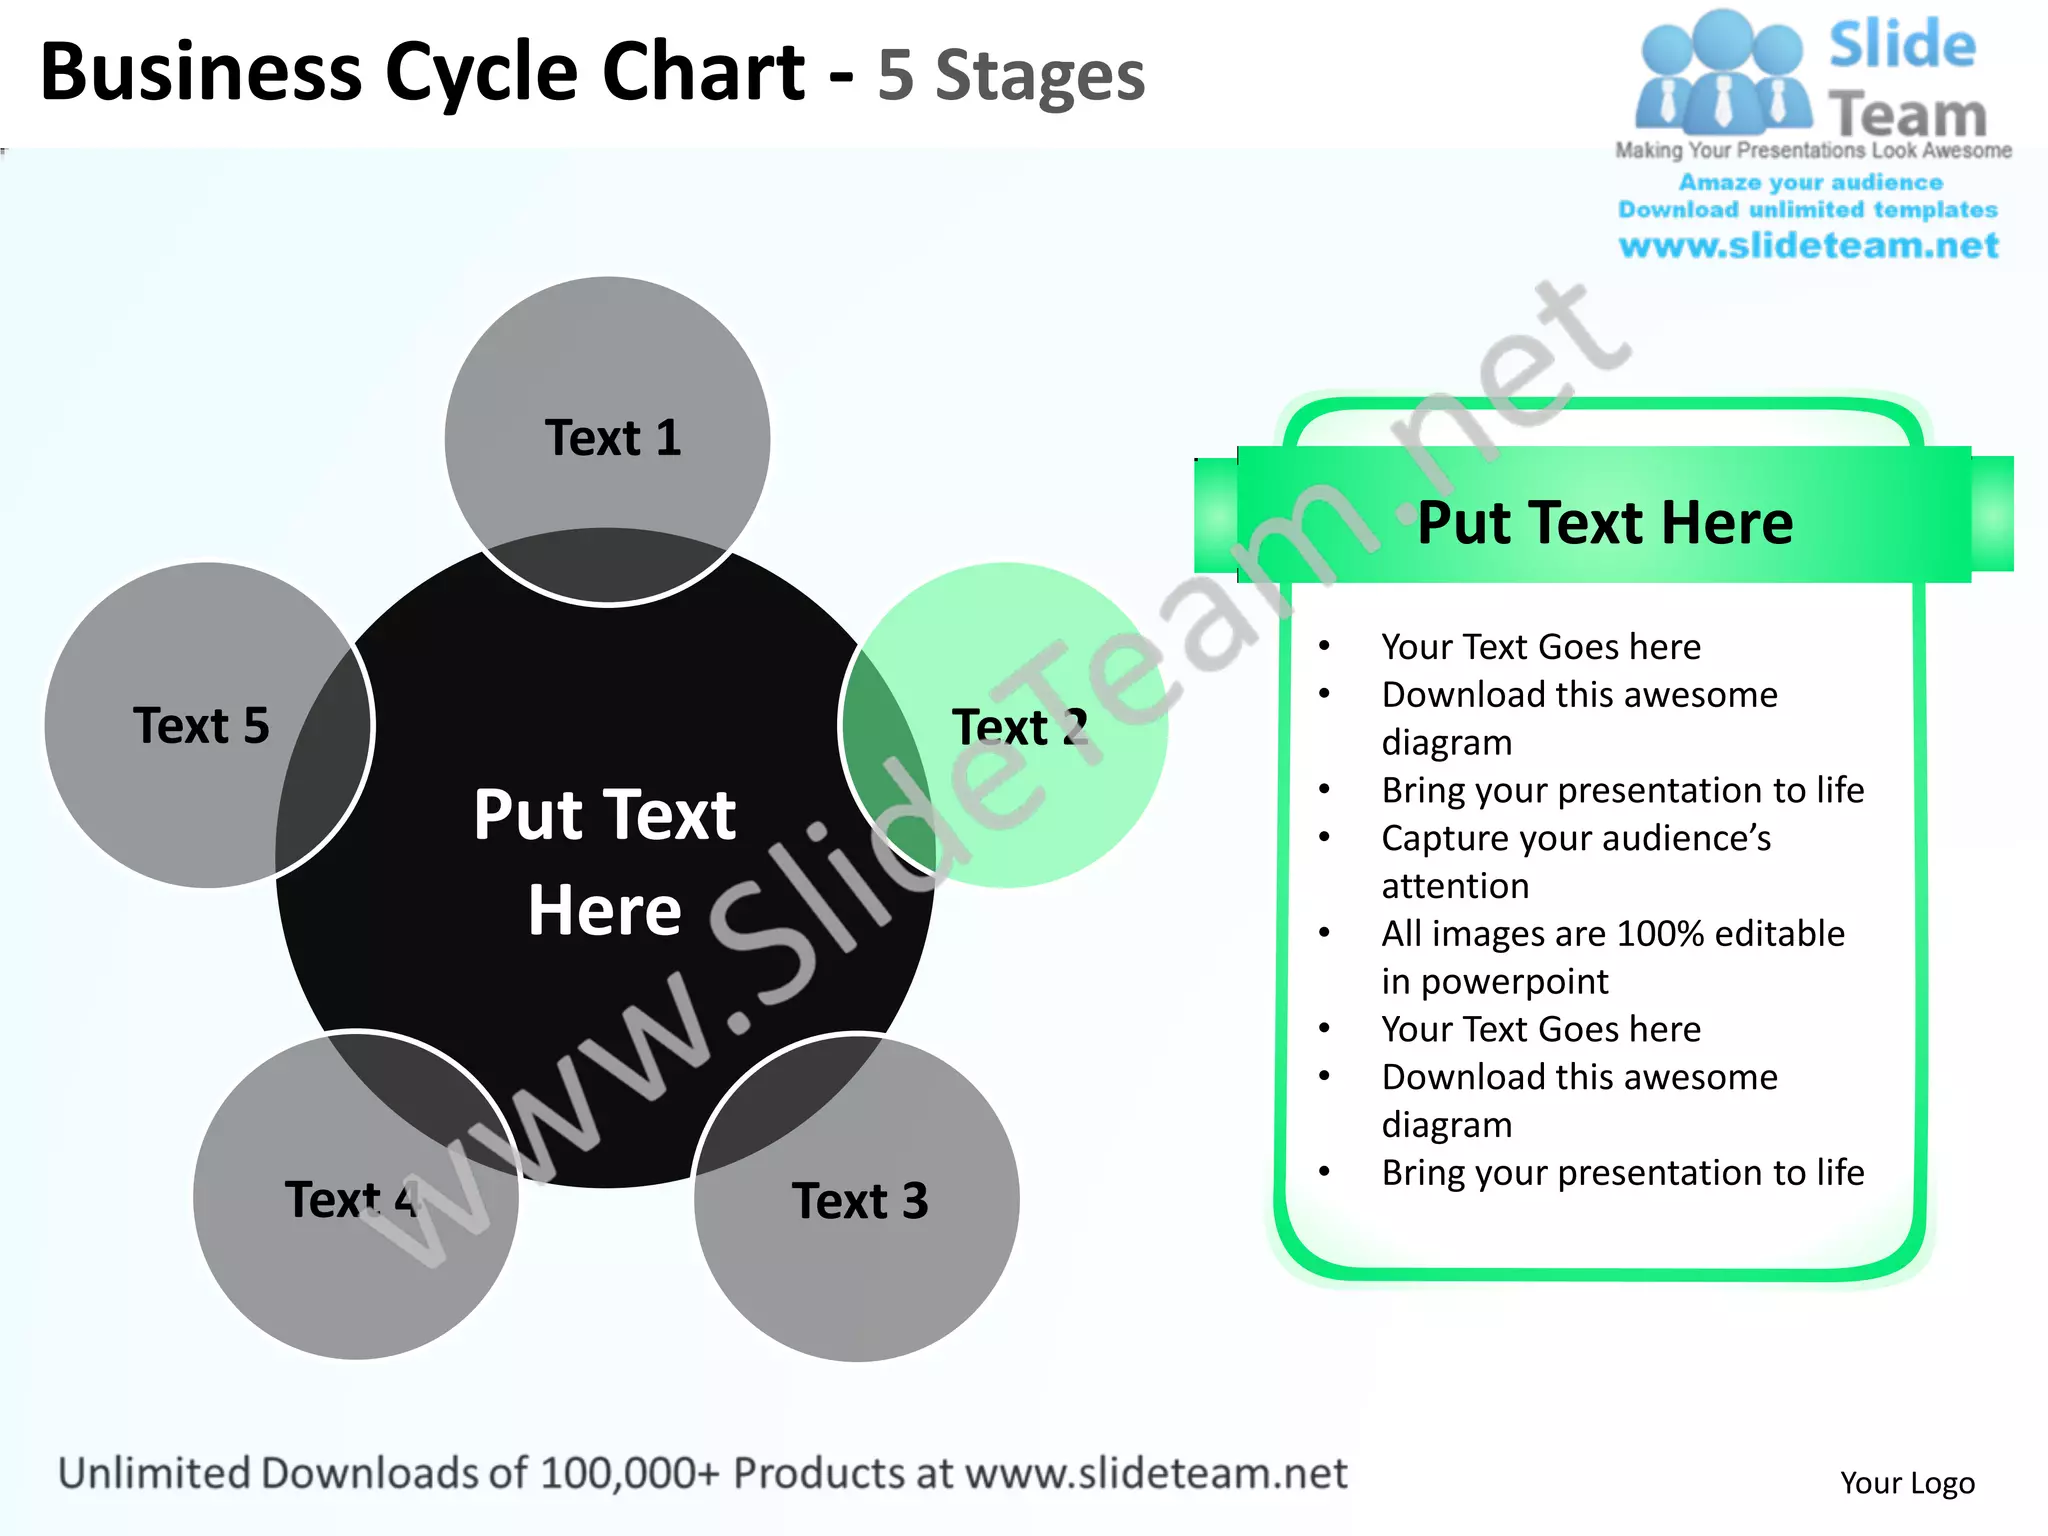
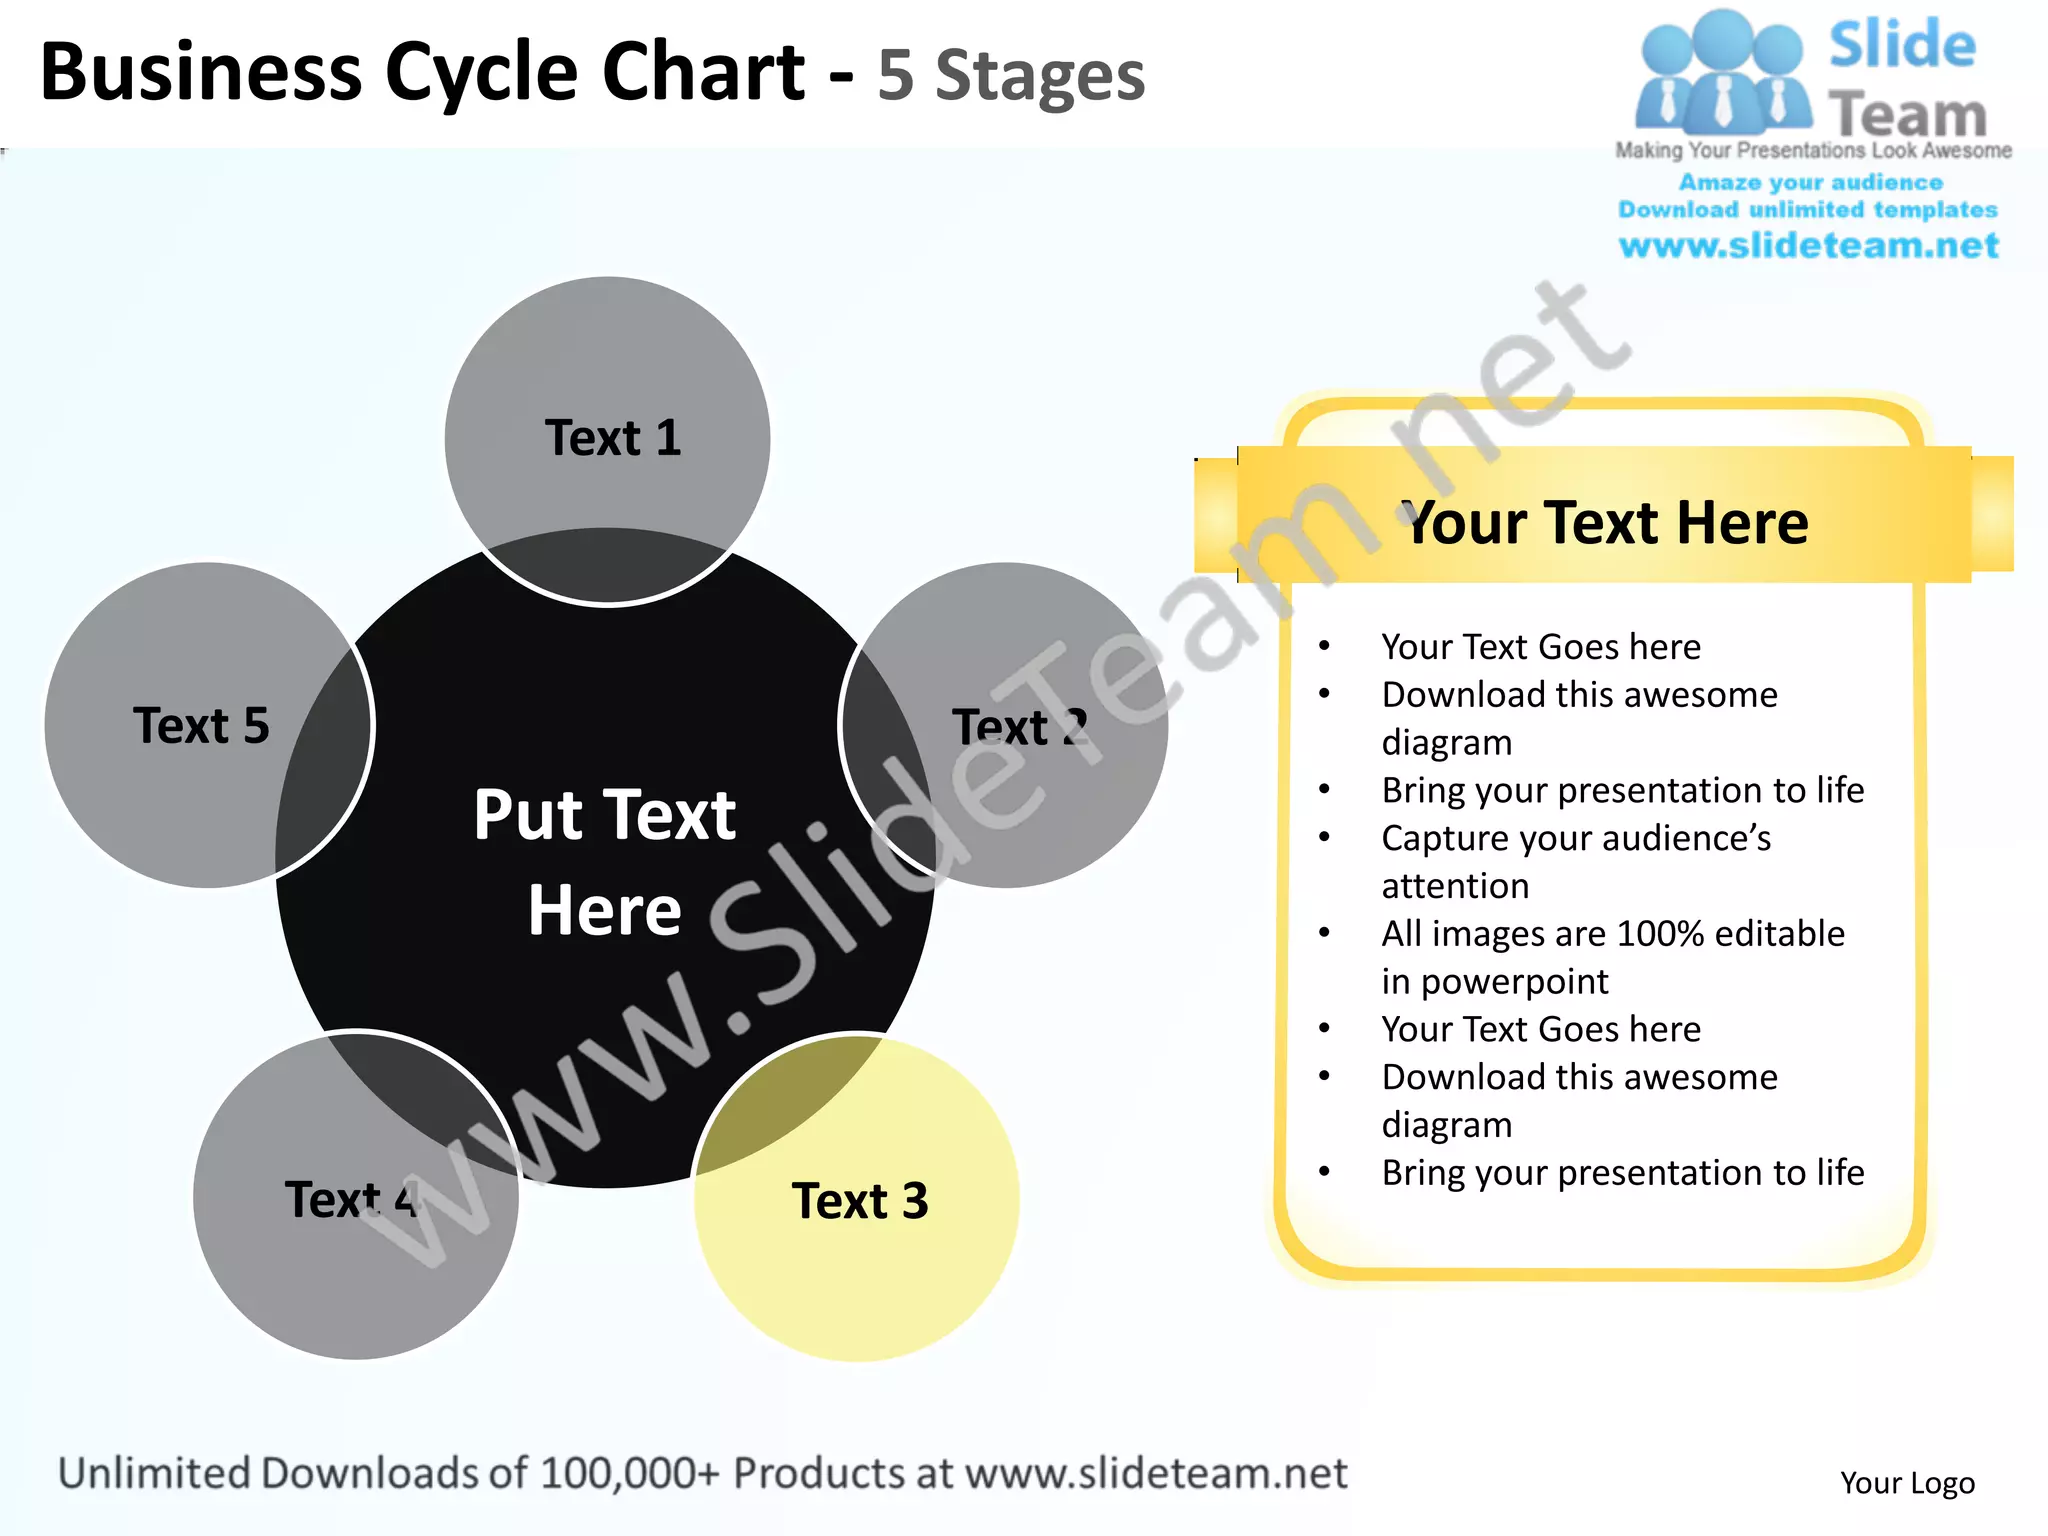
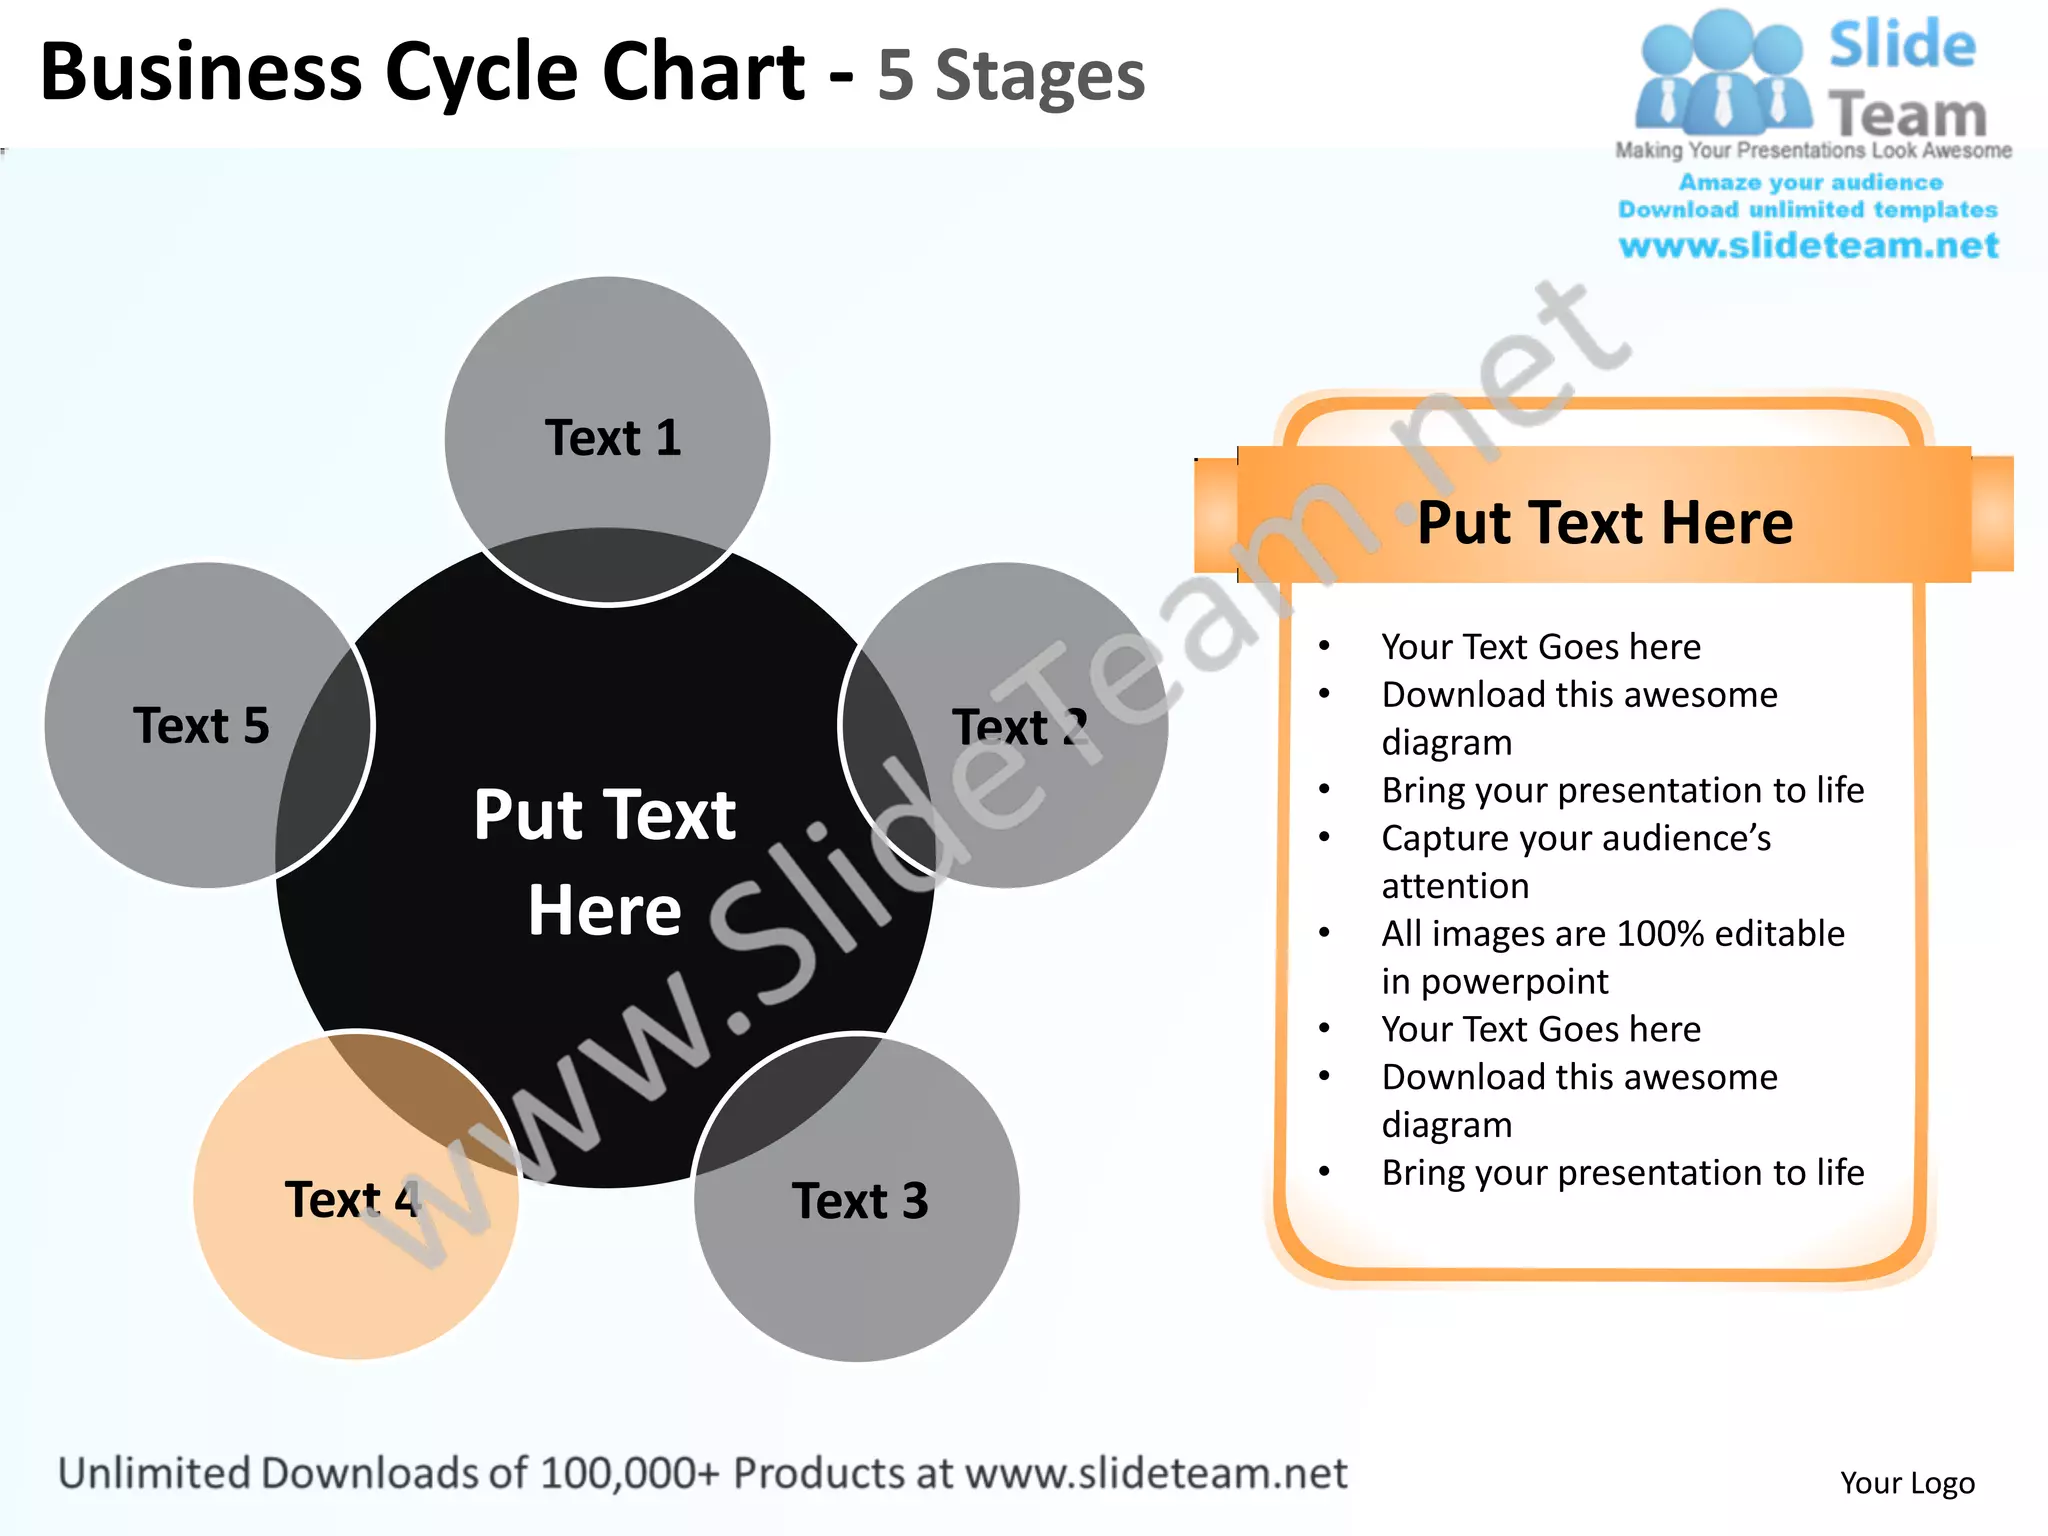
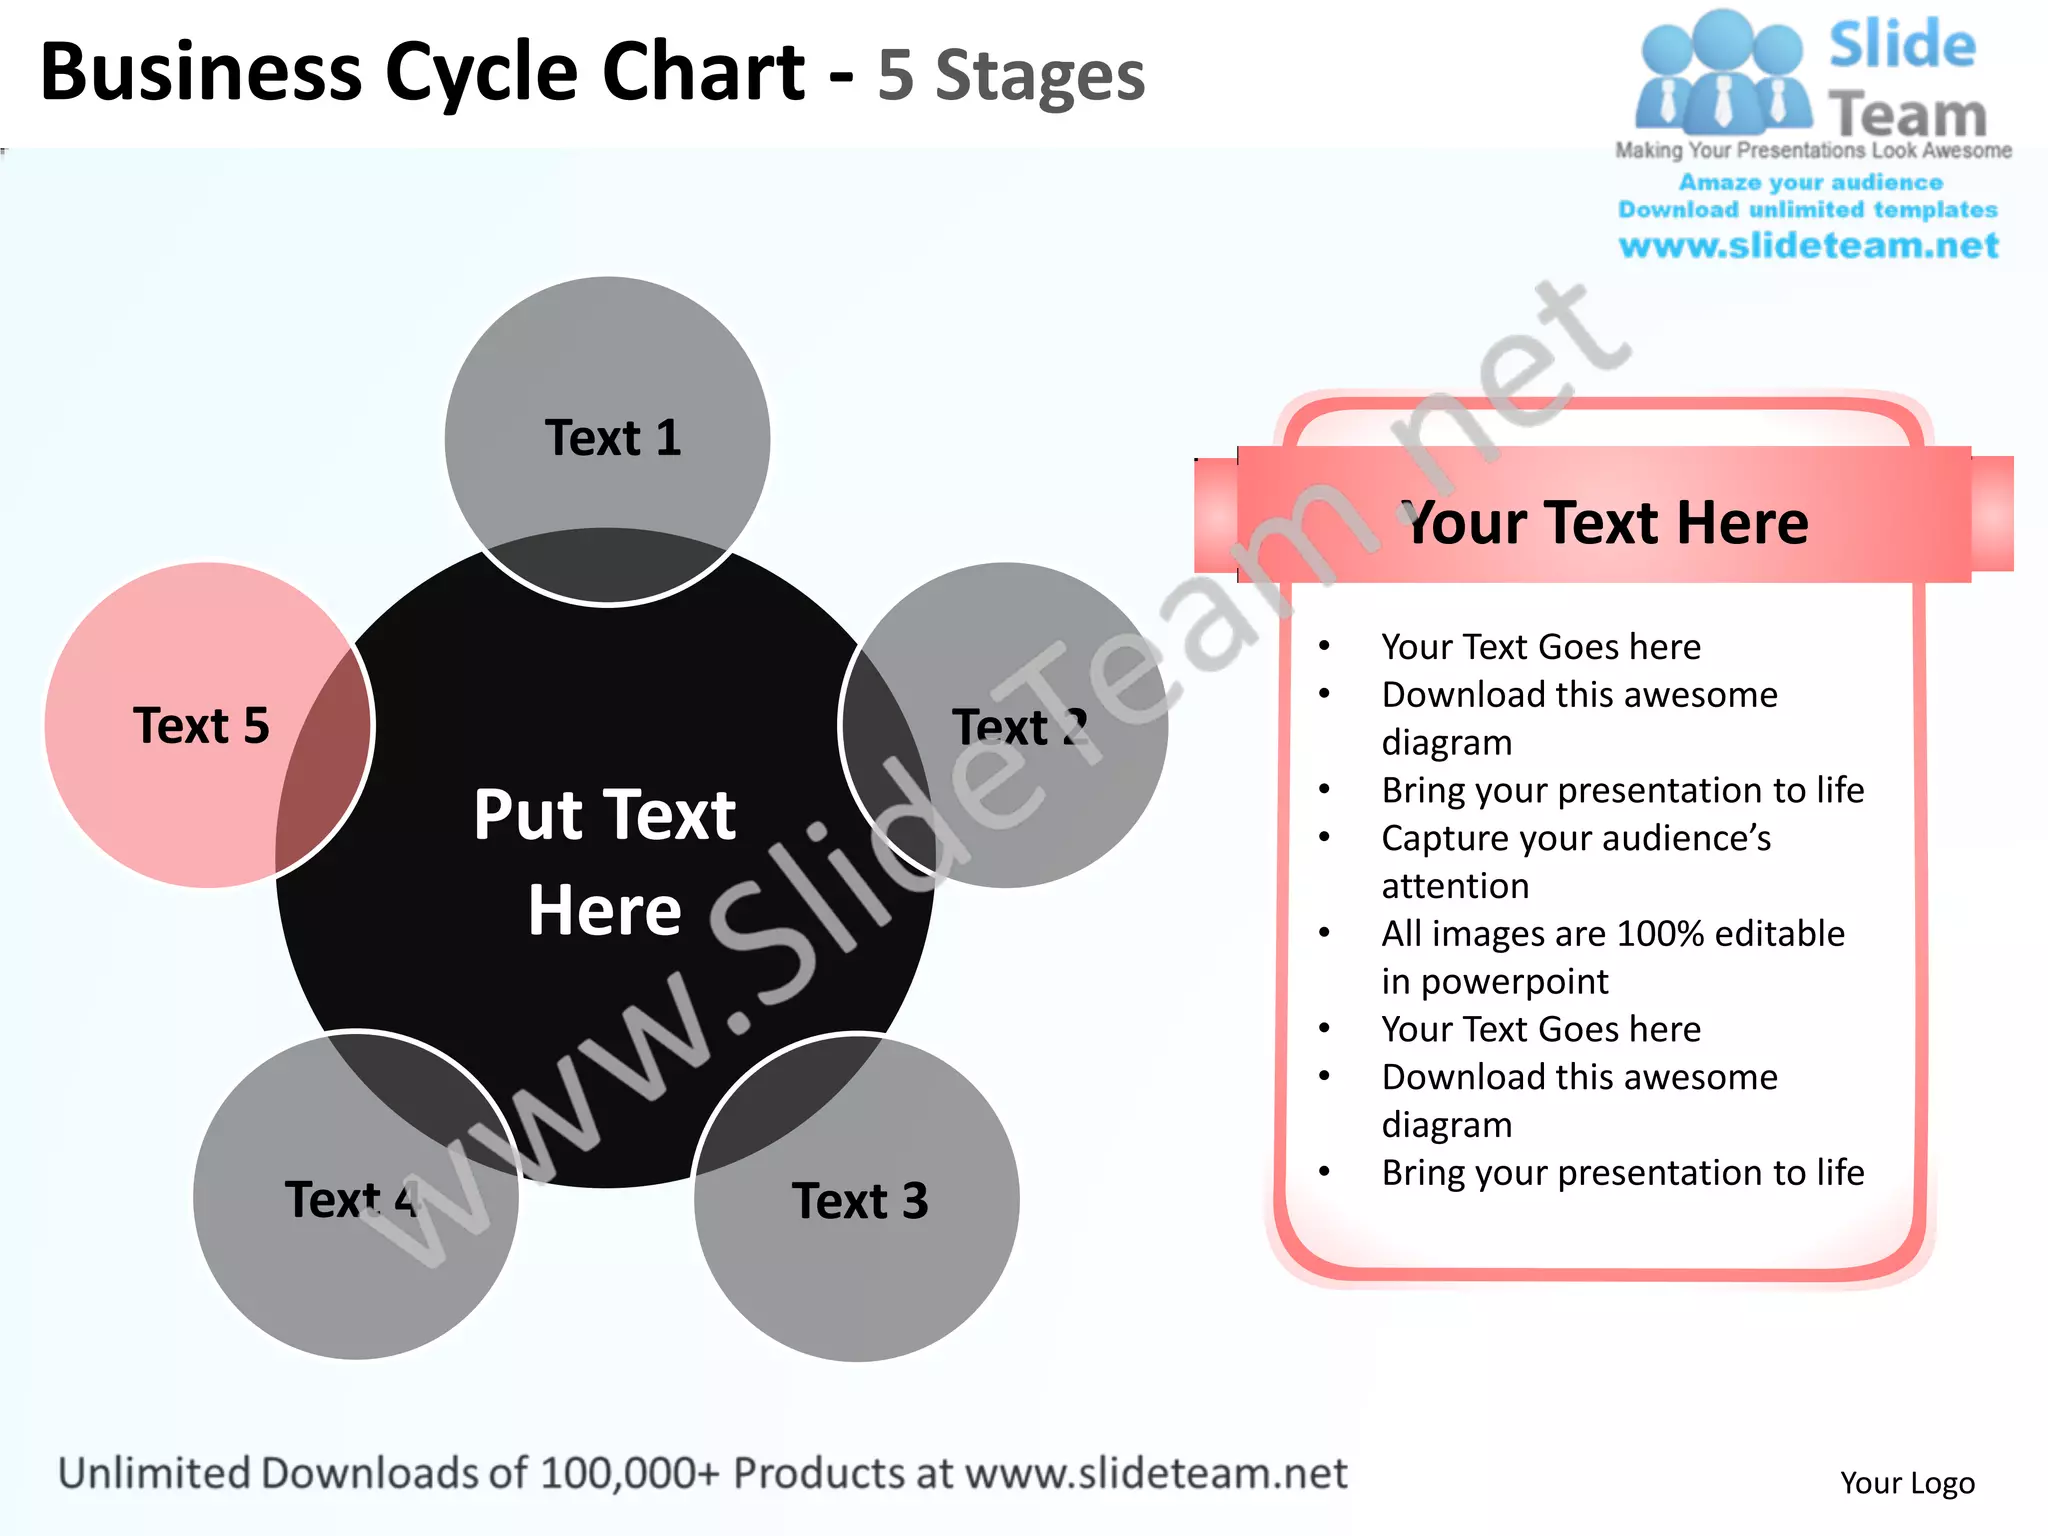
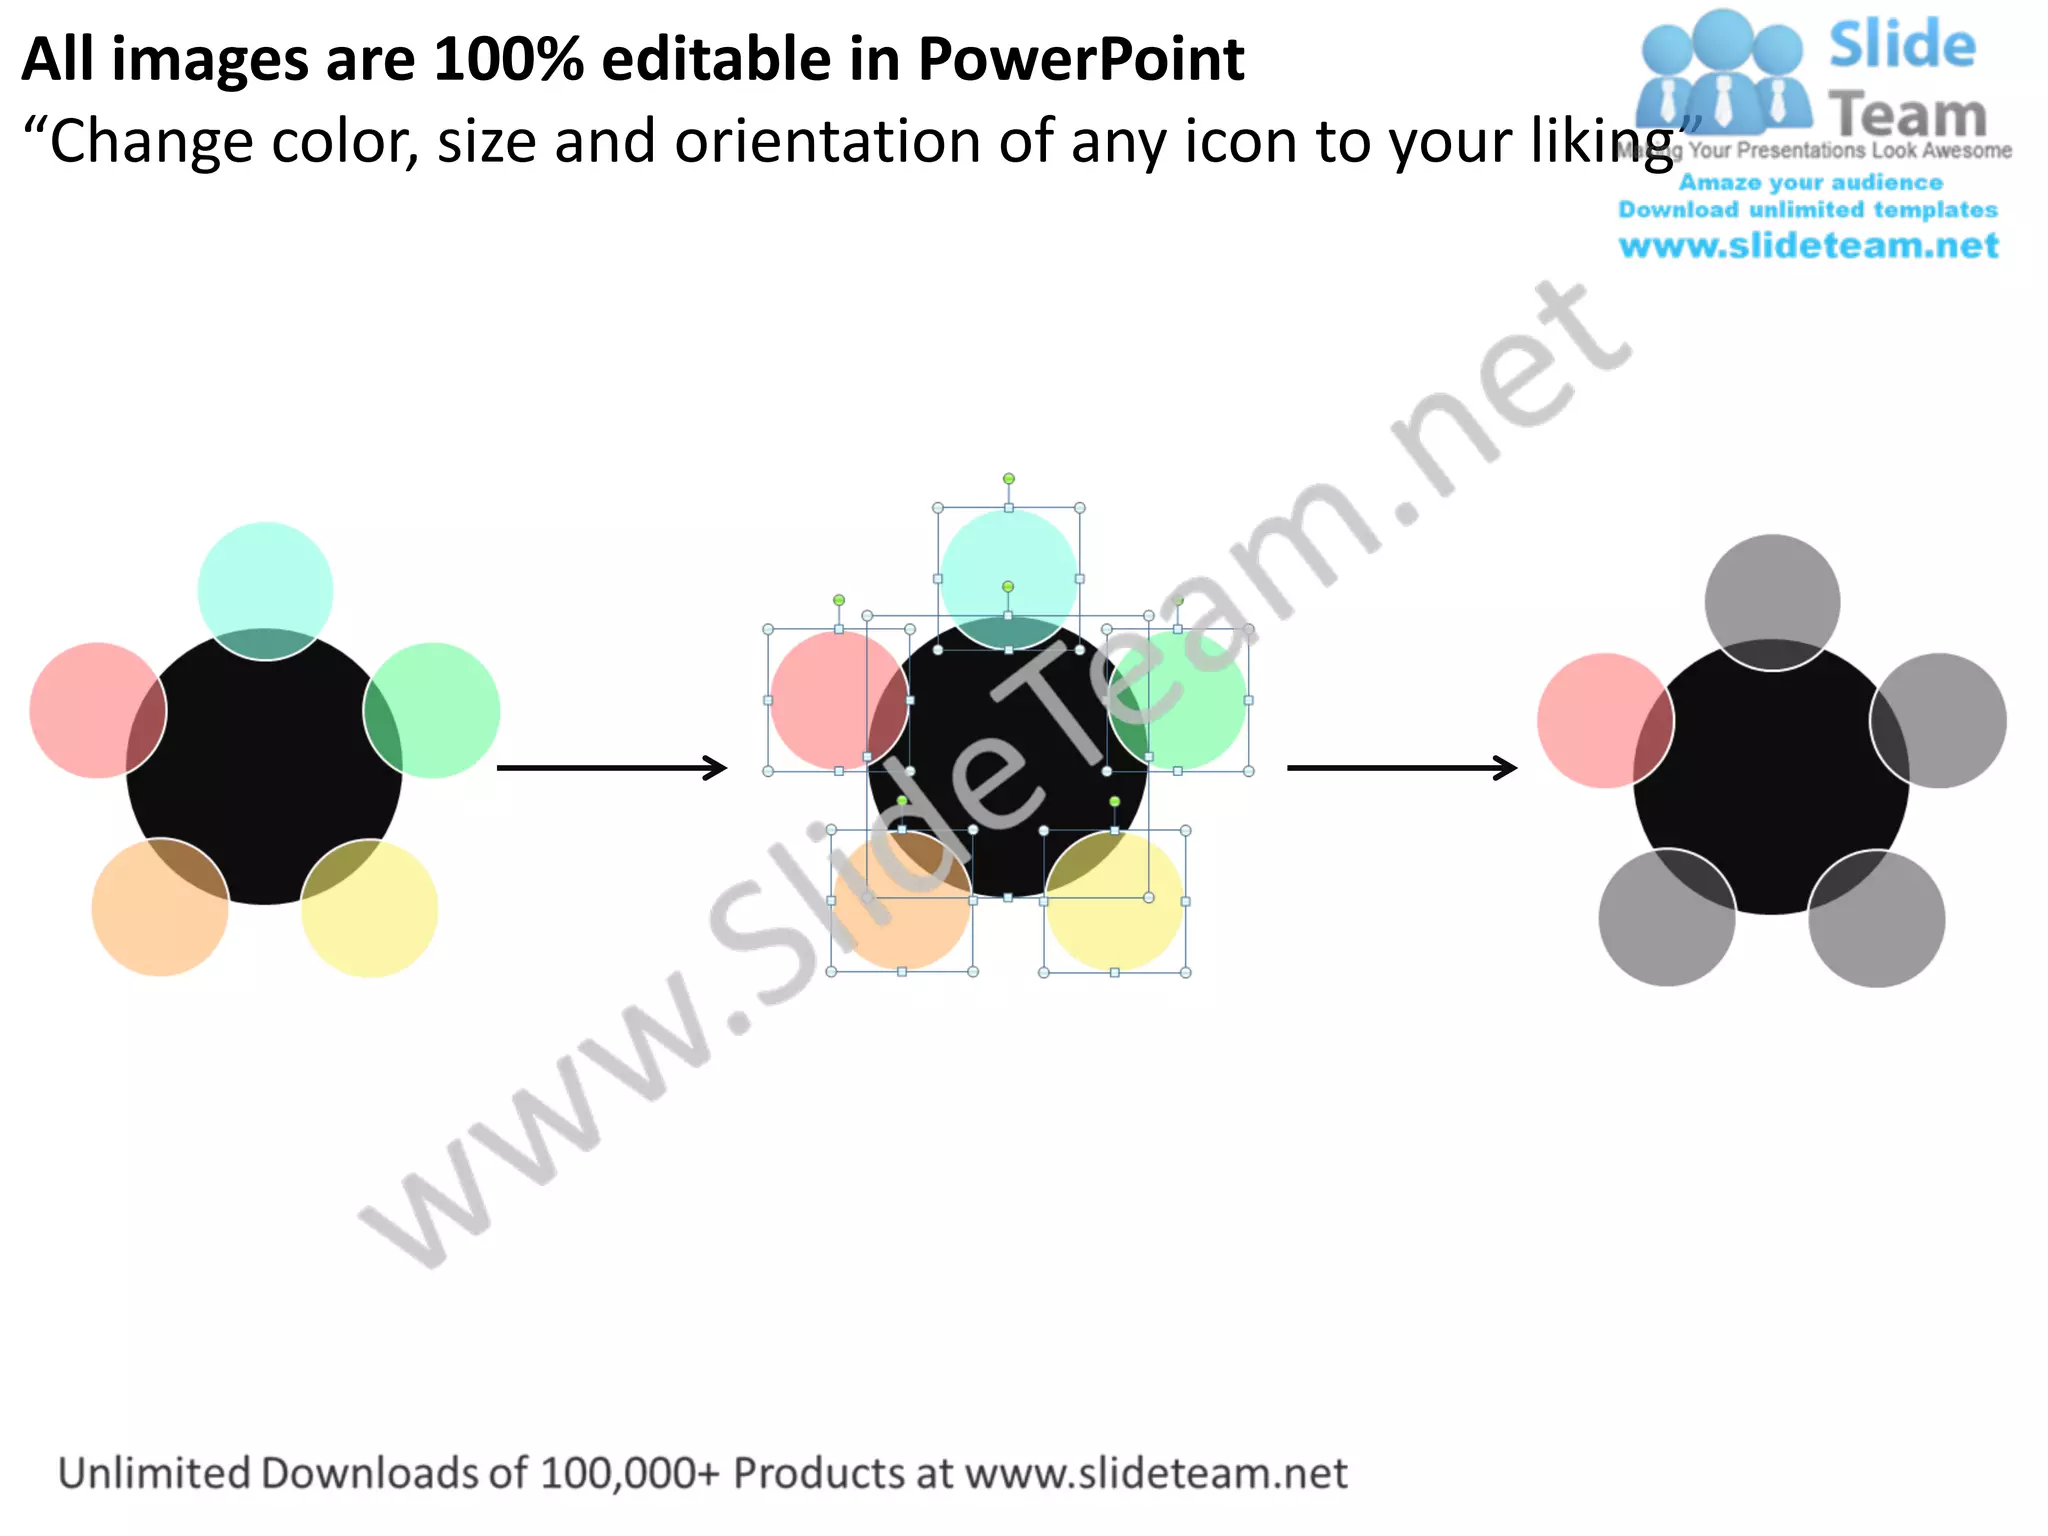
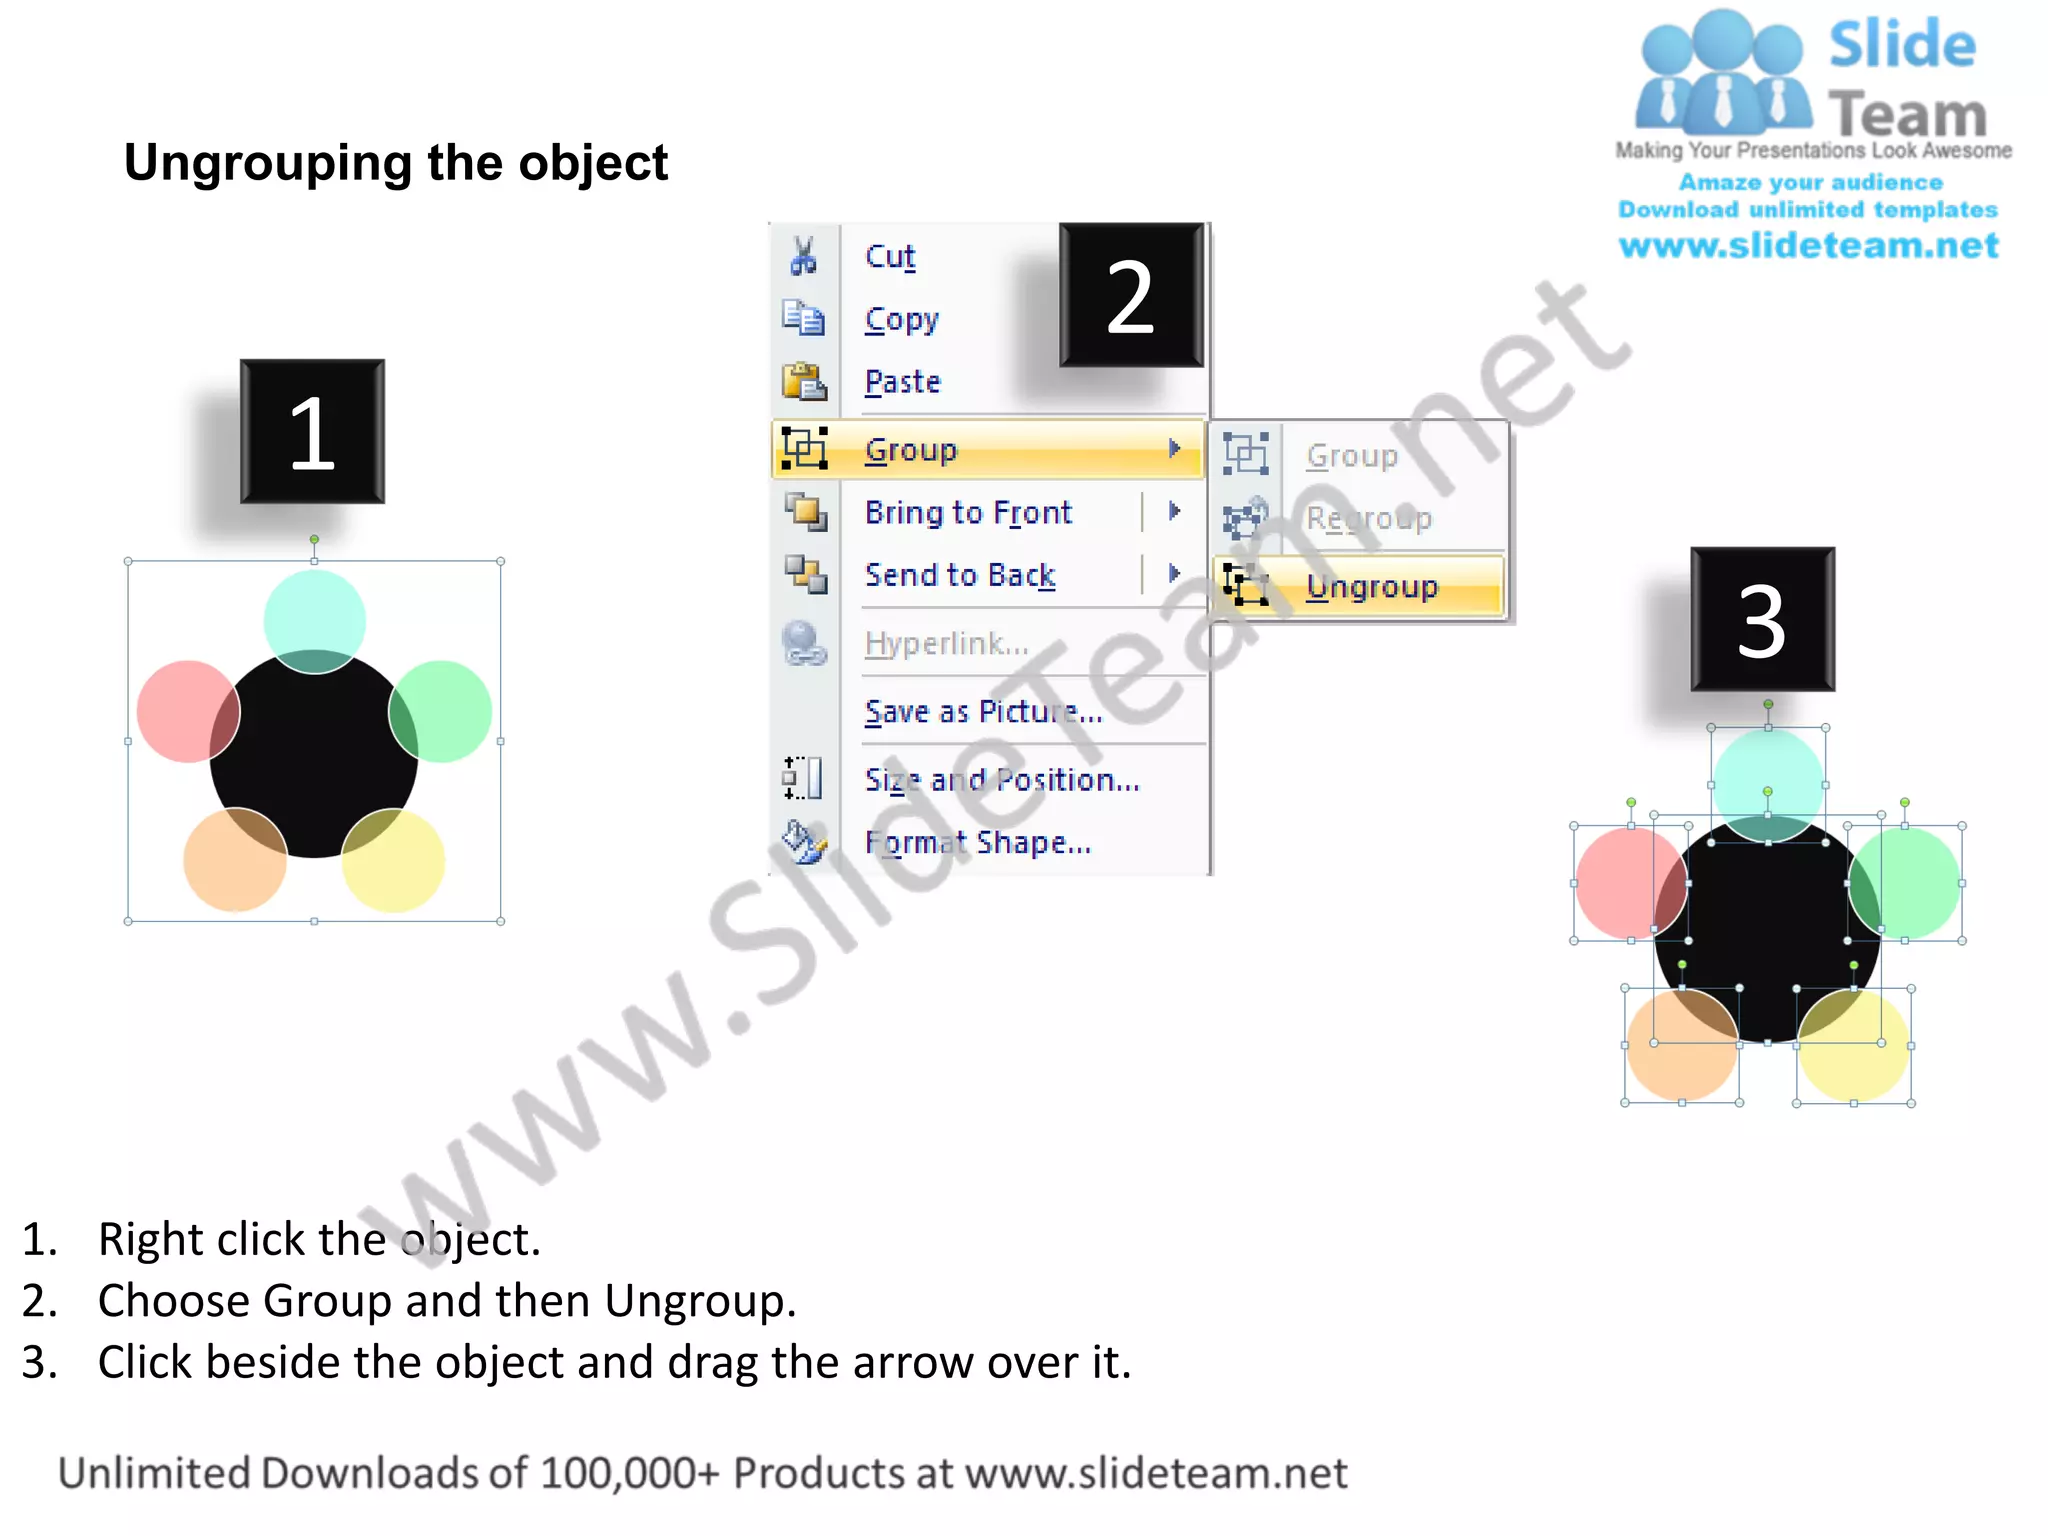
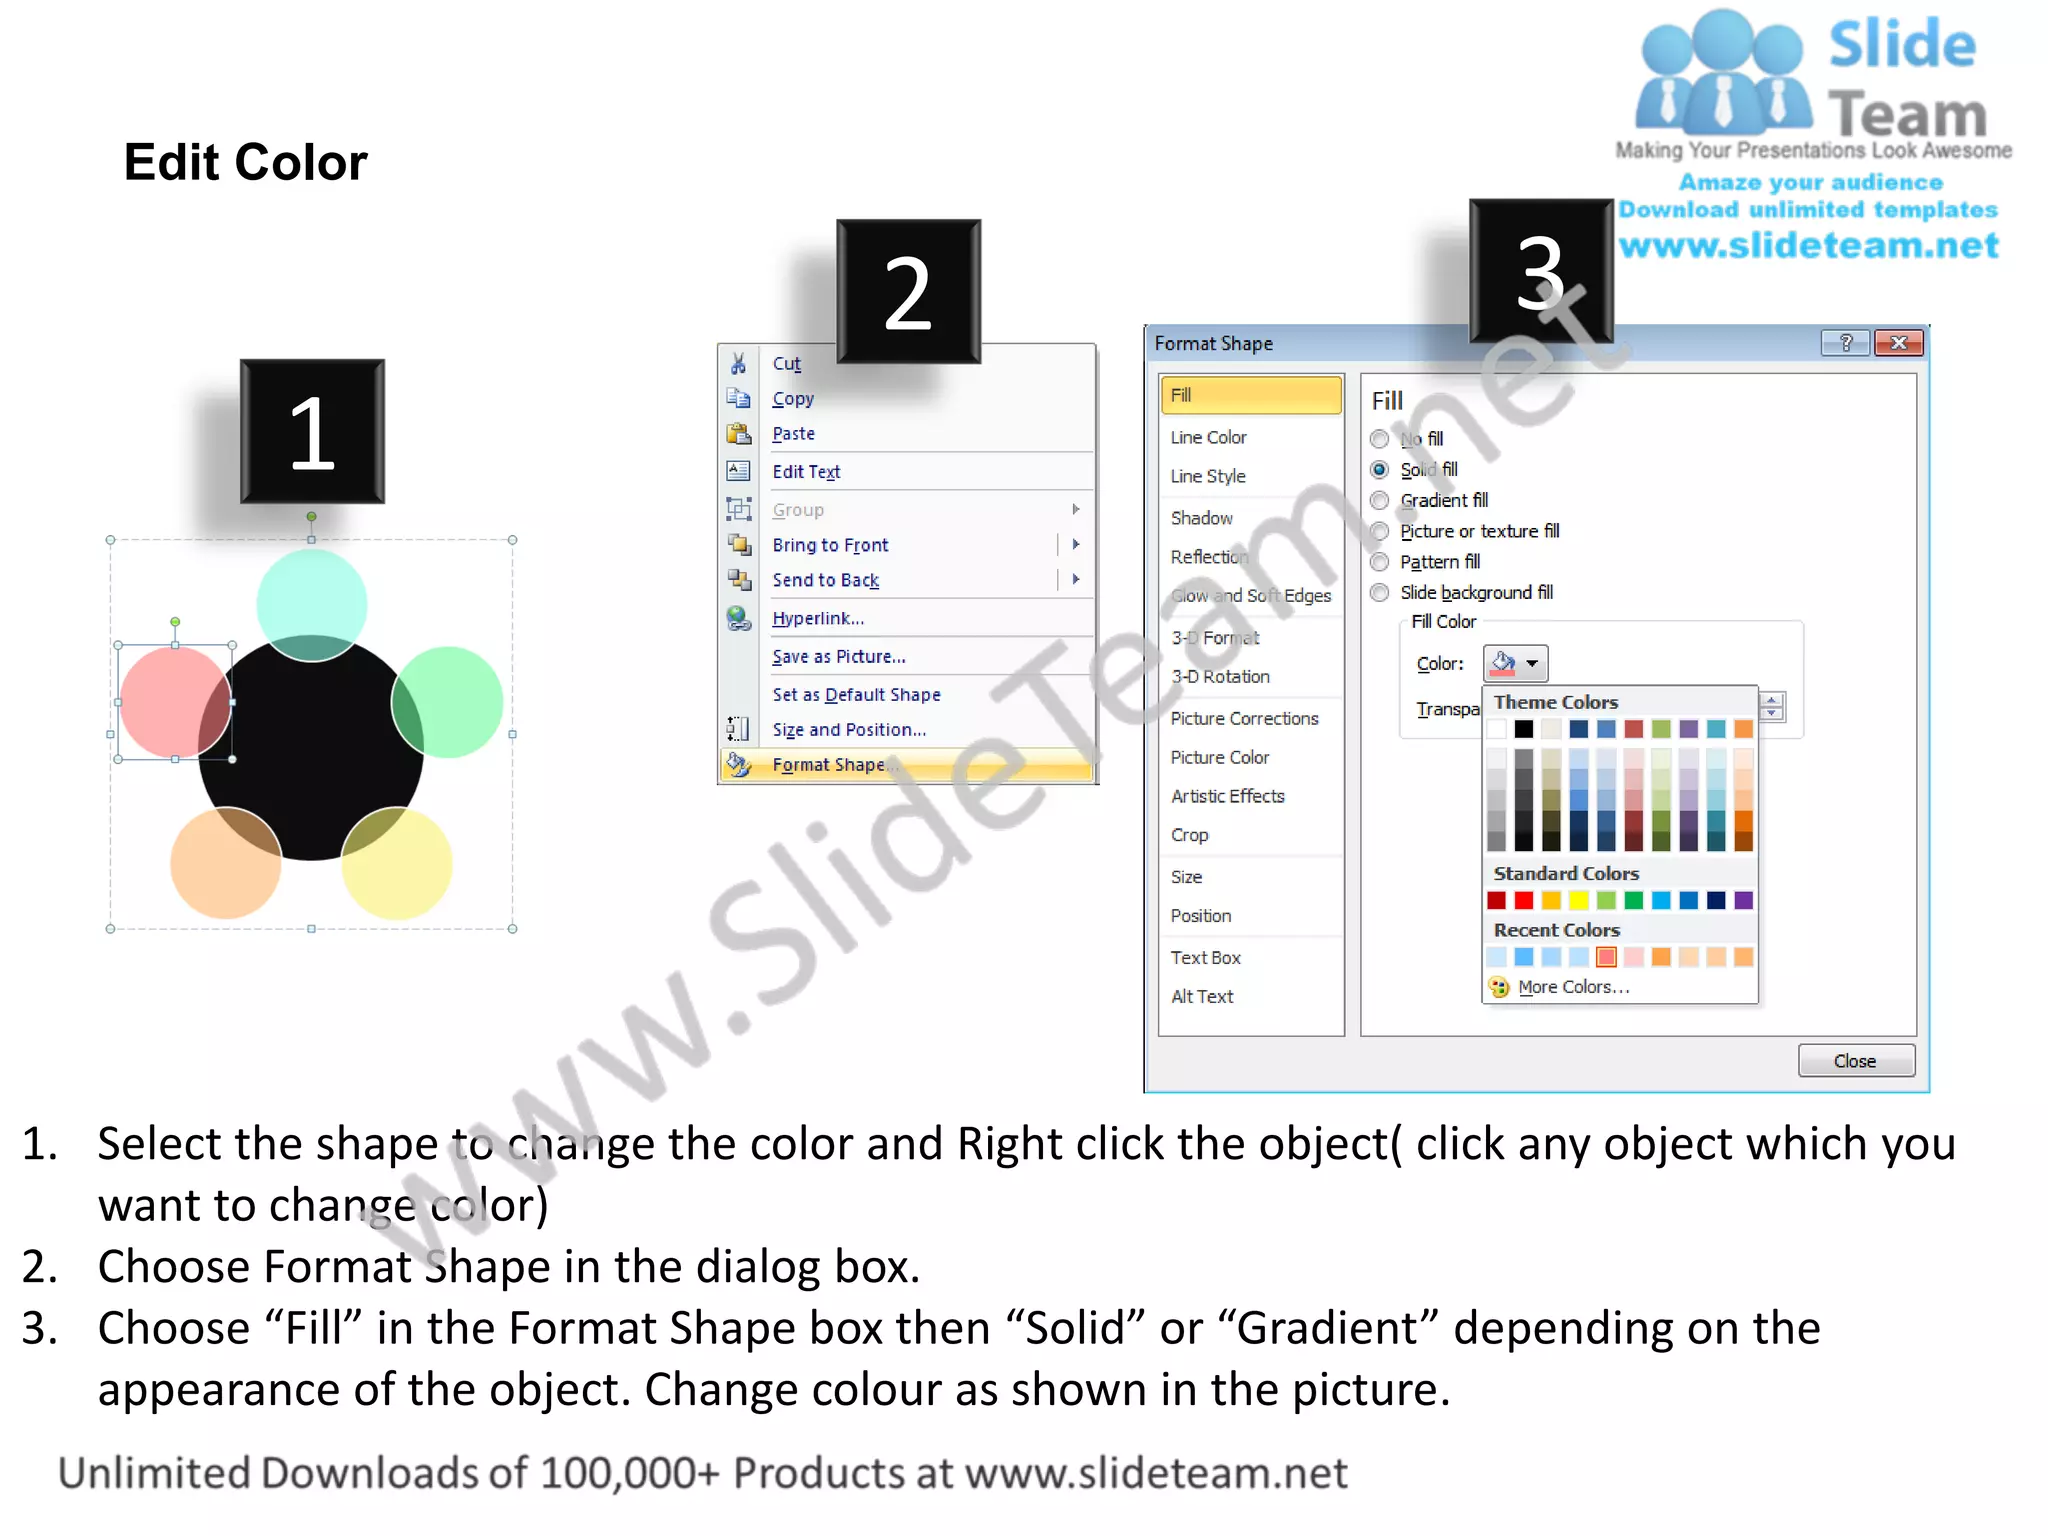

The document describes a business cycle chart with 5 stages represented by text boxes. It includes instructions on how to edit the icons in PowerPoint, including ungrouping objects, changing colors, and resizing or reorienting icons. The goal is to allow customization of the chart for presentations to engage audiences.


