
Recommended
Recommended
More Related Content
Similar to BUS520 Module 3 SLP AssignmentSummary of Raw Data for loca.docx
Similar to BUS520 Module 3 SLP AssignmentSummary of Raw Data for loca.docx (17)
More from RAHUL126667
More from RAHUL126667 (20)
Recently uploaded
Recently uploaded (20)
BUS520 Module 3 SLP AssignmentSummary of Raw Data for loca.docx
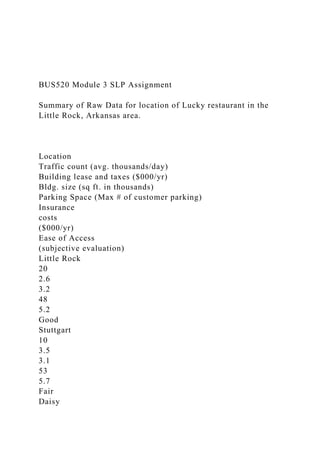
- 1. BUS520 Module 3 SLP Assignment Summary of Raw Data for location of Lucky restaurant in the Little Rock, Arkansas area. Location Traffic count (avg. thousands/day) Building lease and taxes ($000/yr) Bldg. size (sq ft. in thousands) Parking Space (Max # of customer parking) Insurance costs ($000/yr) Ease of Access (subjective evaluation) Little Rock 20 2.6 3.2 48 5.2 Good Stuttgart 10 3.5 3.1 53 5.7 Fair Daisy
- 7. VegasBamboo40639Q3WestSan DiegoBamboo48620Q3WestSeattleBamboo49160Q3WestDenver Oak39437Q3WestBoiseOak50513Q3WestLas VegasOak29282Q3WestSan DiegoOak36949Q3WestSeattleOak56607Q3WestDenverMahoga ny44819Q3WestBoiseMahogany26240Q3WestLas VegasMahogany47119Q3WestSan DiegoMahogany55748Q3WestSeattleMahogany39944 Assignment SLP part 1 Scenario: You are the lead consultant for the Diligent Consulting Group. It is mid-October. One of your top clients, Sunshine Floor Barn, has just closed the books for the first three quarters of the year (January through September). Sunshine Floor Barn requests that you analyze the sales performance of its 5 product lines over this 3-quarter period. From past consulting work you have done for the company, you know that Sunshine Floor Barn has 4 regions and 18 total store locations. Each Regional Manager at the company has compiled the data for his/her region. The raw data provided consists of the sales revenue for each of the 5 premium flooring lines for all 4 regions and 18 locations for the first three quarters of the current year. The data have been provided in list format. Generate a Pivot Table Report with Charts. Use the Pivot Table and Charts to analyze the data. Following your in-depth analysis of the data, write a report to Sunshine Floor Barn in which you discuss and analyze the data, and make appropriate recommendations relative to how Sunshine Floor Barn should improve its sales performance going forward. Provide accurate and complete Excel analysis (Pivot Table with Charts). Assignment SLP part 2 Written Report
- 8. Length requirement: 4–5 pages minimum (not including Cover and Reference pages). NOTE: You must have 4–5 pages of written discussion and analysis. · Using the Pivot Table and Pivot Charts, discuss and analyze the data, noting key highs and lows, trends, etc. · Include charts from your Pivot Table to support your written analysis. (Please do not use charts as “space fillers.” Instead, use them strategically to support your written analysis.) · In a “Recommendations” section, give clear, specific, and meaningful recommendations that Sunshine Floor Barn should use to improve overall company sales. · Be sure to consider highs, lows, and trends in the data. Which cities are the highest performers? Lowest? Which regions and quarter had the highest sales? Lowest sales? Consider what may be driving the numbers: Poor marketing? Outstanding marketing strategies? Inventory management? Seasonal sales? Other? There are innumerable possibilities. Your role is to reflect on the data, and ultimately, to use the data to give useful recommendations. · Avoid redundancy and general statements Assignment SLP part 1 Scenario: Assumed Certainty: Multi-Attribute Decision Making (MADM) Scenario: You are the Vice President of Franchise Services for the Lucky restaurant chain. You have been assigned the task of evaluating the best location for a new Lucky restaurant. The CFO has provided you with a template that includes 6 criteria (attributes) that you are required to use in your evaluation of 5 recommended locations. Following are the 6 criteria that you will use to evaluate this decision:
- 9. Traffic counts (avg. thousands/day)—the more traffic, the more customers, and the greater the potential sales. Building lease and taxes (thousands $ per year)—the lower the building lease and taxes, the better. Size of building (square feet in thousands)—a larger building is more preferable. Parking spaces (max number of customers parking)—more customer parking is preferable. Insurance costs (thousands $ per year)—lower insurance costs are preferable. Ease of access (subjective evaluation from observation)—you will need to “code” the subjective data. Use Excellent = 4, Good = 3, Fair = 2, and Poor = 1. Now that you have collected the data from various sources (your CFO and COO, local real estate listings, personal observation, etc.), you have all the data you need to complete an analysis for choosing the best location. Review the information and data regarding the different alternatives for a new restaurant location. Then do the following in Excel: Table 1: Develop an MADM table with the raw data. Table 2: Convert the raw data to utilities (scaled on 0 to 1). Show the utility weights in a second table. Table 3: Develop a third table with even weights (16.7%) for each variable.
- 10. Evaluate Table 3 for the best alternative. Table 4: Complete a sensitivity analysis by assigning weights to each variable. In a Word document, do the following: Discuss the process used to put together Tables 1–4 above. Provide the rationale you used for choosing for each of the weights you used in Table 4. Give your recommendation of which location the company should choose (based on results of Table 4). Assignment SLP part 2 Written Report Length requirement: 4–5 pages minimum (not including Cover and Reference pages). NOTE: You must have 4–5 pages of written discussion and analysis. Excel Analysis Complete Excel analysis using MADM (all four tables noted above must be included). Accurate Excel analysis (Excel file includes working formulas showing your calculations; all calculations and results must be accurate). · Provide a brief introduction to/background of the problem. · Discuss the steps you used to compile the Excel analysis (i.e., the four tables). · Discuss the assumptions used to assign weights to each variable of your sensitivity analysis (Table 4). That is, provide the rationale for your choice of weights for each variable. · Provide a complete and meaningful recommendation related to the location that should be chosen as a new site. · Avoid redundancy and general statements