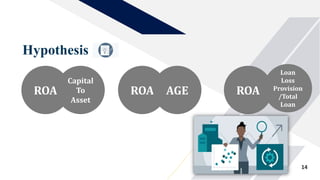
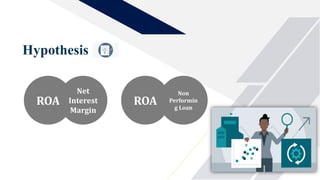
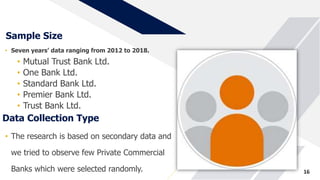
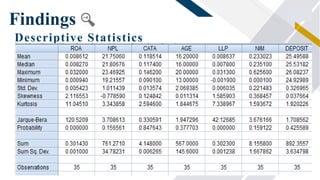
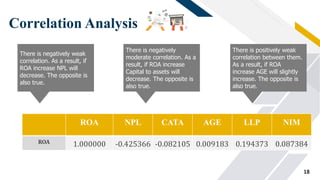
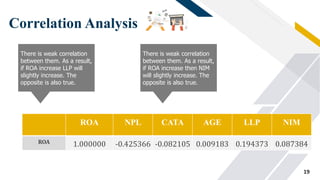
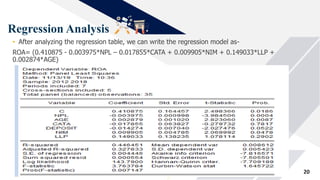
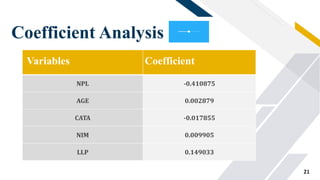
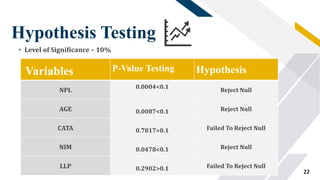
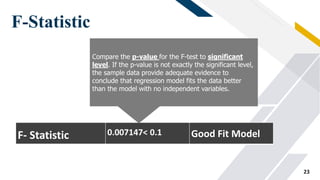
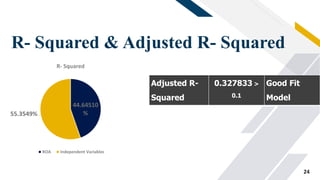
2. Submitted By
Team Vision
MD. Shadman Shakib Shawon –1620032
Israt Jahan –1621160
Sadaf Bin Hossain –1620287
Jihan Mubtasim Tamim –1621484
MD. Matiur Rahman Ridoy -1530674
3. Bangladesh Bank
• Established in 16 December, 1971
controlling money supply and monetary
policy of our country with a current reserve
of 2.565 trillion bdt which is around US $30
billion
• Commercial Banks- 5 State Owned 31
Private & 9 Foreign Commercial Banks.
• 8 Private Islamic Banks & 11 other Specialized
Banks
3
4. Problem Statement.
Problems that whole banking sector
facing
• Scandals- directors are involving themselves on
underhand.
• Unhealthy Competitors- Healthy banks are
aggressively competing more over weaken banks .
• Regulatory Challenges- The new problem in
the market that banks are facing is BASEL II &
Automated Clearing House
4
5. Problems that state owned banks facing
• Quality Management- Government banks management
appeal as low as and poorer than private banks.
• NPL or Defaulters- The largest banking scandal between
2010-12 happened by sonali bank (SOCBs) due to illegal
money transfer.
• Low Security Management- Bad structured all are causes
of lack of security which becoming threatening to the public
day by day.
• IT Sector- Most of the time they are failed to meet with
customer’s requirement.
5
6. Problems that Private Commercial Banks
Faces
• Shareholder Losses- The share price start getting lower,
investors gets less motive to invest .
• Rate or Loans- Peoples are getting less attractive to obtain
loans from private sector than public.
• Profitability- Private commercial banks are always
concerns with profit. They may serving the public by their
activities but their main goals is to make profit.
• Corruption & Defaulters- Private commercial banks are
also involving them self on corruptions to gain advantage.
6
7. Islamic Banks Challenges
• Many people think non-Muslims can’t do Islamic banking,
however that is just a myth. As a result, Islamic banking is
getting less positive response from the foreign investors.
7
Foreign Commercial Banks Challenges
• They are advance, use high technologies and has different
service culture to serve the customers.
8. Literature Review
8
• According to Investopedia,
“Management’s most
important job is to make
good choices when
allocating its resources.
ROA
• Capital adequacy ratio is
calculated by dividing the
banks total capital by
banks risk weighted asset.
There are two category of
total capital of a bank,
Tier-1 capital and Tier-2
capital.
Capital
To
Asset
• The four directions
set limits (radical,
progressive, creative,
and intermediating)
on what will create
benefits in a business.
Age
9. Literature Review
9
• Estimate loan loss
provision ratio first, the
banks need to count the
loans that it cannot be
obtain from the borrowers
(NPL) then divide the
amount from the total
loans.
Loan
Loss
Provision
/Total
Loan
• (1) full installment of
principal and interest is
never anticipated, (2)
principal or interest is 90
days or increasingly delay,
or (3) the maturity date
has passed and
installment in full has not
been made.
Non
Performin
g Loan
• Net interest margin is a
ratio that measures how
successful a firm is at
investing its funds in
comparison to its
expenses on the same
investments.
Net
Interest
Margin
10. Methodology
Research Design & Approach
• Formal Study
• Statistical Study
• Cross Sectional Study
10
Method of Data Collection
• In this report, we have used monitoring method
for data collection. In monitoring data collection
method, we will observe financial data of the five
banks for last 7 years (2012-2018).
11. Purpose of the Study
• Our purpose of the study is causal-
explanatory because we are just not going to
look at the annual report.
11
Research Environment
• We are using simulation environment
because we are not going out to the field to
collect data and information.
12. Research Objective
• The nature and relationship between
profitability and Capital Adequacy Ratio, Net
Interest Margin, Non-Performing Loan, Loan
Loss Provision/ Total Loan, Age.
12
13. Conceptual Framework
• 𝒚=𝜶+𝜷₁𝒙₁+𝜷₂𝒙₂+𝜷₃𝒙₃+𝜷₄𝒙₄+𝜷₅𝒙₅+ ξ
• y = Dependent variable.
• X= Independent Variable.
• ξ =error item.
• α = Constant.
• β = Coefficient.
• x₁ = Non Performing Loan.
• x₂ = Capital to Total Asset.
• x₃ = Net Interest Margin.
• x₄ = Loan Loss Provision/ Total Loan.
• x₅ = Age.
13
16. Sample Size
• Seven years’ data ranging from 2012 to 2018.
• Mutual Trust Bank Ltd.
• One Bank Ltd.
• Standard Bank Ltd.
• Premier Bank Ltd.
• Trust Bank Ltd.
16
Data Collection Type
• The research is based on secondary data and
we tried to observe few Private Commercial
Banks which were selected randomly.
18. FR
Correlation Analysis
ROA NPL CATA AGE LLP NIM
ROA 1.000000 -0.425366 -0.082105 0.009183 0.194373 0.087384
18
There is negatively weak
correlation. As a result, if
ROA increase NPL will
decrease. The opposite is
also true.
There is negatively
moderate correlation. As a
result, if ROA increase
Capital to assets will
decrease. The opposite is
also true.
There is positively weak
correlation between them.
As a result, if ROA
increase AGE will slightly
increase. The opposite is
also true.
19. FR
Correlation Analysis
19
There is weak correlation
between them. As a result,
if ROA increase LLP will
slightly increase. The
opposite is also true.
There is weak correlation
between them. As a result,
if ROA increase then NIM
will slightly increase. The
opposite is also true.
ROA NPL CATA AGE LLP NIM
ROA 1.000000 -0.425366 -0.082105 0.009183 0.194373 0.087384
20. Regression Analysis
20
• After analyzing the regression table, we can write the regression model as-
ROA= (0.410875 - 0.003975*NPL – 0.017855*CATA + 0.009905*NIM + 0.149033*LLP +
0.002874*AGE)
22. FR
Hypothesis Testing
Variables P-Value Testing Hypothesis
NPL
0.0004<0.1
Reject Null
AGE 0.0087<0.1 Reject Null
CATA 0.7817>0.1 Failed To Reject Null
NIM 0.0478<0.1 Reject Null
LLP 0.2902>0.1 Failed To Reject Null
22
• Level of Significance – 10%
23. FR
F-Statistic
23
F- Statistic 0.007147< 0.1 Good Fit Model
Compare the p-value for the F-test to significant
level. If the p-value is not exactly the significant level,
the sample data provide adequate evidence to
conclude that regression model fits the data better
than the model with no independent variables.
24. FR
R- Squared & Adjusted R- Squared
24
44.64510
%55.3549%
R- Squared
ROA Independent Variables
Adjusted R-
Squared
0.327833 >
0.1
Good Fit
Model