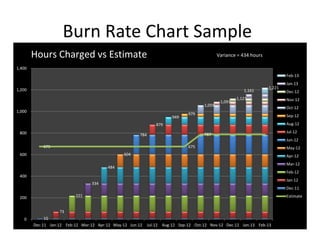
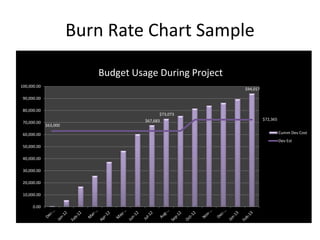
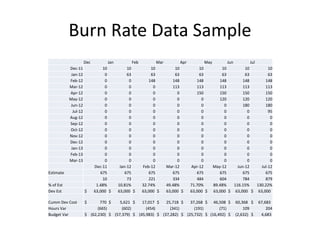
This document contains burn rate charts and data for a project from December 2011 to February 2013. The charts show hours charged versus estimated hours, cumulative development costs versus estimated costs, and budget usage over time. The data table provides estimated hours, hours charged, percentage of estimate charged, development cost estimates, cumulative development costs, hours variances, and budget variances on a monthly basis. Overall, the project hours were 434 hours over the estimate and had a final budget variance of $4,683.