SlideShare a Scribd company logo
Building the Future
Please refer to important disclosures at the end of this report.
Autumn 2008
Real Estate
Sector Overview: Real Estate Factbook
RESEARCH
Simon Moore
simon.moore@libertascapital.com
+44 (0)20 7569 9675
Autumn 2008 Building the Future
1
Contents Page
Executive Summary 3
Sector Overview 3
General Recommendations 3
Specific Recommendations 3
Introduction 5
Discounts 5
Regional Summaries 7
Global 7
UK 8
Western Europe 10
Central Eastern Europe 12
South Eastern Europe 13
Russia and the CIS 14
India 16
China 17
Asia 18
Background to this Fact Book 19
About the Fact Sheet Layout 22
Abbreviations 22
Individual Company Fact Sheets 23
Index 161
Autumn 2008 Building the Future
3
Building the Future
Real Estate Sector Overview
There are many investment opportunities at the moment – from deeply discounted
shares of listed property companies to direct exposure to the underlying properties or
projects – driven by forced sellers of the shares of these companies and forced sellers
of the assets themselves. We expect the underlying assets from portfolios of many of
the listed companies to be for sale, either direct properties that need to be sold to
reduce gearing or development projects that are unable to access funding. We also
expect governments’ spending on infrastructure will increase as they seek to build
themselves out of a recession (see the ‘Bridges to Nowhere’ policy in Japan over the
last 15 years), which will benefit buyers of both individual infrastructure projects and
the listed funds of infrastructure projects.
General Recommendations
In general, we like countries with GDP growth. Although scaled back from prior 2008
estimates, GDPs of some countries are still over 5% (e.g. India, China or Russia). We
prefer countries with transparent ownership of underlying real estate and where
repatriation of gains to investors is possible. We like real estate where there is some
form of government guarantee or support to the occupier and returns (e.g. the
healthcare sector or properties let to government departments). Also, we like real estate
and infrastructure projects which have local monopolies, long-term contracts and are
newly completed, so are no longer in the construction stage. We like companies which
have a commitment to pay dividends or where there are planned capital exits or wind-
up dates. The interests of shareholders’ and managers’ being closely aligned is also
desirable.
We prefer to avoid countries undergoing a recession (e.g. UK, US, EU). We also seek
to avoid high gearing and speculative project developments.
Specific Recommendations
Investors who are keen to maintain exposure to the UK should look at those
companies with low or no gearing and where there is a clearly announced commitment
to unchanged dividends such as F&C Commercial Property Trust (FCPT), ISIS
Property Trust (IPT), IRP Property Trust (formerly ISIS Property Trust 2) (IRP)
and UK Commercial Property Trust (UKCM).
Other income-seeking investors should look at those companies whose properties are
occupied by government or where rents are ultimately backed by government.
Examples of those holding properties that are in the healthcare sector, such as those let
to GPs, are: Assura Group (AGP), MedicX Fund (MXF) and Primary Health
Properties (PHP) or Wichford (WICH), which holds properties let directly to
government in the UK or in the EU.
While we remain cautious of the new-build residential sector, those that target secured
rents could also be safer havens. In Germany, Speymill Deutsche Immobilien
(SDIC) has more than 26,000 units in over 1,000 properties in the mid-market sector
with secured and rising rents.
Infrastructure assets typically have long leases and guaranteed rents including schools,
hospitals, roads and railways. We suggest these assets are safer havens in times of poor
economic prospects. For international infrastructure exposure, the choice is HSBC
Infrastructure (HICL), 3i Infrastructure (3IN) and Babcock & Brown Public
Partnerships (BBPP). For country specific infrastructure, there is Macquarie Korea
(MKIF), Vietnam Infrastructure (VNI), India Infrastructure (IIP), Trikona
Trinity Capital (TRC) and Eredene Capital (ERE) – the latter two invest in India.
Residential rentals
Likes
Dislikes
Healthcare and government
lets
Infrastructure
UK
Executive Summary
Building the Future Autumn 2008
4
In south eastern Europe (SEE) and central eastern Europe (CEE) we like: Bulgaria and
the wider Balkans region; companies that have a diversity of several projects, not just in
one sector or location; projects at different stages of completion; and projects that are
complete and fully let. Our favourites are: Bulgarian Land Development (BLD),
Equest Balkan Properties (EBP); Eastern European Property (EEP), Atlas
Estates (ATLS), Engel East Europe (EEE), Plaza Centers (PLAZ). In Ukraine
our preferred choice is Aisi Realty Public (AISI).
We like Russia, China and India where the economies are growing rather than
shrinking as in the West or in other more developed nations. Specifically, in Russia we
like: Raven Russia (RUS); and in China: China Real Estate Opportunities
(CREO) and Speymill Macau Property (MCAU). In India, we prefer: Hirco
(HRCO) for residential, Eredene Capital (ERE) for infrastructure and West
Pioneer Properties (WPR) for commercial.
BRIC economies
Eastern Europe
Autumn 2008 Building the Future
5
Introduction
In this fact book, we cover 138 real estate companies listed on the stock exchange in
London. Our universe covers investment funds as well as trading companies and
developers along with investors. Although listed in London, the underlying properties
and projects are all over the world. Most are specialised and focus on a single country
or sector and are managed by locally-based, experienced teams.
Initially, we covered only those stocks listed in London either on AIM or the main
market of the LSE. We have since added stocks listed on Euronext, in response to our
institutional clients’ requests, and are currently looking to add companies listed on
other exchanges such as on the Specialist Fund Market (SFM) and in Frankfurt as well
as those listed on the exchange in the country where they invest e.g. Russia and
Poland.
Discounts
Our daily list (available on request) shows that there are some very wide discounts.
There are companies where the property portfolios are valued at €2bn yet the market
value is only €10m. Some clearly have problems with high gearing, bank loan covenant
breaches and dividends cut or dividends suspended. However, there are others that are
well run, with sound tenants and good dividend cover such as Speymill Deutsche
Immobilien (SDIC), which is on a 93% discount to NAV.
Sector Discounts
Total Market Value
(£m)
Number of Companies Size-Weighted Average Discount
(%)
UK – REITs and Equivalents 15,057 28 -49.8
UK – Healthcare and Government-Backed 278 3 -35.1
UK – Other 426 9 -28.8
Western Europe – Germany 260 8 -81.3
Western Europe – Other Countries 701 14 -60.1
South East Europe (SEE) – Bulgaria & Romania 261 12 -56.6
Europe - Russia, Ukraine, CIS, Baltic States & Nordic 654 11 -87.2
Central & Eastern Europe (CEE) – Other Countries 646 11 -74.7
Asia – China 538 6 -77.6
Asia – India 410 10 -64.9
Asia – Other Countries 480 9 -78.2
Other Countries 111 3 -67.3
Global 470 7 -43.8
Infrastructure 1,519 7 -23.2
Total 21,810 138 -51.5
Source: Libertas Capital
Discounts to NAV for Selected Individual Companies
Company (Ticker) Sector Discount
(%)
Total Assets Market Value
(£m)
Gross Gearing
(%)
Net Gearing
(%)
Invista Foundation Property (IFD) UK -79.1 £660m 55 39 30
Speymill Deutsche Immobilien (SDIC) Germany -92.9 €2.0bn 29 60 54
Invista European Real Estate Trust (IERE) Pan Europe -92.1 €812m 21 54 49
Equest Balkan Properties (EBP) SEE -77.2 €430m 48 40 38
Raven Russia (RUS) Russia -80.8 $1.4bn 117 19 -
Atlas Estate (ATLS) CEE -97.6 €558m 7 28 25
China Real Estate Opportunities (CREO) China -78.2 £814m 109 31 22
Speymill Macau Property (MCAU) Macau -86.8 U$290m 22 7 0
Source: Libertas Capital
Stock exchanges covered
Building the Future Autumn 2008
6
Why are Discounts so Wide?
As well as forced sellers, as described earlier, many companies do not communicate
well with shareholders. Uncertainty of investments’ progress or valuation can lead to
extra selling pressure.
Some companies do not publish NAVs, hence investors do not know the value of what
they hold. Often, there is poor communication: websites that are not easy to follow;
few RNS announcements; infrequent updates of trading and progress; managers based
at a distance from shareholders and have infrequent contact with investors (either face-
to-face or via conference calls).
The UK REIT-like offshore property investment companies, as a group, have the best
communication with shareholders. They co-ordinate announcements so that all
quarterly report updates are at the same quarter ends and they announce within a few
days of each other. The on-shore UK REITs by comparison are amongst the worst
communicators, reporting only half-yearly at best and with a long delay between the
quarter end and the announcement of results.
Most have websites but all should. All should announce NAVs quarterly and should
have the same quarter end. Companies need to announce standard information, not
just to comply with LSE rules (e.g. AIM rule 26) – regular quarterly newsletters or fact
sheets are useful for shareholders and their underlying clients too, especially in the case
of funds or private client fund managers.
In general, more detail is needed in the announcements: NAV per share and quarterly
changes, including and excluding current period revenue; gearing; LTV (gross and net
of cash); LTV maximum covenant; interest rate on the loans, interest cover and
minimum covenant; total property value and quarterly changes; geographical and sector
spread of investments; the top ten properties or projects and their values; rents; tenant
quality; average lease length; development progress at each project; dividend
projections; dividend cover; and total expense ratios (‘TERs’).
We suggest that co-ordination could be brokered by a trade body like the Association
of Investment Companies (AIC), Reita or the European Public Real Estate Association
(EPRA).
Shareholder communication
What companies should
announce
Specific detail needed
Autumn 2008 Building the Future
7
Regional Summaries
Global
3IN.L
BBPP.L
BLK.L
CNMI.L
RIG.L
DGRE.L
HGPC.L
IGRE.L
PSPI.L
TRY.L
3i Infrastructure plc
Babcock & Brown Public Partnerships Ltd
Blackrock International Land plc
Camper & Nicholson Marina Investment Ltd
CQS Rig Finance Fund Ltd
Delek Global Real Estate Ltd
Henderson Global Property Co. Ltd
ING Global Real Estate Securities Ltd
Public Service Properties Investments Ltd
TR Property Investment Trust plc
Infrastructure
Social Infrastructure
Commercial – Industrial – Residential
Marina
Infrastructure – Oil Rigs
Commercial
Commercial
Commercial
Care Homes in the UK, Switzerland & Germany
Shares of Listed Property Companies
Analyst’s Comments
Economies worldwide look to be in the doldrums with low levels of growth forecast
for 2009 and 2010 (+0.8% and +1.9% respectively, down from +2.5% in 2008 and a
respectable +3.8% in 2007).
However, an average figure masks the variation at the individual level. While the global
outlook is muted but positive, some countries are in recession and others have good
growth prospects. We will cover the individual countries and regions later in this
report.
Recommendations
Of the companies in our universe with a global portfolio, we prefer the safer haven of
infrastructure assets, with Babcock & Brown Public Partnerships (BBPP) – our
preferred choice. We continue to expound the virtues of infrastructure funds. Typically,
they have diverse portfolios with long contracts backed by governments; this should
make them safer havens than other listed investments. We like BBPP for its global
reach via its connections with the Babcock & Brown group. Of the London-listed
infrastructure funds, BBPP has one of the best global deal sourcing networks through
the B&B connections. The mix of mature and development projects means there is a
strong likelihood of both NAV and income growth. We believe that BBPP would suit
risk-averse investors who prefer inflation-linked dividends from a diverse portfolio of
international infrastructure assets.
Economic Summary
World 2008 2009 2010
Real GDP (%) 2.5 0.8 1.9
Consumer Price (%) 6.1 3.8 3.2
Curr. Acct. Bal. % GDP - 0.7 0.7
Source: Economist Intelligence Unit
Building the Future Autumn 2008
8
United Kingdom
TAP.L Advantage Property Income Trust Ltd Offices, Industrial, Retail, Leisure, Retail
Warehousing
AGR.L Assura Group Ltd Infrastructure – Healthcare
BYG.L Big Yellow Group Self Storage
BLND.L British Land Co. plc Commercial
BXTN.L Brixton plc Industrial – Warehouse
CHI.L Close High Income Properties plc Commercial
CHID.L Close High Income Properties plc (D shares) Commercial
CIC.L Conygar Investment Company plc Residential – Leisure – Retail
DLN.L Derwent London plc Office
DSC.L Development Securities plc Retail – Industrial – Office
FCPT.L F&C Commercial Property Trust Ltd Commercial
GPOR.L Great Portland Estate plc Office – retail – residential
HCFT.L Highcroft Investment plc Diversified
HICL.L HSBC Infrastructure Company Ltd Infrastructure
IRET.L ING UK Real Estate Income Trust Ltd Retail – Office – Industrial – Leisure – Warehouse
INL.L Inland plc Residential
IFD.L Invista Foundation Property Trust Ltd Commercial
IRP.L IRP Property Investments Ltd Commercial
IPT.L ISIS Property Trust Ltd Commercial
LAND.L Land Securities Group plc Residential – Commercial
LII.L Liberty International plc Shopping Centres
LSR.L Local Shopping REIT plc Retail
LSP.L London & Stamford Property Ltd Commercial
MCKS.L McKay Securities plc Commercial
MXF.L MedicX Fund Ltd Infrastructure – Healthcare
MKLW.L Mucklow (A&J) Group plc Industrial – Commercial
OTE.L O Twelve Estate Ltd Shopping Centres – Industrial – Retail
OPF.L Off-Plan Fund Ltd Residential
PHP.L Primary Health Properties plc Infrastructure – Healthcare
RLE.L Real Estate Investors plc Commercial – Industrial
REO.L Real Estate Opportunities Ltd (Ordinary Shares) Commercial
RUGB.L Rugby Estates Investment Trust plc Commercial
SGRO.L Segro plc Commercial
SHB.L Shaftesbury plc Retail – Residential – Office – Leisure
SVN.L Sovereign Reversion plc Residential
SLI.L Standard Life Investment Property Income Trust plc Commercial
THG.L Terrace Hill Group plc Commercial – Residential
TCSC.L Town Centre Securities plc Retail
UKCM.L UK Commercial Property Trust Ltd Commercial
WNER.L Warner Estate Holdings plc Retail
WKP.L Workspace Group plc Office – Industrial
Analyst’s Comment
The UK is currently in recession, but property values have been falling for c.18 months.
However, this reversed an appreciating trend which began in 1996 and represents one
of the most dramatic rallies in recent history.
UK Capital Values Rise (1989-2008) UK Capital Values Fall (2006-2008)
Source: Thomson Datastream and Investment Property Databank (IPD)
Economic Summary
United Kingdom 2008 2009 2010
Real GDP %) 1.0 -2.1 -0.9
Consumer Price (%) 3.8 1.8 1.1
Curr. Acct. Bal. % GDP -2.5 -2.1
Source: IMF International Financial Stats
IPD: CAPITAL INDEX (TIME-WEIGHTED) 11/12/08
89 90 91 92 93 94 95 96 97 98 99 00 01 02 03 04 05 06 07 08
100
120
140
160
180
200
220
240
UK IPD: CAPITAL INDEX (TIME-WEIGHTED) NADJ
Autumn 2008 Building the Future
9
The beginning of this rally was marked by the entry of pension funds that were fuelled
by the desire to diversify away from equities and gilts. Pension funds move slowly, like
oil tankers. Once turned on they are hard to stop. Institutions continued to buy
property until the yield on fully let property fell below the risk free rate on gilts - a
reverse yield gap – this was a clear indication that UK property values had risen too far.
The process began to reverse in early 2008 before the current banking crisis began.
Real estate sellers predominated and values fell, NAVs fell, private clients and their
pensions fund woke up to the falls. Investing in bricks and mortar were not totally safe
– valuations could fall. Publicity around falling real estate values triggered sales from
open-ended property funds. This process forced fund managers to sell properties to
meet client redemptions, despite a shortfall of buyers. Unit trusts and other open-
ended funds tried to limit client redemptions, but saw further pressure when the ‘credit
crunch’ impacted financial institutions, resulting in a recognised recession. Commercial
vacancies are only just beginning to rise. Precious support to capital value falls has
come from rental growth of 0.5% pcm i.e. 6% p.a. However, this looks under threat
now. Currently, there is rent support for values but this may not last for much longer.
The UK real estate market is mature and transactions are the most transparent in
Europe. Valuers marked property values down to levels that buyers told them they
would be paying. Not so in Europe, which seemed to hold up but valuers now have to
recognise the real value and are marking down prices more aggressively.
Most listed property funds have high levels of debt which leads to geared falls at the
NAV per share level. Asset managers cannot sell properties quickly enough and in large
enough size to deleverage. Several funds hit their loan to value (‘LTV’) covenant limits
on their bank loans. Loans also have interest rate cover (‘IRC’) tests, but none of the
funds are yet in breach of these. The next bank loan test for most companies will be at
2008 year-end. We expect to see the results of these tests and any repercussions in
1Q09.
We do not expect to see banks calling in loans and ‘fire sales’ of whole portfolios (this
will only hurt valuations even more and hit other parts of bank loan books). Instead,
banks will concentrate on IRC, forcing companies to reduce outgoings as much as
possible so that interest cover is maintained. We expect this to lead to dividend
cuts/suspensions, management fee cuts or both. We may also see consolidation to
reduce total expense ratios and rescue issues of equity to bolster balance sheets
(possibly as preference shares).
Our checks with UK property managers suggest they are de-gearing as fast as possible.
Many have pushed out predictions for a real estate recovery – currently not until 2010.
Recommendations
Avoid: city and residential, developers, new REITs, high gearing. Like: good dividend
cover and forecast unchanged dividends, low gearing, government backed income e.g.
GP surgeries (e.g. Primary Health Properties (PHP), Assura Group (AGR),
MedicX Fund (MXF)) or government-occupied buildings (e.g. Wichford (WICH)),
or infrastructure (e.g. HSBC Infrastructure (HICL)). Investors who are keen to
maintain exposure to the general UK commercial sector should look at those
companies with low or no gearing and where there is a clearly announced
commitment to unchanged dividends, such as F&C Commercial Property Trust
(FCPT), ISIS Property Trust (IPT), IRP Property Trust (formerly ISIS
Property Trust 2) (IRP) and UK Commercial Property Trust (UKCM).
Gearing
When will it end?
Dividend cuts likely
Building the Future Autumn 2008
10
Western Europe
ALPH.L Alpha Pyrenees Trust Ltd France – Spain Industrial - Logistics - Office - Retail
APT.L AXA Property Trust Pan-Europe Offices – Retail – Industrial – Leisure – Hotels
CAL.L Capital & Regional Germany Retail
CRF.L Ciref Pan-Europe Retail – Commercial
DTR.L Dawnay Day Treveria Germany Retail
DLD.L Deutsche Land Germany Retail – Office – Hotel
DDE.L Develica Deutschland Germany Office – Retail – Distribution
HMSO.L Hammerson France – UK Retail
HSTN.L Hansteen Holdings Pan-Europe Commercial
IPI.L Invesco Property Income Trust Pan-Europe Commercial
IERE.L Invista European Real Estate Trust France – Germany commercial
KEIF.L Kenmore European Industrial Fund Pan-Europe Industrial
MERE.L Matrix European REIT Pan-Europe Commercial
PUMA.L Puma Brandenburg Germany Residential – Retail – Commercial
RTY.L Rutley European Property Ltd Pan-Europe Commercial
SRE.L Sirius Real Estate Ltd Germany Office – Industrial – Business Park
SPNV.L Spazio Investment Italy Industrial
SDIC.L Speymill Deutsche Immobilien Co. Germany Residential
SGL.L Summit Germany Germany Commercial
TPF.L Taliesin Property Fund Germany Residential
TCF.L Terra Catalyst Fund Pan-Europe Listed Real Estate Securities
TRYS.L TR Property Investment Trust plc (Sigma) Pan-Europe Listed Real Estate Securities
WICH.L Wichford Europe – UK Government – Offices
Analyst’s Comment
Europe – West
This is a mature market with many commercial and investment properties available.
Valuations in general are currently being marked down having been held up by valuers
for far too long. It had looked like Western Europe was initially immune from the falls
in the UK. Properties in Europe had not been so highly priced as in UK, so we do not
expect that there should be as hard a fall as in the UK.
However, even in Europe, retailers are going bust and vacancies are rising. Within
Europe, the real estate sector in each country is different. Real estate is one of only a
few sectors that cannot be treated with one global set of rules (unlike, for example,
Automotives or Electronics)
Because Kenmore European Industrial Fund (KEIF) has such a broad portfolio of
properties across Western Europe, we use news and results at KEIF to represent a
good summary of the whole of the Western European commercial property sector:
“European property values continue to decline as a result of the wider economic
climate, with the industry expecting values to fall further through to the end of 2008.
Lack of credit has seen the investment market slow considerably with transactions
limited to mostly individual property sales of assets under €20 million. While occupier
demand remained strong in 3Q08, albeit slower than expected for the summer months,
tenant demand is expected to slow as economies see sluggish GDP growth and, in
some cases, recession. Bank debt remains difficult to source at gearing levels over 50%
and recent interest rate cuts have not been reflected in the terms offered by the banks
with the inter-bank lending rate remaining stubbornly high and reflecting the banking
institutions' continued concerns about lending to one another. The European property
market is not expected to recover in the near term. Higher CPI is a positive factor in
the current market and should help off-set some of the downward value pressure and
tenants are expected to minimise their own costs by remaining in situ on lease expiry,
avoiding moving costs.” (Source: Kenmore European Industrial Fund (KEIF))
European Property Market Outlook
We believe the UK property market will fall 45% from its peak in February 2007.
Europe, excluding the UK, is unlikely to fall as far since Continental property markets
did not get so overvalued.
Economic Summary
France 2008 2009 2010
Real GDP (%) 0.8 -0.7 0.6
Consumer Price (%) 3.4 1.6 1.4
Curr. Acct. Bal. % GDP - -1.4 -1.3
Germany 2008 2009 2010
Real GDP (%) 1.9 -0.7 0.4
Consumer Price (%) 2.9 0.6 1.4
Curr. Acct. Bal. % GDP - 7.0 5.8
Italy 2008 2009 2010
Real GDP (%) -0.06 -1.0 0.5
Consumer Price (%) 3.44 1.3 1.3
Curr. Acct. Bal. % GDP - -2.1 -1.8
Spain 2008 2009 2010
Real GDP (%) 1.38 -1.2 0.7
Consumer Price (%) 4.5 2.5 1.8
Curr. Acct. Bal. % GDP - -8.6 -7.5
Source: Economist Intelligence Unit,
Eurostat, and IMF
Autumn 2008 Building the Future
11
Norway
This has seen the worst falls in value. It is a very thin market and there have been very
few transactions. However, there are several positives: recent cuts in interest rates
should stimulate the sector; low tenant risk; no speculative developments; and a strong
economy based on its oil and gas revenues.
Sweden
We prefer Sweden to Norway as the economy is more diversified: more industries,
more cities and more investors.
Finland
This is the strongest property market in northern Europe. Tenants typically do not
move, leasing demand is consistent and there are many private buyers.
Germany
The market has regional characteristics. The east is suffering. The normally resilient
south west is reeling from recent financial shocks (including problems at Hypo Real
Estate) and rising unemployment. It will be another six to nine months before the full
effects of the downturn materialise. We expect real estate values to fall but less severely
than in the UK.
France
Laws to retrieve rents from defaulting tenants are particularly hard to enforce in
France, making property yields vulnerable in a recession. France is usually a strong
market and Paris has been the second largest property market in Europe after London.
Property in Paris became the most overvalued of all European markets after London
so is likely to falloff quite steeply.
Belgium
This is a defensive economy though the Fortis impact will ripple out to affect the wider
economy. Property around Antwerp port and nearby trade routes should be particularly
good defensive investments.
Netherlands
The real estate market is very transparent, like the UK. Local and international
investors are active in the sector. Although property is expensive, it is a defensive
sector at the moment.
Recommendations
Avoid: Commercial property in Germany and France where steeper falls are expected.
Avoid: Spain – where oversupply means rents are falling and there are high vacancy
rates.
Netherlands, Belgium and Finland are good defensive plays. We also like: the German
residential sector (e.g. Speymill Deutsche Immobilien (SDIC)); infrastructure and
properties occupied by governments (e.g. Wichford (WICH)); countries which have a
transparent property sector, a wide institutional investor base and a high level of
transactions (e.g. Netherlands).
Building the Future Autumn 2008
12
Central Eastern Europe
ABL.L Ablon Group Ltd Budapest – Prague –
Bucharest
Office, Residential, Hotel, Retail, Logistics
ATLS.L Atlas Estates Ltd Pan CEE Commercial – Residential
CPT.L Carpathian plc Pan CEE Retail – Shopping Centres – Supermarkets –
Warehousing
EEE.L Engel East Europe NV Pan CEE Residential
NAT.L Nanette Real Estate Group NV Pan CEE Residential
PHU.L Pactolus Hungarian Property plc Budapest Residential
PLAZ.L Plaza Centers NV Pan CEE Shopping Centres
Analyst’s Comments
Central and Eastern European (‘CEE’) countries are nascent markets. There are few
investment opportunities. Accordingly, we believe that there are more developments
than investment opportunities.
One of the main drivers has been the enlargement of the European Union to include
countries in the East. In 2004 the Czech Republic, Estonia, Cyprus, Hungary, Latvia,
Lithuania, Malta, Poland, Slovakia and Slovenia joined. This was a historic enlargement
which signified the re-unification of Europe after decades of division. On January 1
2007, Bulgaria and Romania also joined, completing this historic process (see the
section on South Eastern Europe (‘SEE’) later in this report which covers Bulgaria and
Romania). In each of these countries, there were several years of fast GDP growth in
the immediate run-up to joining the EU and beyond, as these countries sought to catch
up to Western Europe (in terms of wages), increased access to finance and increasing
inward investment levels from expanding Western European companies.
This process has continued with new EU joiners Bulgaria and Romania. We expect the
process to be repeated with further joiners. Current candidate countries are Croatia, the
Former Yugoslav Republic of Macedonia (FYROM) and Turkey. The potential
candidate countries are Albania, Bosnia and Herzegovina, Kosovo (under UN Security
Council Resolution 1244), Montenegro and Serbia.
Typically, many residents in former communist countries: (a) own their own homes and
(b) have little to no debt. As access to borrowings has been increasing more personal
loans have been taken out but they are still at much lower penetration levels than in the
West. Also new entrants to the EU have generally experienced increased trade, inward
investment and jobs. Salaries have been rising from amongst the lowest levels in
Europe. Both effects have fuelled consumer spending. This has opened up real estate
opportunities in the residential sector (for locals trading up) and for shopping malls
(for international brands wishing to capture increasing consumer spending when their
home Western European markets appear to be slowing).
EU membership also triggers the release of infrastructure grants. This is aimed at
opening up new trading routes and necessitates the building of new motorways, ring
roads, tunnels and bridges. The European Commission has identified key trade
corridors, especially the pan Europe transport corridor X (linking Austria to Greece
and Turkey via Bulgaria and Serbia) and pan Europe transport corridor IV (linking
Germany to Romania, Turkey, Bulgaria and Greece).
In July 08 the EU suspended grants to Bulgaria and Romania as these countries had
not cleaned up corruption quickly enough. When these grants resume it should trigger
renewed FDI (Foreign Direct Investment) & investment opportunities in these two
countries.
Meanwhile transport corridor VII is the Danube, a natural and already busy highway
linking the Black Sea with southern Germany and via the Main canal to the Rhine and
the North Sea. We see key projects on the Danube as beneficiaries of increasing East-
West trade across Europe as the CEE and SEE countries develop.
EU enlargement
New and future joiners
Increased domestic
consumption
European infrastructure
grants
Danube transport corridor
Autumn 2008 Building the Future
13
Both the CEE and SEE are newer real estate markets, offering fewer investment
opportunities. Development projects predominate. These take longer and have more
risk so investors should expect higher returns than for investment (i.e. completed and
fully let) properties.
To be successful, these developments need locally based and experienced managers.
Investors based abroad are often unfamiliar as to how the local real estate market
works so need a trusted local manager. There also needs to be good and regular
communication of progress back to the investor.
In the current market, where access to bank financing is restricted (even in the CEE
and SEE markets), developers are scaling back on projects. Banks are currently only
lending to the better projects which have pre-lets to quality tenants and are managed by
experienced developers.
In October the ECB extended a €5bn credit line to Hungary to cover an acute shortage
of euros among Hungarian banks. The ECB has never publicly helped an EU member
that is not in the Eurozone until now. The IMF will also help Hungary. New loans to
banks in Hungary may ease developers’ access to finance and kick start construction.
Projects previously on hold may be able to restart. This could improve sentiment to the
listed real estate companies in Hungary.
Recommendations
Avoid: speculative developments, second homes, holiday-related. Like: Bulgaria and the
wider Balkans region; companies that have a diversity of several projects, not just in
one sector or location; projects at different stages of completion; projects that are
complete and fully let. Favourites: Bulgarian Land Development (BLD), Equest
Balkan Properties (EBP); Eastern European Property (EEP), Atlas Estates
(ATLS), Engel East Europe (EEE), Plaza Centers (PLAZ).
South Eastern Europe
AREO.L Argo Real Estate Opportunities Fund Romania Commercial
BKSA.L Black Sea Property Fund Ltd Bulgaria Vacation Property on Black Sea – Ski
Resort
BLD.L Bulgarian Land Development plc Bulgaria Residential – Commercial
BPD.L Bulgarian Property Developments plc Bulgaria Commercial
CBX.L Cubus Lux plc Croatia Casino – Marina – Resort
DCI.L Dolphin Capital Investors Ltd Greece -Turkey – Cyprus
– Croatia
Residential – Leisure
EEP.L Eastern European Property Fund Ltd Bulgaria – Romania -
Turkey
Office – Warehouse – Retail
EBP.L Equest Balkan Properties plc Bulgaria – Romania Commercial – Retail – Industrial Property
ECDC.L European Convergence Development
Company plc
Bulgaria – Romania Residential – Retail – Commercial –
Industrial Property.
ECPC.L European Convergence Property Company
plc
Turkey – Romania Commercial – Retail –Industrial
FAB.L Fabian Romania Ltd Romania Commercial – Residential
LCSR.L Lewis Charles Romania Property Fund Ltd Romania Commercial – Residential
LCSS.L Lewis Charles Sofia Property Fund Ltd Bulgaria Residential – Sky Resort
MBF.L Madara Bulgarian Property Fund Ltd Bulgaria Land Development
NEPI.L New Europe Property Investment plc Romania – CEE Commercial Property
OCH.L Orchid Developments Ltd Bulgaria Residential – Hotel – Retail – Logistic
OTM.L Ottoman Fund Ltd Turkey Residential
Analyst’s Comments
The SEE region covers the newest EU joiners and the countries next in line to join.
Just before and just after joining the EU a country shows the highest growth (e.g. see
the Baltic States and CEE countries when they joined the EU). Within the SEE region,
there are more than enough Bulgarian real estate companies which would benefit from
consolidation. The sea and ski residential sector seems to be the worst hit by recession.
We prefer the commercial property sector, fully let properties and infrastructure
projects.
Economic Summary
Czech Republic 2008 2009 2010
Real GDP (%) 4.03 3.0 3.4
Consumer Price (%) 6.74 3.0 2.3
Curr. Acct. Bal. % GDP - -3.1 -3.3
Hungary 2008 2009 2010
Real GDP (%) 1.9 3.0 3.8
Consumer Price (%) 6.3 4.2 3.2
Curr. Acct. Bal. % GDP - -6.2 -6.3
Poland 2008 2009 2010
Real GDP (%) 5.2 2.9 3.6
Consumer Price (%) 4.0 3.6 2.8
Curr. Acct. Bal. % GDP - -5.0 -3.9
Source: Eurostat, Economist Intelligence
Unit and IMF
Economic Summary
Bulgaria 2008 2009 2010
Real GDP (%) 6.25 1.9 2.6
Consumer Price (%) 12.22 7.1 4.3
Curr. Acct. Bal. % GDP - -18.8 -10.5
Romania 2008 2009 2010
Real GDP (%) 8.60 2.6 3.9
Consumer Price (%) 8.225 5.8 4.2
Curr. Acct. Bal. % GDP - -12.8 -9.8
Turkey 2008 2009 2010
Real GDP (%) 3.50 1.5 3.3
Consumer Price (%) 10.48 10.8 7.0
Curr. Acct. Bal. % GDP - -4.1 -3.6
Source: Central Bank of the Republic of
Turkey, Eurostat, IMF and the National
Statistical Institute
Building the Future Autumn 2008
14
Russia and the CIS
AFID.LI AFI Development plc Russia Commercial – Residential
AISI.L Aisi Realty Public Ltd Ukraine Residential – Office – Warehouse
DUPD.L Dragon-Ukrainian Properties & Development plc Ukraine Commercial
KDDG.L KDD Group NV Ukraine Office – Retail – Residential – Mixed-Use
MLD.L Mirland Development Corp plc Russia Residential – Commercial
RUS.L Raven Russia Ltd Russia Logistic
RGI.L RGI International Ltd Russia Residential – Office
XXIC.L XXI Century Investments Public Ltd Ukraine Shopping Centres – Offices – Hotels – Logistics
– Residential
Analyst’s Comment
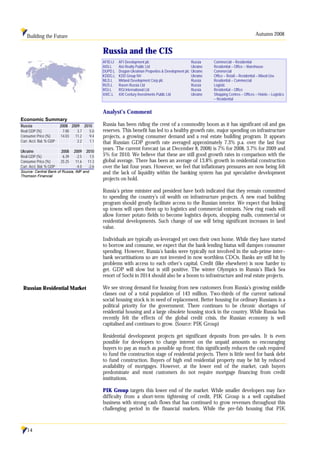
Russia has been riding the crest of a commodity boom as it has significant oil and gas
reserves. This benefit has led to a healthy growth rate, major spending on infrastructure
projects, a growing consumer demand and a real estate building program. It appears
that Russian GDP growth rate averaged approximately 7.3% p.a. over the last four
years. The current forecast (as at December 8, 2008) is 7% for 2008, 3.7% for 2009 and
5% for 2010. We believe that these are still good growth rates in comparison with the
global average. There has been an average of 13.8% growth in residential construction
over the last four years. However, we feel that inflationary pressures are now being felt
and the lack of liquidity within the banking system has put speculative development
projects on hold.
Russia’s prime minister and president have both indicated that they remain committed
to spending the country’s oil wealth on infrastructure projects. A new road building
program should greatly facilitate access to the Russian interior. We expect that linking
up towns will open them up to logistics and commercial entrants. New ring roads will
allow former potato fields to become logistics depots, shopping malls, commercial or
residential developments. Such change of use will bring significant increases in land
value.
Individuals are typically un-leveraged yet own their own home. While they have started
to borrow and consume, we expect that the bank lending hiatus will dampen consumer
spending. However, Russia’s banks were typically not involved in the sub-prime inter–
bank securitisations so are not invested in now worthless CDOs. Banks are still hit by
problems with access to each other’s capital. Credit (like elsewhere) is now harder to
get. GDP will slow but is still positive. The winter Olympics in Russia’s Black Sea
resort of Sochi in 2014 should also be a boom to infrastructure and real estate projects.
We see strong demand for housing from new customers from Russia’s growing middle
classes out of a total population of 143 million. Two-thirds of the current national
social housing stock is in need of replacement. Better housing for ordinary Russians is a
political priority for the government. There continues to be chronic shortages of
residential housing and a large obsolete housing stock in the country. While Russia has
recently felt the effects of the global credit crisis, the Russian economy is well
capitalised and continues to grow. (Source: PIK Group)
Residential development projects get significant deposits from pre-sales. It is even
possible for developers to charge interest on the unpaid amounts so encouraging
buyers to pay as much as possible up front; this significantly reduces the cash required
to fund the construction stage of residential projects. There is little need for bank debt
to fund construction. Buyers of high end residential property may be hit by reduced
availability of mortgages. However, at the lower end of the market, cash buyers
predominate and most customers do not require mortgage financing from credit
institutions.
PIK Group targets this lower end of the market. While smaller developers may face
difficulty from a short-term tightening of credit, PIK Group is a well capitalised
business with strong cash flows that has continued to grow revenues throughout this
challenging period in the financial markets. While the pre-fab housing that PIK
Russian Residential Market
Economic Summary
Russia 2008 2009 2010
Real GDP (%) 7.00 3.7 5.0
Consumer Price (%) 14.03 11.2 9.4
Curr. Acct. Bal. % GDP 2.2 1.1
Ukraine 2008 2009 2010
Real GDP (%) 6.39 -2.5 1.5
Consumer Price (%) 25.25 11.6 11.3
Curr. Acct. Bal. % GDP -4.0 -2.6
Source: Central Bank of Russia, IMF and
Thomson Financial
Autumn 2008 Building the Future
15
manufactures en masse might not appeal to Western readers, these are just what middle-
income Russians want. There seems to be no weakness in the prices that they can
charge for their units and the company is doing very well financially. PIK does not
build speculatively like other (mostly Moscow based) Russian residential developers and
its land banking and expansion plans will also serve to distance itself from its rivals.
The GDRs of this company are London listed.
In Russia, the real estate sector is not transparent and the planning approval process is
slow. It is important to look for experienced local developers before investing.
Recommendations
Avoid: high end residential sector which has been overdone; most portfolios that are
not diversified and are focused only around Moscow; small, poorly-financed
developers.
Like: logistics. We are positive about the prospects for the Russian logistics market and
about Raven Russia (RUS) in particular. The continued availability of bank financing
to RUS confirms the quality and financial viability of the projects and confidence in the
RUS management team’s ability to execute.
Ukraine
In October the IMF agreed to a US$14bn loan to Ukraine. New loans to banks in
Ukraine may ease developers’ access to finance and kick start construction. Projects
previously on hold may be resumed. This factor could improve sentiment to the listed
real estate companies that have projects in Ukraine.
The IMF has, in principle, agreed to this loan to the Ukraine (the fact that the country
turned to the IMF for help shows how far pro-West the Ukraine has moved). How
good this will be for the country depends on what strings are attached. The transaction
still needs to be approved by Ukraine’s government, but this was recently dissolved.
New elections originally scheduled for early December will be needed to speed this
loan approval process.
Recommendations
We like Aisi Realty Public (AISI). AISI itself has no debt and so is not dogged by the
fall out from the global credit crunch. It has a $65m loan facility (but undrawn) in place
with the Cyprus bank – “Marfin Bank” – and has signed another loan with the
European Bank of Reconstruction and Development (EBRD). It will total US$37.3m
from the EBRD, although half of this will be syndicated to other banks. EBRD
approval of this loan also demonstrates that the AISI management team has passed the
EBRD’s thorough due diligence process.
Ukraine economy
Building the Future Autumn 2008
16
India
ATPT.L Alpha Tiger Property Trust Ltd Business Parks – Commercial – Residential
ERE.L Eredene Capital plc Commercial/IT Parks – Residential – Retail
HRCO.L Hirco plc Residential – Commercial
IIP.L Infrastructure India plc Infrastructure
ISH.L Ishaan Real Estate plc IT Park – SEZ Projects
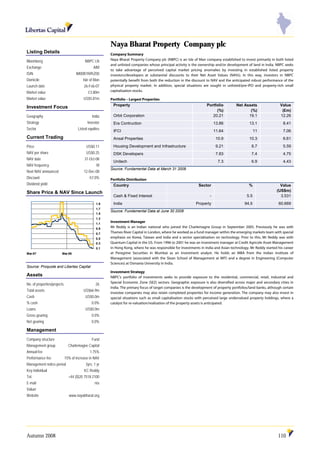
NBPC.L Naya Bharat Property Co. plc Indian Listed Real Estate Securities
TRC.L Trikona Trinity Capital plc Infrastructure – Residential – Township – Business Park – Hotels
UCP.L Unitech Corporate Parks plc Commercial
WPR.L West Pioneer Properties Ltd Shopping Mall
YATRA.AS Yatra Capital Ltd Retail – Commercial – Residential – Mixed-use – Hospitality
Analyst’s comment
India, China and Russia have been vying for the top spot for the best GDP growth in
the world. The latest forecasts for 2009 are 6.1%, 7.5% and 3.7% for India, China and
Russia respectively; this puts India in second place. In Russia, growth has been
underpinned by oil and gas revenues. In China, growth was centrally planned based on
cheap labour, limited capitalism and controlled inward investment. India not only has
relatively cheap labour, but also has free market capitalism, a well-educated middle
class, is English speaking and has a democratic government. While the democratic
process may lead to more delays and the planning and approval process may take
longer in India, once done it is legal and binding. Crucial legal title for land ownership
and real estate transactions are much more transparent than in either China or Russia.
Indians are getting wealthier and there is a growing middle class. Migration to cities has
created a demand for new homes. City centres are too congested and infrastructure is
outdated and to fix this needs a big commitment. Central and local governments are
courting foreign investors for major projects in all sectors: commercial, residential and
infrastructure.
There is an unsatisfied demand for better residential apartments. The increasingly
sophisticated domestic consumer has created a need for better shops and malls.
Growing cities means there is a need for more infrastructure projects.
India has benefited from outsourcing by international companies for many years (e.g.
software development, call centres). In the current downturn, we expect India to
benefit since we expect an increase in outsourcing as companies cut costs to survive.
Key bottlenecks that need addressing are fuel supplies, housing and infrastructure.
India needs ports, roads, railways, logistics’ warehouses and distribution centres
(especially of refrigerated food stocks). We expect that increased infrastructure
investments will lead to significant rises in land values in surrounding areas and open
up more areas for development.
There is not much local experience in infrastructure projects, which traditionally has
been concentrated in a few family firms. Ideally, infrastructure project managers need:
good access to local planners; central government infrastructure experience; port
experience; and logistics experience.
For non-infrastructure developments e.g. hotels, commercial or shopping malls, these
are comparatively new sectors in India and home-grown expertise is rare. The best
teams will often include many who have gained their experience abroad or with
international organisations.
Recommendations
Avoid: inexperienced managers, unfocused portfolios. Likes: Residential: Hirco
(HRCO), run by the long-established Hiranandani family; Infrastructure: Trikona
Trinity Capital (TRC) & Eredene Capital (ERE); Commercial: West Pioneer
Properties (WPR).
Economic Summary
India 2008 2009 2010
Real GDP (%) 7.9 6.1 7.1
Consumer Price (%) 7.9 6.7 4.9
Curr. Acct. Bal. % GDP - -3.8 -4.2
Source: IMF
Autumn 2008 Building the Future
17
China
AGP.L Asian Growth Properties Ltd Hong Kong Commercial – Hotel – Retail – Residential
CPIL.L Canton Property Investment Ltd Guangzhou Shopping Mall
CCPL.L China Central Properties Ltd Mainland Commercial – Retail – Residential (Prime Location)
CREO.L China Real Estate Opportunities Ltd Mainland Office – Residential – Warehouse
MPO.L Macau Property Opportunities Fund Ltd Macau Residential – Mixed-Use – Logistic
PACL.L Pacific Alliance China Land Ltd Mainland Residential – Office – Retail – Hospitality – Industrial
MCAU.L Speymill Macau Property Co. plc Macau Commercial – Residential
CPIL.L Canton Property Investment Ltd Guangzhou Shopping Mall
CCPL.L China Central Properties Ltd Mainland Commercial – Retail – Residential (Prime Location)
CREO.L China Real Estate Opportunities Ltd Mainland Office – Residential – Warehouse
MPO.L Macau Property Opportunities Fund Ltd Macau Residential – Mixed-Use – Logistic
Analyst’s Comment
China is the powerhouse of the Asia region. Forecast growth is still the highest in the
world at 7.5% for 2009 and 2010. China has its own domestic consumer which is
becoming a major driver for growth. Population movement from rural regions to cities
has put demands on those cities. Increased per capita wealth has led to greater demand
for higher quality goods and food, which has pushed up prices globally. Nevertheless,
China remains a cheap source of labour for the west. As demand from the US stalls, we
expect China’s growth to slow, but it will be offset by increased home consumption.
Gambling is a Chinese obsession. The world’s biggest rollers are Chinese. Macau is the
only place in China where gambling has been legalised. Two billion people live within a
five hour flight to Macau. Gambling revenues have surpassed those at Las Vegas. New
casino building has recently stalled but there is enough capital committed to existing
projects to keep the economy growing for many more years. On top of this, gambling
stocks are a known safe haven for investors in times of recession. The province of
Macau, Hong Kong and neighbouring Guangdong are all committed to major
infrastructure projects to glue the region together (land reclamation, roads, bridges,
ports, airports). We believe that this will increase traffic between the cities and should
harmonise property prices and valuations. Macau property is currently significantly
cheaper than Hong Kong.
Recommendations
Like: Cash rich companies, which are well run, diversified portfolio of projects,
investments and developments: e.g. China Real Estate Opportunities (CREO),
Speymill Macau Property (MCAU).
Avoid: smaller companies with few projects; companies that only have early stage
development projects; and projects where development financing has not been secured.
Economic Summary
China 2008 2009 2010
Real GDP (%) 9.7 7.5 7.5
Consumer Price (%) 6.4 2.9 3.5
Curr Acct Bal % GDP 9.2 7.3
Source: IMF
Building the Future Autumn 2008
18
Asia
ASPL.L Aseana Properties Ltd Vietnam Shopping Mall – Residential – Office – Hospitality –
Retail
JRIC.L Japan Residential Investment Company Ltd Japan Residential
JSM.L JSM Indochina Ltd Vietnam Retail – Residential
MKIF.LI Macquarie Korea Infrastructure Fund Korea Infrastructure
PEJR.L Prospect Epicure J-REIT Value Fund plc Japan Japan-Listed REITs
SGLV.L SGL Vietnam Development Ltd Vietnam Residential
VNI.L Vietnam Infrastructure Ltd Vietnam Infrastructure
VPF.L Vietnam Property Fund Ltd Vietnam Listed Equities
VNL.L Vinaland Ltd Vietnam Residential – Office – Retail – Industrial – Leisure
Analyst’s Comment
China’s neighbours covet the growth shown by the cities of Shanghai and Shenzhen –
and want their own boom towns. Other Asian countries are planning similar Special
Economic Zones along the lines of the China model. There are many capital city re-
developments planned, including ring roads, bridges, tunnels and the re-zoning of
existing agricultural outskirts. Countries are trying to avoid the mistakes of quick and
unplanned developments and crucially there is increasing transparency to real estate
transactions.
Recommendations
Likes: Vietnam, especially infrastructure projects e.g. Vietnam Infrastructure (VNI);
Macquarie Korea Infrastructure (MKIF).
Avoid: Japan, Thailand.
Economic Summary
Japan 2008 2009 2010
Real GDP (%) 0.69 -0.1 0.9
Consumer Price (%) 1.57 1.2 0.9
Curr. Acct. Bal. % GDP 4.2 3.6
Korea 2008 2009 2010
Real GDP (%) 4.11 1.6 2.3
Consumer Price (%) 4.80 3.9 2.9
Curr. Acct. Bal. % GDP -0.3 -0.8
Vietnam 2008 2009 2010
Real GDP (%) 6.30 4.3 5.3
Consumer Price (%) 24.00 8.7 6.3
Curr. Acct. Bal. % GDP -5.9 -2.9
Source: Eurostat, Economist Intelligence
Unit and IMF
Autumn 2008 Building the Future
19
Background to this Fact Book
This fact book is aimed at institutional investors. Libertas Capital has sales teams based
in Hong Kong, Dubai, London and New York. From these offices, we can reach
investors based anywhere in the world. Please contact one of our offices for a hard
copy of this report. Through our global reach, many of our institutional clients and
wealth managers have large cash reserves, particularly from our Middle East sales
clients. These investors see the current market as a buying opportunity at the company
level (listed and unlisted) and in respect of individual properties or projects.
To aid comparisons between companies, we divided the set into c.12 geographical
regions, with global and infrastructure as separate sections. Individual regions are
analysed separately subsequently. The main body of the fact book is alphabetical with
one page per company; inevitably this is only an abbreviated summary of each
company.
Several London listed companies are currently seeking (or have already achieved) dual
listings to attract new investors. For example, AIM is not a recognised investment
exchange (RIE), so making it easier to list new companies here, but this non-RIE status
is a barrier to investment for some institutional investors, particularly continental
European funds. A dual listing on Euronext, Frankfurt or Warsaw for example would
widen the likely investor base and help to narrow discounts.
A key difference between companies in the same geographical remit is whether they are
an investor or a developer. The former hold fully let properties (usually commercial
offices, retail or industrial); these normally pay dividends and management is focused
on maximising rent. The latter do not usually pay dividends, have many years before a
project can be exited and are held for capital growth.
Some clients prefer to invest in funds, which are externally managed and have an
independent board of directors to look after shareholders’ interests. These funds have
an annual management fee and performance fee. Other clients prefer trading
companies to funds, especially for development companies, where there is usually less
‘leakage’ from fees and where on the ground managers typically have more financial
incentives.
Several institutions that usually invest in this universe do not seem to have heard of
many of these companies. Some of those we speak to are surprised that there are so
many to choose from and that the global reach is so wide. Most of our universe is new:
the first AIM listed, non-UK company launched in March 2005. Most were launched
by a small group of stockbrokers to a small list of mostly UK based institutions. Since
launch, brokers have not significantly widened the net of shareholders in these
companies. Often fund managers complain to us of no/little after IPO sales or
research support once the sponsor has secured its launch fee. (3%-5% launch costs are
typical compared with secondary dealing commission of less than 0.5%). There has also
been significant turnover of staff at brokers that cover these stocks (UBS, Teather &
Greenwood, Bridgewell, Collins Stewart, Dresdner Kleinwort Benson, Arbuthnot,
KBC Peel Hunt) leading to periods of little analyst coverage of news and a dearth of
research on these companies.
In the UK, the first property funds launched from 2002 onwards and were set up as
offshore investment companies, usually based in the Channel Islands, to avoid tax. This
trend took place before the UK introduced its own REITs regime. The success of the
offshore route triggered the UK to bring forward the introduction of UK REITs to
prevent all UK property companies moving offshore. Several pension funds, fund
managers and banks offloaded their UK commercial properties (partly to comply with
the Basel II accord, see below) into newly listed property investment companies. Thus,
they were fully invested from the start and paying dividends. In many cases, the issuing
company retained a significant shareholding. Private investors and their advisers were
delighted with these issues. The Investment Management Association (IMA)
recommended that private clients should have an allocation of their portfolios in to
property for diversification and risk reduction. New launches traded at premia, which
Layout of this book
Funds versus trading
companies
Why do we write this?
History of the UK-listed
sector from 2002
Who is this report aimed at?
Building the Future Autumn 2008
20
encouraged further launches. Over £2bn was raised for new listed UK property funds
in the three years from 2002-2005.
Moreover, there was a boom time in open-ended funds that invested in UK property.
Significant new money was raised here too (readers may remember the much publicised
launch of New Star’s UK property fund). This trend created significant buying demand
for UK commercial properties. Property prices were pushed up, further fuelling fund
inflows from private clients and pension funds. Eventually, property values rose to
levels where the rental yield fell below the yield on UK risk free gilts; this was a clear
signal that prices had risen too far. The meteoric rise turned into a catastrophic fall.
Many open-ended funds were forced to suspend redemptions, as they were unable to
sell properties quick enough to finance exits. Even now, many of these funds are still
forced sellers of UK property. Unfortunately, the timing is poor given the recession.
Occupiers in all sectors (retail, industrial and offices) are under pressure. Vacancies are
rising and rents are falling. Buyers are staying away and larger transactions are non-
existent. Values will continue to be marked down until buyers start to come forward.
None of the fund managers to whom we speak is predicting an improving situation
until 2010.
Basel II is a voluntary accord agreed between international banks in developed markets.
The Basel Committee on Banking Supervision published the agreed text in June 2004
with the aim of revising the standards governing the capital adequacy of internationally
active banks. This accord requires banks and other deposit takers to use fair or market
value for their assets. This requirement has led to the securitisation of property
portfolios in the UK (a listed share has a market price so can be valued daily as
opposed to a portfolio of hundreds of buildings which at best are valued only
quarterly). The fair value approach also led in part to securitisations of mortgage
portfolios, but that is another story. The EU enshrined the principles of Basel II in a
banking law, which became effective on January 1 2008. Other countries have adopted
it too: India joined in April 2008 and its banks must comply by April 1 2009; US banks
must comply by January 2009.
Once the listed market became saturated with UK property companies, and premium
ratings fell to discounts, new fund launches began to focus on overseas property. First,
into western Europe and then further east: central and eastern Europe (CEE), south-
eastern Europe (SEE), Ukraine and Russia. A similar trend in the Far East: India,
China and Vietnam. Several countries had more than one rival issue, often trying to
launch at the same time. To attract new money, these new funds not only had to have a
different geographical remit but also had to offer better terms.
Typically, the first entrant into a new market could charge more (in terms of fees), and
get away with being less experienced: overall returns were geared more toward the
manager than shareholders. Second and later launches had to be more attractive than
previous ones to encourage new investors. These later ones tend to have better
managers, lower fees and returns are more aligned to shareholders’ interests. For
example, earlier funds had launch costs of 5%, 2% annual management fees (including
fees based on uninvested cash) and performance fees based on value increases. Later
launches offered better terms such as 3% launch costs, 1% management fees and a
performance fee based on shareholders’ returns and not on NAV.
Current best practice is to have: local based and experienced managers with a good
track record; a portfolio with some initial assets (i.e. not a blind pool); a focus on giving
a return to shareholders either through dividends or a fixed wind up date; managers’
interests that are aligned with those of shareholders. For example, performance fees
should depend on cash returns to shareholders and a proportion of the managers’ fee
should be paid in shares or held back until the wind up. Attention also needs to be
given on how to address the discount between the share price and the NAV. Wide
discounts now are discouraging new issues and private placement is the preferred
route. AIM is perceived as bringing illiquidity. Euronext or dual listing on a local
exchange is being explored by several companies.
Basel II
Sector expands to
non-UK property
Shareholders demand better
terms
Current best practice
Open-ended funds
Values rise and fall
Autumn 2008 Building the Future
21
Most new launches over the last six years have focused on the same small band of
shareholders, often less than twenty. Typically, these are large, UK-based funds of
funds or hedge funds. This grouping was a rich and easy seam for the issuing brokers’
sales team to tap. Secondary sales were insufficient to widen the shareholder base.
Consequently, the share registers of many companies is small and each holder holds a
large amount of shares.
Some of the original shareholders have had their own problems in the last six months –
either facing redemptions or more stringent banking requirements. This situation has
required them to sell positions, even if they are still believers in the ability of the fund
manager or CEO and of the sector in which he invests. Forced sellers have included
property unit trusts facing redemptions from private clients; holders who are selling in
a perceived flight to quality; and hedge funds where access to credit lines has been
restricted. Large real estate transactions have dried up. There are few cash rich
institutions around; those there are see no rush to buy when property prices are still
forecast to fall. Selling pressure predominates, new buyers have not been found and
discounts have widened.
The widening discount has attracted a newer set of activist shareholders. They use the
arbitrage between the discount and an index that represents the underlying assets as
nearly as possible. They make money by narrowing the discount even if asset values are
falling. They are usually not long-term investors. Their modus operandi is typically to
get the company to sell assets and to return cash to shareholders and may ultimately
lead to a wind-up of the company.
New long-term investors that are currently attracted to the listed sector are cash rich
investors, for example, sovereign wealth funds of oil rich nations. These buyers usually
prefer to buy direct property or real estate/infrastructure projects but the current wide
discounts in the listed market present a much cheaper way to invest.
Gearing
Property portfolios of fully let investment properties had been geared up,
usually to 70% as the gap between property yields and bank loan interest rates
meant that the higher the gearing, the better dividend to shareholders. In good
times, this structure meant higher NAV growth at the per equity share level. As
property values fall, in a geared portfolio the NAV falls further. This leads to
an increase in the loan to value (‘LTV’) ratio. Banks stipulate maximum allowed
LTVs (e.g. 85%) and income cover for their loan’s interest (e.g. 150%). These
covenant levels are usually tested only at set times per year (e.g. quarterly). As
the test approaches, managers of companies nearing any breach should be able
to sell assets and repay the loan to stay within the LTV covenant. This process
is sensible when the debt and assets are matched and both are as easy to
liquidate as each other. The current market means that managers cannot de-
gear quickly enough, because they are not able to sell sufficient properties to
repay debt.
In contrast, development projects need access to capital to fund the
construction stage. The availability of this financing has become severely
restricted across the world. Where projects are still able to secure construction
financing, it is usually because the projects are not speculatively built; have a
high proportion of space pre-let; the developer is experienced, well financed
and has a good track record of project completion on time and within budget.
Currently, we see companies’ development project pipelines being severely
curtailed. Companies are focusing only on those projects that already have
financing in place. Investors can get a good idea of the rating of a project and
of its developer by seeing the continued support for the project from the local
bank.
Original shareholders
New shareholders –
activists
New shareholders –
long-term holders
Investment properties
Development projects
Forced sellers
Building the Future Autumn 2008
22
About the fact sheet layout
Each fact sheet contains:
• A summary snap shot of what new investors might need to consider before buying
into a company. This is meant as a first sift only, further work would normally be
required before investing. We have a daily list of current trading data on all
companies – available by email on request;
• A summary of the company’s objective, trading information on LHS;
• An outline of the portfolio: largest assets, geographic and sector breakdown,
manager biography and the investment strategy;
One page per company is necessarily brief. We have more information available on
request. In many cases, we have recently met managers so we have details on current
trading and future prospects. Also, we have annual and interim accounts, prospectuses
and company fact sheets.
It is important also to consider who the shareholders are and their plans for the
company. For example, if 70% is owned by the manager, then minority investors will
clearly not have much influence. If activist short-term shareholders dominate then we
expect boardroom changes and more immediate action to move the share price. If
shareholders are institutions who have trouble with their own investors, then forced
sellers may predominate and the share price may languish. We also have shareholder
information; discounts; share trading volume; and more detail on individual
properties/projects.
Abbreviations
To save space, we have used abbreviations and shorthand throughout:
• Notice period = How much notice is required by the managers of the company to be
removed from office – for example, in a takeover or in a shareholders’ forced wind-
up situation. “3yrs; 1yr” means initially three years’ notice is required from launch
and only one year’s notice thereafter. Normally, the manager is prepared to give up
running the company in less than the full notice period but on payment of an
amount equal to the lost fees.
• AMC = Annual Management Charge. This applies to funds rather than trading
companies. The AMC is usually based on total gross assets (e.g. 2%).
• Performance fee = The fee paid to managers is calculated as a percentage of the gain in
value above a certain return. This should incentivise managers. For example, “20%
of the outperformance of the net assets over a certain hurdle rate”. The hurdle rate
could be a fixed percentage figure or reference to a specific benchmark index. This
gives rise to the common phrase “two and twenty” = 2% annual management fee +
20% performance fee. The details on just about all the companies are different – net
or gross, on distributed returns to shareholders or on audited NAV gain, paid partly
in shares, held back to the end of the life, different AMC if growth is positive than if
negative; high water mark (HWM), based on share price.
We have more detail on the AMC and performance fee for each company which space
necessarily prevents us from showing here. Please contact us if this is required.
Shareholder information
More detail on request
Autumn 2008 23
Listing Details
Bloomberg 3IN LN
Exchange LSE
ISIN JE00B1RJLF86
Domicile Jersey
Launch date 13-Mar-07
Market value £778.55m
Market value US$1,189.78m
Investment Focus
Geography Europe – North America – Asia
Strategy Investor
Sector Infrastructure
Current Trading
Price 96.00p
NAV per share 108.60p
NAV date 31-Mar-08
NAV frequency H
Next NAV announced 22-Nov-08
Discount -11.6%
Dividend yield 2.06%
Share Price & NAV Since Launch
80
85
90
95
100
105
110
115
120
Mar-07 Mar-08
Source: Proquote and Libertas Capital
Assets
No. of properties/projects 9
Total assets £784.8m
Cash £253.7m
% cash 32.3%
Loans £0.0m
Gross gearing 0.0%
Net gearing -32.3%
Management
Company structure Fund
Management group 3i investments plc
Annual fee 1.5%
Performance fee 20% over 8%
Management notice period 1yr
Key individual Michael Queen
Tel. +44 (0)7975 3572
E-mail michael.queen@3i.com
Valuer Own valuation
Website www.3i-infrastructure.com
3i Infrastructure plc
Company Summary
3i Infrastructure plc (3IN) is a Jersey-incorporated investment company that invests in infrastructure businesses and
assets. It was admitted to the LSE on March 13 2007 and became a constituent of the FTSE 250 index on September
24 2007. 3i Infrastructure aims to build a diversified portfolio of infrastructure investments across the globe, with an
initial focus on Europe, North America and Asia. Fundraising: £703m at IPO in March 2007; £115m in July 2008.
Analyst’s Comment
3IN is cash-rich and has been able to invest in debt instruments at low prices, given the current state of the credit
market. It does not have a problem with over gearing, nor restricted access to financing. 3IN has a good dividend
policy and has increased the interim by 5% to 2.1p. Its assets are relatively mature and most are in the income
producing stage. We believe there is every chance that 3IN will be able to improve its dividends as more assets
mature and since many of the projects will have revenues that increase in line with inflation. Once fully invested its
dividend target is 5% on opening NAV at IPO of 98p, i.e. 4.9p p.a. This puts the shares on a 5.6% prospective dividend
yield and a 19% discount to current NAV. 3IN is a good haven to weather the current financial storm. (Nov-04-08)
Portfolio Summary
Infrastructure businesses tend to be asset-intensive enterprises that provide essential services over the long term,
often on a regulated basis or with a significant component of revenue and costs that are subject to long-term
contracts.
Portfolio - Top Five Projects
Project Cost
(£m)
Directors'
Valuation
(£m)
Income
(£m)
Asset Total
Return (£m)
Equity
Interest
(%)
Anglian Water 140.0 159.6 8.7 28.3 9
Infrastructure Investors LP 106.1 125.1 10.7 29.7 31.2
Octagon 13.2 13.6 1.2 1.6 26.3
Alpha Schools 0.2 0.3 - 0.1 50
Oystercatcher 84.5 98.3 5.5 19.3 45
Source: 3IN at March 31 2008
Sector Distribution Geographic Distribution Maturity Distribution
Sector % Geography % Maturity %
Utilities 44 UK 70 Mature 53
Social infrastructure 36 Continental Europe 22 Operational growth 38
Transportation 20 Asia 8 Early-stage 9
Source: 3IN at March 31 2008
Investment Manager
Mr Queen joined 3i in 1987 and is currently the Managing Partner of 3i’s infrastructure business after several years as
3i Global Head of Growth Capital. He is part of 3i’s Management Committee. During his time at 3i he has worked in a
number of offices in various roles and, in 1994, he was seconded to HM Treasury to help to develop the potential for
the Private Finance Initiative in the NHS as head of the NHS Private Finance Unit. Mr Queen has invested across a
broad range of sectors, but has a particular focus on healthcare and financial services. He has been closely involved
in the investment decisions for most of the transactions in the overall track record. Mr Queen has a BA (Hons)
Industrial Economics from Nottingham University and is a qualified chartered accountant. He is a member of the
CBI's Financial Services Council. In 2002/2003 he was chairman of the British Venture Capital Association.
Investment Strategy
To create a balanced portfolio 3IN invests in infrastructure assets across the different stages of the asset life cycle,
including assets that are at an early stage of development, most likely to be PFI/PPPs, where the potential for capital
growth exists, but yields tend to be limited until operational ramp up. It also invests in assets, including PPP projects
and privatisations, that are undergoing a period of operational ramp up, following construction, and which generate
yields and capital growth. In addition, 3IN invests in mature assets that are in a steady operational state and generate
predictable returns and yields, often correlated to GDP, with some capital growth.
Autumn 2008 24
Listing Details
Bloomberg ABL LN
Exchange AIM
ISIN GG00B1LB2139
Domicile Guernsey
Launch date 07-Feb-07
Market value £46.80m
Market value US$71.52m
Investment Focus
Geography Budapest – Prague – Bucharest
Strategy Developer
Sector Commercial - Residential
Current Trading
Price 44.75p
NAV per share €4.41
NAV date 30-Jun-08
NAV frequency H
Next NAV announced 26-Mar-09
Discount -88.1%
Dividend yield 0.08%
Share Price & NAV Since Launch
2.9
3.1
3.3
3.5
3.7
3.9
4.1
4.3
4.5
4.7
30
80
130
180
230
280
330
Feb-07 Feb-08
Price(GBX) (L.H.S) NAV(EUR) (R.H.S)
Source: Proquote and Libertas Capital
Assets
No. of properties/projects 54
Total assets €654.2m
Cash €16.7m
% cash 2.6%
Loans €255.0m
Gross gearing 39.0%
Net gearing 36.4%
Management
Company structure Trading
Management group Self-managed
Annual fee n/a
Performance fee n/a
Management notice period n/a
Key individual Uri Heller
Tel. +36 1 225 6600
E-mail avidan@ablon-group.com
Valuer King Sturge
Website www.ablon-group.com
Ablon Group Ltd
Company Summary
Ablon Group Limited (ABL) is a Guernsey-incorporated holding company of a group whose core business is the
sourcing, acquisition, construction, ownership, leasing, servicing and management of a diverse portfolio of
commercial property, and the acquisition, construction and sale of residential properties in Hungary, the Czech
Republic and Romania, primarily in Budapest and Prague. The group employs a ‘build and hold’ strategy for its
commercial properties, which means that it generally retains developments once completed and leases them to
tenants, while residential projects are typically sold once developed. The group believes that it is one of the leading
real estate development businesses in Budapest and it has a well-established presence in Prague. Through the
development of its large and diverse real estate portfolio, the group has obtained significant property development
and management experience, first-hand knowledge of regional markets, relationships and contacts with local
owners, brokers and tenants, and an understanding of the needs and behaviour of public sector and corporate
tenants. In addition, ABL is vertically-integrated along the spectrum of the real estate development value chain from
the sourcing, purchase and construction of projects to the marketing, sale, rental, operation and servicing of its
properties.
Portfolio Summary
As at March 25 2008, ABL’s portfolio comprised properties at 28 different locations, split into 54 different projects or
phases of which there were 13 completed projects and 16 development projects. There were 17 property locations in
Budapest, with a total of 29 phases of development, comprising 11 completed projects (including Zöldváros
Residential Park which had sold 239 out of the 240 flats) and 18 development projects. ABL also has properties at
seven locations in Prague, with a total of ten phases of development, comprising three completed projects and
seven development projects. In Bucharest there are properties at four locations, with a total of twelve phases of
development, comprising twelve development projects.The group also has property at two locations in Poland, with
a total of five phases of development.
Portfolio - Top Five Projects
Project City Sector Area
(sq.m)
Value
(€m)
Completion
Gateway Budapest Office 36,300 80 Yielding
Business centre 99 Budapest Office 53,300 63.2 2011
Kolben Prague Mixed-used 73,000 54.3 2010
Blaha Centre Budapest Hotel 17,700 41.2 -
M3 business centre Budapest Office 18,100 30.8 3Q08
Source: ABL at August 31 2008
Sector Distribution Geographic Distribution
Sector Properties % Geography Properties Value
(€m)
%
Office 12 45 Budapest 17 415 67
Residential 6 23 Prague 6 119 19
Retail 2 7 Bucharest 3 82 13
Hotel 4 14 Warsaw 1 - -
Mixed-use 3 11
Total 27 616 100
Source: ABL at August 31 2008
Investment Manager
Mr Heller was appointed as a director on October 16 2006. Prior to joining the group, he was managing director for
Orlano Ltd / Danly Investments Ltd, an investment company and, from 1990 to 1994, the general manager of the
Danel Group, a residential real estate development company in Israel. Mr Heller has spent more than ten years
developing his expertise in property investment and property development in central and eastern Europe,
specialising in Hungary and the Czech Republic. Mr Heller studied engineering in Israel and is a member of the Israeli
Engineering Association.
Investment Strategy
ABL focuses on execution of current development projects to expand and develop its initial portfolio. It continues to
acquire attractive sites for future commercial property and residential development. In Budapest it seeks to maintain
a leading position and continues to grow its operations in Prague, Bucharest and Poland. The group’s strategy is to
expand operations in other neighbouring markets in major cities where attractive opportunities exist. ABL employs
clearly defined strategies for each operating and business segment and optimises capital structure.
Autumn 2008 25
Listing Details
Bloomberg TAP.LN
Exchange LSE
ISIN GB00B05LNH5
Domicile Guernsey
Launch date 08-Feb-05
Market value £22.13m
Market value US$33.81m
Investment Focus
Geography UK
Strategy REIT
Sector Commercial
Current Trading
Price 15.50p
NAV per share 76.40p
NAV date 30-Sep-08
NAV frequency Q
Next NAV announced 21-Jan-09
Discount -79.7%
Dividend yield 41.93%
Share Price & NAV Since Launch
30
40
50
60
70
80
90
100
110
120
Feb-05 Feb-06 Feb-07 Feb-08
Source: Proquote and Libertas Capital
Assets
No. of properties/projects 75
Total assets £246.1m
Cash £7.3m
% cash 3.0%
Loans £117.7m
Gross gearing 47.8%
Net gearing 44.9%
Management
Company structure Fund
Management group Valad Asset Mgt
Annual fee 0.65%
Performance fee n/a
Management notice period 30/9/2010; 1yr
Key individual Chris Carter Keall
Tel. +44 (0)20 7659 6730
E-mail chris.carterkeall@valad.co.uk
Valuer Cushman & Wakefield
Website www.tapincome.com
Advantage Property Income Trust Ltd
Company Summary
The Advantage Property Income Trust Limited was launched in February 2005 as a high income UK diversified
commercial property company. TAP is a closed-ended property investment company domiciled in Guernsey and
listed on both The Channel Islands and London Stock Exchanges. The property fund advisor is Valad Asset
Management (UK) Ltd, whose mandate is to increase income, grow dividend cover and ultimately dividends. TAP
was launched to provide investors with the opportunity to benefit from investing in commercial property.
Historically, this has not been possible due to the capital size of each asset, the illiquidity of real estate and the
complexity and cost of the management/ownership. TAP was one of the forerunners to the REIT legislation
introduced on January 1 2007. Its foundation has many similarities to the Australian LPT and the US diversified REIT.
Within commercial property portfolios, diversity is the name of the game, with the correct balance between office,
industrial and retail property being important, as market forces affect each sector differently. The company currently
has two separate sources of debt, as shown in the table below.
Analyst’s Comment
Financial highlights as at September 30 2008: £220m property assets; 73 properties; Gearing 53% (LTV); £117m loan
at 5.8% average interest rate; average lease length 6.5 years; void 7.7%; NAV: 76.4p; TAP managers are now focused
on asset management initiatives to increase revenues. Gearing is still high, but beneath its covenants (normally at
around 75% LTV). The shares are on a discount of 69%. However, the managers and their valuers CBRE still paint a
gloomy picture of the outlook for UK commercial property. Whilst we applaud TAP manager’s asset management
initiatives to increase rents, the high gearing will continue to knock the NAV per share. (November 4 2008). TAP is
selling five properties for £4.2m, 1.8% above previous valuation (at June ‘08) and at 6.0% yield. TAP is also repaying
£2.2m of debt. The company’s current strategy is one of selling smaller properties after end of value adding
management initiatives. The portfolio is now £234m. The sale price is above valuation so is NAV enhancing, but there
are likely to be falls in value elsewhere in the portfolio. TAP’s NAV was 87.6p as at 30/6/08, which puts the shares at
52% discount and 15% yield. We applaud the strategy of sales of mature assets and de-gearing. (Oct-7-08)
Portfolio - Largest Properties
Property Location Valuation
%
The Brunel Centre Bletchley 5.34
Waterfront Business Park Fleet 4.81
National Westminster House Guernsey 4.81
Brunswick Point Leeds 4.72
The Links Warrington 4.15
Kingscourt Leisure Complex Dundee 4.03
Silver Court Welwyn Garden City 3.52
Source: Fundamental Data at November 04 2008
Geographic Distribution Sector Distribution
Country % Sector %
South East 36.36 Offices 36.82
Scotland 11.56 Industrial 21.30
East Midlands 10.17 Retail Warehousing 19.89
West Midlands 9.44 Retail 17.96
Yorkshire & Humberside 7.49 Leisure 4.03
North West 6.98
Channel Islands 4.81
Source: Fundamental Data at November 04 2008
Investment Manager
Mr Carter Keall is responsible for fund management of the company's investment portfolio. He has over 18 years’
experience in the commercial property investment market, with the past ten years spent managing over £1.5bn of
assets at Arlington and Hammerson. He is an active member of the Investment Property Forum and gained his
honours degree at the University of the South Bank. He was formerly director of fund management, accountable for
the Arlington Business Park Partnership and latterly the UK direct mandate for a Middle Eastern Investor.
Investment Strategy
TAP invests in a diversified portfolio of commercial property in the United Kingdom and the Channel Islands.
Autumn 2008 26
Listing Details
Bloomberg AFID LI
Exchange TASE & LSE
ISIN US00106J2006
Domicile Cyprus
Launch date 01-Aug-07
Market value £254.83m
Market value US$373.60m
Investment Focus
Geography Russia
Strategy Developer
Sector Commercial – Residential
Current Trading
Price 117.00
NAV per share US$12.10
NAV date 30-Jun-08
NAV frequency H
Next NAV announced 25-Mar-09
Discount -96.1%
Dividend yield 0.5%
Share Price & NAV Since Launch
0
2
4
6
8
10
12
14
Aug-07 Aug-08
Source: Proquote and Libertas Capital
Assets
No. of properties/projects 34
Total assets US$2,952.3m
Cash US$796.0m
% cash 27.0%
Loans US$350.2m
Gross gearing 11.9%
Net gearing -15.1%
Management
Company structure Trading
Management group Self-managed
Annual fee n/a
Performance fee n/a
Management notice period n/a
Key individual Alexander Khaldey
Tel. +7 495 796-99-88
E-mail dandrienko@sik.ru
Valuer Jones Lang Lasalle
Website www.afi-development.net
AFI Development plc
Company Summary
AFI Development plc (AFID) develops multi-purpose properties in and around Moscow, St Petersburg, Perm and
Volgograd. AFID develops and redevelops high quality commercial and residential real estate assets including
offices, shopping centres, hotels, mixed-use properties, and residential projects. Its strategy is to sell the residential
properties it develops and to either lease the commercial properties or sell them for a favourable return. The GDRs of
the company listed on the LSE in May ‘07 raising a total of US$1.4bn. AFID’s controlling shareholder is Africa Israel
Investments Ltd, an international real estate investment and development group based in Israel with over 70 years'
experience in real estate development. Incorporated in Cyprus in 2001, AFID is currently one of the few developers in
Russia building large-scale, integrated and high profile commercial and residential properties to international
standards. AFID has a portfolio of existing Russian development projects, a substantial pipeline of other real estate
investment opportunities across Russia and a strong management team, comprising local professionals and
international real estate experts.
Analyst’s Comment
Market outlook: Over 1H08 foreign and domestic investors continued to show strong interest in commercial and
residential real estate market segments thanks to the growth of confidence in the Russian economy, high demand
from tenants, and the shortage of available premises on the market, with most interest centred on Moscow.
According to the real estate forecast in the ‘Emerging Trends in Real Estate Europe 2008’* Moscow ranked first
among this year's top real estate markets in Europe for both investment and development prospects. Reduced
money supply caused by the global credit tightening and recent withdrawal of western investors from the market
should mean focus is increased on the larger, higher quality and less risky projects.
Demand for new quality properties in Moscow far exceeds the supply. AFID has 34 projects in 20 locations, which
have a combined market value on completion of US$22bn. This is one of the largest London-listed Russian property
developers and has a diversified spread of projects. As there is increasing concern about western ownership of
directly held assets (whether real estate or private equity), investors should consider getting their exposure to Russia
via investing in London-listed AFID. AFID reports a significant slowdown in residential apartment sales. It has scaled
back plans for future projects and, having more cash than needed for the remaining three core projects, will be
returning $200m to investors. AFID is in a good financial position, which cannot be said of other over-geared Russian
developers. The market fundamentals seem to have turned, but AFID looks like it will survive. (Nov-19-08)
Portfolio Summary
AFID’s portfolio comprises 34 residential, commercial and mixed-use real estate projects in 20 locations in Russia and
Ukraine, with over 3.8 million sq.m under development. 90% of AFID’s projects are based in Moscow. The projects
include office, retail and residential premises, multi-functional complexes and hotels. Results for 9M to 30/9/08:
profits down 67% to US$28m; strong liquidity position, cash of US$569m; construction of core projects on schedule;
general slowdown of rental demand; significant slowdown of residential apartment sales; $200m special dividend
($0.38 p/share) after scaling back future development plans. Cash in excess of short-term liabilities.
Portfolio - Largest Properties
Property Portfolio (%) Net Assets (%) Value (US$m)
Moscow City Centre, Shopping Centre 21.44 19.93 1,264.00
Kuntsevo 12.15 11.30 716.68
Tverskaya Zastava, Plaza I 8.42 7.82 496.35
Tverskaya Zastava, Plaza IV 7.68 7.14 453.05
Tverskaya Zastava, Plaza II 7.05 6.55 415.48
Otradnoye 6.91 6.42 407.35
Tverskaya Zastava, Shopping Centre 5.32 4.94 313.50
Source: Fundamental Data at June 30 2008
Portfolio Distribution
Country % Value (US$m)
Cash 21 569
Investment Properties 9 241
Developments 51 1,411
Total Assets 100 2,760
Source: AFID at September 30 2008
Investment Manager
Mr Khaldey is a director and the CEO of AFID. He has served as CEO of Stroyinkom-K since March 2001. He co-
founded AFI Development plc and owns a 9% stake in the company through Nirro Group S.A. He has over 30 years’
experience, including work at the Zhiliiproekt Institute and the Ukrspetssatalkonstruktsia Construction Union. He
graduated from Dneprepetrovsk Metallurgical Insitute in 1973, with a degree in Industrial Heat Power Engineering.
Investment Strategy
AFID develops integrated large-scale and complex projects in attractive locations, which generate better returns and
increase the overall value for the neighborhood. AFID sells residential property and keep-to-operate commercial
property. In addition, it continues to acquire and fund real estate developments that meet its project evaluation
criteria and enhance the number of projects in different development phases.
*Published by the Urban Land Institute (ULI) and PricewaterhouseCoopers LLP recently.
Autumn 2008 27
Listing Details
Bloomberg AISI LN
Exchange AIM
ISIN CY0100441019
Domicile Cyprus
Launch date 01-Aug-07
Market value £10.09m
Market value US$15.42m
Investment Focus
Geography Ukraine
Strategy Investor
Sector Commercial – Residential
Current Trading
Price 5.25p
NAV per share US$0.74
NAV date 30-Jun-08
NAV frequency H
Next NAV announced 01-May-09
Discount -89.2%
Dividend yield -
Share Price & NAV Since Launch
0.6
0.62
0.64
0.66
0.68
0.7
0.72
0.74
0.76
0.78
0.8
0
5
10
15
20
25
30
35
40
45
50
Aug-07 Aug-08
Price(GBX) (L.H.S) NAV(USD) (R.H.S)
Source: Proquote and Libertas Capital
Assets
No. of properties/projects 5
Total assets US$147.2m
Cash US$6.7m
% cash 4.6%
Loans US$0.1m
Gross gearing 0.1%
Net gearing -4.5%
Management
Company structure Fund
Management group Aisi Realty Capital
Annual fee 2.5%
Performance fee 20% over 15% hurdle
Management notice period -
Key individual Beso Sikharulidze
Tel. +380 44 459 3000
E-mail Beso@aisicapital.com
Valuer DTZ
Website www.aisicap.com
Aisi Realty Public Ltd*
Company Summary
Aisi Realty Public Limited (AISI), a closed-ended investment company incorporated in Cyprus, was established in June
2005 to make investments in the real estate market in Ukraine. The company was set up with the intention of
providing shareholders with attractive returns, principally from capital appreciation through investment in real
estate development projects and related investments, principally in and around the major population centres of
Ukraine, with a particular focus on Kiev. AISI's assets are managed by Aisi Realty Capital LLC, a Boston-based
investment management company with a presence in Kiev. The Investment Manager intends to capitalise on its local
knowledge of the region and real estate development experience to: source real estate investment opportunities
(including development projects) at attractive prices; manage and oversee these investments; and structure and
execute appropriate exit strategies.
Analyst’s Comment
AISI, a real estate developer in Ukraine, focused on Kiev, is a £46m market value investment company which listed on
AIM in August 2007. AISI has four development projects, with ten others in the pipeline. The valuation of current
investment projects is up 59% in just six months to US$90m, with total assets at US$143m.
(Oct ‘08) Projects update: The most important project is the 49,200 sq.m Brovary Logistic Centre. It is 27km to the
north-east of Kiev, near Boryspil international airport on the Kiev-Moscow highway. This will be one of the first Class
A logistics warehouses in Ukraine. Construction work will be completed by the end of 2008 and final fitting-out for
the tenant shortly afterwards, and will be occupied by February 2009. The single tenant is UVK, a leading Ukrainian
logistics operator, which has signed a ten year lease. Now that this project is nearly finished and fully tenanted AISI
has been arranging banking finance. The new loan will total US$37.3m from the European Bank of Reconstruction
and Development (EBRD), although half of this will be syndicated to other banks. This will free up c.US$35m to be
recycled into existing and/or pipeline projects. The estimated construction costs for the Brovery project are now
US$53m, including VAT. Once occupied and income producing (c.13% yield p.a.), this project will be ready for sale.
The other project in Odessa should complete in October 2009.
(Oct ‘08) Ukraine economy comment: The IMF has in principle agreed a US$16bn loan to Ukraine (the fact that it is to
the IMF that the country turned for help shows how pro-West the Ukraine has moved). How beneficial this will be for
the country depends on what strings are attached. The transaction still needs to be approved by Ukraine’s
government, but this was recently dissolved. New elections originally scheduled for early December may be brought
forward to speed this loan approval process.
(Oct ‘08) AISI’s financing needs: AISI itself has no debt and so is not geared into falling prices. (Oct-27-08)
Portfolio - Significant Projects
Projects Sector Location GFA
(sq.m)
Project
Cost ($m)
Completion
Kyanivsky Lane Residential/Office Kiev 27,890 68 2H10
Brovary Logistic Centre Warehouse Kiev 49,180 53 2H08
Tsymlianskogo Lane Residential/Office Kiev 7,134 18 2H09
Bela Logistic Park Warehouse Odessa 103,000 109 2H09
Podil Residential/Office Kiev 37,900 78 2H10
Source: AISI at June 30 2008
Geographic Distribution
Country % Value (US$m)
Ukraine 103.12 127.949
Source: Fundamental Data at June 30 2008
Investment Manager
Mr Sikharulidze was one of the founding principals of the Investment Manager. For 13 years he was a portfolio
manager at Fidelity Investments, where he developed significant investment experience in diverse geographic
regions. He held a wide range of positions at Fidelity Investments, including Portfolio Manager for Fidelity Health
Care, Fidelity Advisor Health Care Funds, Fidelity Convertible Securities Fund, Fidelity Advisor Aggressive Growth
Fund and Fidelity Mid-Cap Stock Fund. Mr Sikharulidze holds a BSc in Mechanical Engineering from Georgia Institute
of Technology and an MBA from Harvard Business School. Mr Sikharulidze’s particular areas of responsibilities, in
addition to ensuring the overall success of the investments, are: fund-raising, Initial evaluation of possible sites.
Investment Strategy
Aisi Realty Public Limited is engaged in the principal activity of making investments in the real estate market in
Ukraine. The company focuses primarily on the capital city, Kiev. In May 2007 AISI sold Aisi Taurus LLC and its interest
in the Tarasovskaya project. In September 2007 it acquired an outdoor advertising company.
*Libertas Capital is NOMAD and broker to this company.
Autumn 2008 28
Listing Details
Bloomberg ALPH LN
Exchange LSE
ISIN GB00B0P6FY18
Domicile Guernsey
Launch date 29-Nov-05
Market value £52.29m
Market value US$79.91m
Investment Focus
Geography France – Spain
Strategy Investor – REIT
Sector Commercial – Residential
Current Trading
Price 44.50p
NAV per share 82.00p
NAV date 30-Sep-08
NAV frequency Q
Next NAV announced 10-Mar-09
Discount -45.7%
Dividend yield 12.36%
Share Price & NAV Since Launch
30
40
50
60
70
80
90
100
110
120
Dec-05 Jan-07 Jan-08
Source: Proquote and Libertas Capital
Assets
No. of properties/projects 19
Total assets £326.5m
Cash £25.6m
% cash 7.8%
Loans £193.0m
Gross gearing 59.1%
Net gearing 51.3%
Management
Company structure Fund
Management group Alpha Real Capital
Annual fee 1% of gross assets
Performance fee 20% over 12%; 35% over 20%
Management notice period 8yrs; 8yrs
Key individual Phillip Rose
Tel. +44 (0)20 7591 1637
E-mail mary-annlitchfield@alpharealcapital.com
Valuer Knight Frank
Website www.alphapyreneestrust.com
Alpha Pyrenees Trust Ltd
Company Summary
Alpha Pyrenees Trust Limited (ALPH) is a closed-ended investment company. ALPH carries on business as a property
investment company, investing in commercial property in France and Spain, and owns a diversified portfolio of
approximately £274m. Of the total property portfolio, 88% is invested in France and 12% in Spain in terms of capital
value.
Analyst’s Comment
ALPH has a portfolio value c.£300m in c.20 commercial investment properties in France and Spain, with a 7.5%
portfolio yield and average lease length of around five years. Its tenant quality is high (more than 80% of the income
is from ‘prime’ tenants), so its revenue stream looks secure. Like other property investment companies, ALPH is
highly geared but this is comfortably below its bank loan covenant ceiling of 85% LTV. The £193m debt is well-
structured, with a low interest rate of 5.26% fixed to 2015. The combination of low interest rates on its loan and high
rental yields on its portfolio means that ALPH can pay a good dividend: 7p is forecast for the full year. The managers
remain cautious on taking out more loans and on buying new properties, by which they mean property values are
going to carry on falling through 2008. (Sept-08-08)
Portfolio Summary
ALPH owns a portfolio of fifteen properties in France and four properties in Spain, totalling approximately 260,000
sq.m (approximately 2.77 million sq.ft) of commercial real estate. The properties are well let, well located and offer
good value accommodation to occupiers. The valuation of this portfolio as at June 30 2008 showed a total of
approximately £281m (€355m).
Portfolio - Largest Properties
Property Portfolio
(%)
Net Assets
(%)
Value (£m)
Villarceauz Nozy Business Park 38.19 99.9 107.2
Aubervilliers Offices 7.23 19.92 20.3
Cordoba Retail Park (Spain) 6.27 17.27 17.6
Goussainville Offices 6.02 16.58 16.9
Champs sur Marne Offices 5.02 13.83 14.1
St Cyr L'Ecole 4.42 12.17 12.4
Athis Mons 3.85 10.6 10.8
Source: Fundamental Data at June 30 2008
Sector Distribution Geographic Distribution
Sector % Country % Value
(£m)
Industrials 27 Cash & Fixed Interest 3.53 10.276
Office 64 France 85.23 248.000
Shopping Centres 9 Spain 11.24 32.700
Source: Fundamental Data at June 30 2008
Investment Manager
Mr Rose has over 25 years’ experience in the real estate, fund management and banking industries in Europe, the
USA and Australasia. He has been the head of real estate for ABN AMRO Bank, chief operating officer of the European
shopping centre investor and developer TrizecHahn Europe, managing director of Lend Lease Global Investment and
executive manager of the listed fund General Property Trust. Mr Rose is currently a non-executive director of Great
Portland Estates and a member of the management committee of the Hermes Property Unit Trust. Alpha Real Capital
is an FSA-regulated property fund advisory business. It complements its own international investment, development
and asset management skills by working, where appropriate, with local real estate partners in India.
Alpha Real Capital seeks to generate high total returns for the company’s investors. It believes these will be
generated by a combination of profit from development activity, income yield and capital growth driven by income
growth, active asset management and yield compression in the investments it makes. Alpha Real Capital is owned
jointly by Sir John Beckwith and the Alpha team. The Alpha team has extensive operating experience of investing,
financing, developing and managing real estate throughout Europe, USA and Pacific including UK, France, Spain,
Italy, Germany, Austria, Netherlands, Portugal, Greece, Poland, Hungary, Czech Republic, Slovakia, Japan, Singapore,
Hong Kong, Indonesia, Thailand and Australia.
Investment Strategy
ALPH generates returns for investors through acquiring real estate with yields in excess of its cost of borrowing,
which has the potential for income growth and/or enhanced returns from active asset management. The company
generally targets properties with low vacancy levels, solid tenant covenants strength and good re-letting potential .
Building_the_Future_Dec08_lowres

More Related Content

What's hot

Vækstfonden an overview
Vækstfonden an overviewVækstfonden an overview
Vækstfonden an overview
Vaekstfonden
 
Chapter11 International Finance Management
Chapter11 International Finance ManagementChapter11 International Finance Management
Chapter11 International Finance Management
Piyush Gaur
 
Reed Smith Richard Burton
Reed Smith Richard BurtonReed Smith Richard Burton
Reed Smith Richard Burton
SAVE AMERICA ONE MORTGAGE AT A TIME
 
ML Capital_AIFMD Helping to Reinforce the UCITS Brand
ML Capital_AIFMD Helping to Reinforce the UCITS BrandML Capital_AIFMD Helping to Reinforce the UCITS Brand
ML Capital_AIFMD Helping to Reinforce the UCITS Brand
john lowry
 
Chapter1 IFM
Chapter1 IFMChapter1 IFM
Chapter1 IFM
Piyush Gaur
 
International financing options access to capital markets and financing options
International financing options access to capital markets and financing optionsInternational financing options access to capital markets and financing options
International financing options access to capital markets and financing options
AparrajithaAriyadasa
 
Zimbabwe Rising Conference 2010 -Richard Webster-Smith - London Stock Exchang...
Zimbabwe Rising Conference 2010 -Richard Webster-Smith - London Stock Exchang...Zimbabwe Rising Conference 2010 -Richard Webster-Smith - London Stock Exchang...
Zimbabwe Rising Conference 2010 -Richard Webster-Smith - London Stock Exchang...
countryfactor
 
International capital movement
 International capital movement  International capital movement
International capital movement
hiteshkrohra
 
Invesco Final Draft
Invesco Final DraftInvesco Final Draft
Invesco Final Draft
Eli Hogan
 
Workshop about hedge funds industry
Workshop about hedge funds industryWorkshop about hedge funds industry
Workshop about hedge funds industry
Davide Zari
 
International financing options
International financing optionsInternational financing options
International financing options
sharmahitanshu
 
Introduction To Tap Strategies Slideshare
Introduction To Tap Strategies SlideshareIntroduction To Tap Strategies Slideshare
Introduction To Tap Strategies SlideshareTAPStrategies
 
FOREIGN CAPITAL
FOREIGN CAPITALFOREIGN CAPITAL
FOREIGN CAPITAL
Soumeet Sarkar
 
Credit suisse 2013 investor survey report final
Credit suisse 2013 investor survey report finalCredit suisse 2013 investor survey report final
Credit suisse 2013 investor survey report final
Brian Shapiro
 
Data digest european fund market mid-year review 2016
Data digest european fund market mid-year review 2016Data digest european fund market mid-year review 2016
Data digest european fund market mid-year review 2016
Jerome Couteur
 
Investment sectors in india
Investment sectors in indiaInvestment sectors in india
Investment sectors in india
Anamika Tarafdar
 
Core Port. Definitions
Core Port. DefinitionsCore Port. Definitions
Core Port. Definitions
John_Nuckel1
 
A study on hedging effectiveness in index future
A study on hedging effectiveness in index futureA study on hedging effectiveness in index future
A study on hedging effectiveness in index future
Krishnaprabhu Jegadeesan
 
Preparing for Protectionism
Preparing for ProtectionismPreparing for Protectionism
Preparing for Protectionism
Andrea Iannelli
 
Legacy Education Alliance, Inc Investor Presentation
Legacy Education Alliance, Inc Investor PresentationLegacy Education Alliance, Inc Investor Presentation
Legacy Education Alliance, Inc Investor Presentation
RedChip Companies, Inc.
 

What's hot (20)

Vækstfonden an overview
Vækstfonden an overviewVækstfonden an overview
Vækstfonden an overview
 
Chapter11 International Finance Management
Chapter11 International Finance ManagementChapter11 International Finance Management
Chapter11 International Finance Management
 
Reed Smith Richard Burton
Reed Smith Richard BurtonReed Smith Richard Burton
Reed Smith Richard Burton
 
ML Capital_AIFMD Helping to Reinforce the UCITS Brand
ML Capital_AIFMD Helping to Reinforce the UCITS BrandML Capital_AIFMD Helping to Reinforce the UCITS Brand
ML Capital_AIFMD Helping to Reinforce the UCITS Brand
 
Chapter1 IFM
Chapter1 IFMChapter1 IFM
Chapter1 IFM
 
International financing options access to capital markets and financing options
International financing options access to capital markets and financing optionsInternational financing options access to capital markets and financing options
International financing options access to capital markets and financing options
 
Zimbabwe Rising Conference 2010 -Richard Webster-Smith - London Stock Exchang...
Zimbabwe Rising Conference 2010 -Richard Webster-Smith - London Stock Exchang...Zimbabwe Rising Conference 2010 -Richard Webster-Smith - London Stock Exchang...
Zimbabwe Rising Conference 2010 -Richard Webster-Smith - London Stock Exchang...
 
International capital movement
 International capital movement  International capital movement
International capital movement
 
Invesco Final Draft
Invesco Final DraftInvesco Final Draft
Invesco Final Draft
 
Workshop about hedge funds industry
Workshop about hedge funds industryWorkshop about hedge funds industry
Workshop about hedge funds industry
 
International financing options
International financing optionsInternational financing options
International financing options
 
Introduction To Tap Strategies Slideshare
Introduction To Tap Strategies SlideshareIntroduction To Tap Strategies Slideshare
Introduction To Tap Strategies Slideshare
 
FOREIGN CAPITAL
FOREIGN CAPITALFOREIGN CAPITAL
FOREIGN CAPITAL
 
Credit suisse 2013 investor survey report final
Credit suisse 2013 investor survey report finalCredit suisse 2013 investor survey report final
Credit suisse 2013 investor survey report final
 
Data digest european fund market mid-year review 2016
Data digest european fund market mid-year review 2016Data digest european fund market mid-year review 2016
Data digest european fund market mid-year review 2016
 
Investment sectors in india
Investment sectors in indiaInvestment sectors in india
Investment sectors in india
 
Core Port. Definitions
Core Port. DefinitionsCore Port. Definitions
Core Port. Definitions
 
A study on hedging effectiveness in index future
A study on hedging effectiveness in index futureA study on hedging effectiveness in index future
A study on hedging effectiveness in index future
 
Preparing for Protectionism
Preparing for ProtectionismPreparing for Protectionism
Preparing for Protectionism
 
Legacy Education Alliance, Inc Investor Presentation
Legacy Education Alliance, Inc Investor PresentationLegacy Education Alliance, Inc Investor Presentation
Legacy Education Alliance, Inc Investor Presentation
 

Viewers also liked

PGUR 5283
PGUR 5283PGUR 5283
Oberserve
OberserveOberserve
Oberserve
makliker
 
Obervation lab
Obervation labObervation lab
Obervation lab
Jason Frank
 
Customer experience analytics
Customer experience analyticsCustomer experience analytics
Customer experience analytics
Adam Maghrouri
 
LWC Presentation Extract @ Zak Precast Concrete India Conference - India
LWC Presentation Extract @ Zak Precast Concrete India Conference - IndiaLWC Presentation Extract @ Zak Precast Concrete India Conference - India
LWC Presentation Extract @ Zak Precast Concrete India Conference - India
Zak Trade Fairs & Exhibitions Pvt. Ltd.
 
Fundamental Cloud Security
Fundamental Cloud SecurityFundamental Cloud Security
Fundamental Cloud Security
Mohammed Sajjad Ali
 
Aos Group press pack
Aos Group press packAos Group press pack
Aos Group press pack
Fred-Anton Knoop
 
Who am i bread
Who am i   breadWho am i   bread
Who am i bread
Alexandra Gauchía
 
Simple present+present continuous
Simple present+present continuousSimple present+present continuous
Simple present+present continuous
Dora Kouri
 
Verbos irregulares
Verbos irregularesVerbos irregulares
Verbos irregulares
marianamarttins
 
第2回ゆかむ勉強会
第2回ゆかむ勉強会第2回ゆかむ勉強会
第2回ゆかむ勉強会Yukamu Tomita
 
Penjajahan ala freeport
Penjajahan ala freeportPenjajahan ala freeport
Penjajahan ala freeportyance iyai
 
Paying attention
Paying attentionPaying attention
Paying attention
Hellen Bwesigye
 
Apadrinament lector ESC Collserola
Apadrinament lector ESC CollserolaApadrinament lector ESC Collserola
Apadrinament lector ESC Collserolacrpsantcugat
 
Is terrorism just a polemical label ?
Is terrorism just a polemical label ?Is terrorism just a polemical label ?
Is terrorism just a polemical label ?
Yasir Dil
 
586 E. Oakridge,Ferndale,Forsale1
586 E. Oakridge,Ferndale,Forsale1586 E. Oakridge,Ferndale,Forsale1
586 E. Oakridge,Ferndale,Forsale1
Julie Thayer
 
Skywayshealthcare
SkywayshealthcareSkywayshealthcare
Web 2.0 tools portfolio
Web 2.0 tools portfolioWeb 2.0 tools portfolio
Web 2.0 tools portfolio
cwang16014
 
global-500-greenhouse-gases-performance-trends-2010-2013
global-500-greenhouse-gases-performance-trends-2010-2013global-500-greenhouse-gases-performance-trends-2010-2013
global-500-greenhouse-gases-performance-trends-2010-2013
John Moorhead
 
Rachael powerpoint
Rachael powerpointRachael powerpoint
Rachael powerpoint
Soniateacher
 

Viewers also liked (20)

PGUR 5283
PGUR 5283PGUR 5283
PGUR 5283
 
Oberserve
OberserveOberserve
Oberserve
 
Obervation lab
Obervation labObervation lab
Obervation lab
 
Customer experience analytics
Customer experience analyticsCustomer experience analytics
Customer experience analytics
 
LWC Presentation Extract @ Zak Precast Concrete India Conference - India
LWC Presentation Extract @ Zak Precast Concrete India Conference - IndiaLWC Presentation Extract @ Zak Precast Concrete India Conference - India
LWC Presentation Extract @ Zak Precast Concrete India Conference - India
 
Fundamental Cloud Security
Fundamental Cloud SecurityFundamental Cloud Security
Fundamental Cloud Security
 
Aos Group press pack
Aos Group press packAos Group press pack
Aos Group press pack
 
Who am i bread
Who am i   breadWho am i   bread
Who am i bread
 
Simple present+present continuous
Simple present+present continuousSimple present+present continuous
Simple present+present continuous
 
Verbos irregulares
Verbos irregularesVerbos irregulares
Verbos irregulares
 
第2回ゆかむ勉強会
第2回ゆかむ勉強会第2回ゆかむ勉強会
第2回ゆかむ勉強会
 
Penjajahan ala freeport
Penjajahan ala freeportPenjajahan ala freeport
Penjajahan ala freeport
 
Paying attention
Paying attentionPaying attention
Paying attention
 
Apadrinament lector ESC Collserola
Apadrinament lector ESC CollserolaApadrinament lector ESC Collserola
Apadrinament lector ESC Collserola
 
Is terrorism just a polemical label ?
Is terrorism just a polemical label ?Is terrorism just a polemical label ?
Is terrorism just a polemical label ?
 
586 E. Oakridge,Ferndale,Forsale1
586 E. Oakridge,Ferndale,Forsale1586 E. Oakridge,Ferndale,Forsale1
586 E. Oakridge,Ferndale,Forsale1
 
Skywayshealthcare
SkywayshealthcareSkywayshealthcare
Skywayshealthcare
 
Web 2.0 tools portfolio
Web 2.0 tools portfolioWeb 2.0 tools portfolio
Web 2.0 tools portfolio
 
global-500-greenhouse-gases-performance-trends-2010-2013
global-500-greenhouse-gases-performance-trends-2010-2013global-500-greenhouse-gases-performance-trends-2010-2013
global-500-greenhouse-gases-performance-trends-2010-2013
 
Rachael powerpoint
Rachael powerpointRachael powerpoint
Rachael powerpoint
 

Similar to Building_the_Future_Dec08_lowres

Mishkin fmi9ge ppt_c02
Mishkin fmi9ge ppt_c02Mishkin fmi9ge ppt_c02
Mishkin fmi9ge ppt_c02
Dr. Muath Asmar
 
The Go4Venture Advisers’ European Venture & Growth Equity Market Monthly Bull...
The Go4Venture Advisers’ European Venture & Growth Equity Market Monthly Bull...The Go4Venture Advisers’ European Venture & Growth Equity Market Monthly Bull...
The Go4Venture Advisers’ European Venture & Growth Equity Market Monthly Bull...
CAR FOR YOU
 
Go4Venture Bulletin - Venture & Growth Equity Market Report Europe, August 2014
Go4Venture Bulletin - Venture & Growth Equity Market Report Europe, August 2014Go4Venture Bulletin - Venture & Growth Equity Market Report Europe, August 2014
Go4Venture Bulletin - Venture & Growth Equity Market Report Europe, August 2014
CAR FOR YOU
 
2013 07 go4_bulletin
2013 07 go4_bulletin2013 07 go4_bulletin
2013 07 go4_bulletin
SHARE MIND
 
May 2015 real estate securities funds monitor
May  2015  real estate securities funds monitorMay  2015  real estate securities funds monitor
May 2015 real estate securities funds monitor
Consiliacapital
 
Alternate investments - Other Asset classes
Alternate investments - Other Asset classesAlternate investments - Other Asset classes
Alternate investments - Other Asset classes
BFSI academy
 
Ords Insights - Investment Strategy
Ords Insights - Investment StrategyOrds Insights - Investment Strategy
Ords Insights - Investment Strategy
Luke Headland
 
LTG Fund Presentation 2015
LTG Fund Presentation 2015LTG Fund Presentation 2015
LTG Fund Presentation 2015
Raimundas Meilus
 
Quarterly reports - WIOF Global Listed Utilities Fund
Quarterly reports - WIOF Global Listed Utilities FundQuarterly reports - WIOF Global Listed Utilities Fund
Quarterly reports - WIOF Global Listed Utilities Fund
Ken Teale
 
Bcp Presentation Egl Jan 2010
Bcp Presentation Egl Jan 2010Bcp Presentation Egl Jan 2010
Bcp Presentation Egl Jan 2010
juabure
 
20160331_Italy_LS_Presentation
20160331_Italy_LS_Presentation20160331_Italy_LS_Presentation
20160331_Italy_LS_Presentation
Angelo Meda, CFA, CIPM
 
DealMarket Digest Issue 131 - 7 March 2014
DealMarket Digest Issue 131 - 7 March 2014DealMarket Digest Issue 131 - 7 March 2014
DealMarket Digest Issue 131 - 7 March 2014
Urs Haeusler
 
Tmt cf deal_tracker_march_2015
Tmt cf deal_tracker_march_2015Tmt cf deal_tracker_march_2015
Tmt cf deal_tracker_march_2015
Milind Kinker
 
Derivatives POV Final V2
Derivatives POV Final V2Derivatives POV Final V2
Derivatives POV Final V2
Stephan Sparrius
 
Corporate Folio
Corporate FolioCorporate Folio
Corporate Folio
Richard Brown
 
Article Strategic Insight - Sept 09
Article Strategic Insight - Sept 09Article Strategic Insight - Sept 09
Article Strategic Insight - Sept 09
Damien de Chillaz
 
b
bb
Stingray Partners-Draft Infrastructure One Presentation-April 2015 - A4
Stingray Partners-Draft Infrastructure One Presentation-April 2015 - A4Stingray Partners-Draft Infrastructure One Presentation-April 2015 - A4
Stingray Partners-Draft Infrastructure One Presentation-April 2015 - A4
David Dunlap
 
Medici firma institutional research
Medici firma institutional researchMedici firma institutional research
Medici firma institutional research
Medici Firma
 
Standard life global outlook
Standard life global outlookStandard life global outlook
Standard life global outlook
Omega Financial Management
 

Similar to Building_the_Future_Dec08_lowres (20)

Mishkin fmi9ge ppt_c02
Mishkin fmi9ge ppt_c02Mishkin fmi9ge ppt_c02
Mishkin fmi9ge ppt_c02
 
The Go4Venture Advisers’ European Venture & Growth Equity Market Monthly Bull...
The Go4Venture Advisers’ European Venture & Growth Equity Market Monthly Bull...The Go4Venture Advisers’ European Venture & Growth Equity Market Monthly Bull...
The Go4Venture Advisers’ European Venture & Growth Equity Market Monthly Bull...
 
Go4Venture Bulletin - Venture & Growth Equity Market Report Europe, August 2014
Go4Venture Bulletin - Venture & Growth Equity Market Report Europe, August 2014Go4Venture Bulletin - Venture & Growth Equity Market Report Europe, August 2014
Go4Venture Bulletin - Venture & Growth Equity Market Report Europe, August 2014
 
2013 07 go4_bulletin
2013 07 go4_bulletin2013 07 go4_bulletin
2013 07 go4_bulletin
 
May 2015 real estate securities funds monitor
May  2015  real estate securities funds monitorMay  2015  real estate securities funds monitor
May 2015 real estate securities funds monitor
 
Alternate investments - Other Asset classes
Alternate investments - Other Asset classesAlternate investments - Other Asset classes
Alternate investments - Other Asset classes
 
Ords Insights - Investment Strategy
Ords Insights - Investment StrategyOrds Insights - Investment Strategy
Ords Insights - Investment Strategy
 
LTG Fund Presentation 2015
LTG Fund Presentation 2015LTG Fund Presentation 2015
LTG Fund Presentation 2015
 
Quarterly reports - WIOF Global Listed Utilities Fund
Quarterly reports - WIOF Global Listed Utilities FundQuarterly reports - WIOF Global Listed Utilities Fund
Quarterly reports - WIOF Global Listed Utilities Fund
 
Bcp Presentation Egl Jan 2010
Bcp Presentation Egl Jan 2010Bcp Presentation Egl Jan 2010
Bcp Presentation Egl Jan 2010
 
20160331_Italy_LS_Presentation
20160331_Italy_LS_Presentation20160331_Italy_LS_Presentation
20160331_Italy_LS_Presentation
 
DealMarket Digest Issue 131 - 7 March 2014
DealMarket Digest Issue 131 - 7 March 2014DealMarket Digest Issue 131 - 7 March 2014
DealMarket Digest Issue 131 - 7 March 2014
 
Tmt cf deal_tracker_march_2015
Tmt cf deal_tracker_march_2015Tmt cf deal_tracker_march_2015
Tmt cf deal_tracker_march_2015
 
Derivatives POV Final V2
Derivatives POV Final V2Derivatives POV Final V2
Derivatives POV Final V2
 
Corporate Folio
Corporate FolioCorporate Folio
Corporate Folio
 
Article Strategic Insight - Sept 09
Article Strategic Insight - Sept 09Article Strategic Insight - Sept 09
Article Strategic Insight - Sept 09
 
b
bb
b
 
Stingray Partners-Draft Infrastructure One Presentation-April 2015 - A4
Stingray Partners-Draft Infrastructure One Presentation-April 2015 - A4Stingray Partners-Draft Infrastructure One Presentation-April 2015 - A4
Stingray Partners-Draft Infrastructure One Presentation-April 2015 - A4
 
Medici firma institutional research
Medici firma institutional researchMedici firma institutional research
Medici firma institutional research
 
Standard life global outlook
Standard life global outlookStandard life global outlook
Standard life global outlook
 

Building_the_Future_Dec08_lowres

  • 1. Building the Future Please refer to important disclosures at the end of this report. Autumn 2008 Real Estate Sector Overview: Real Estate Factbook RESEARCH Simon Moore simon.moore@libertascapital.com +44 (0)20 7569 9675
  • 2. Autumn 2008 Building the Future 1 Contents Page Executive Summary 3 Sector Overview 3 General Recommendations 3 Specific Recommendations 3 Introduction 5 Discounts 5 Regional Summaries 7 Global 7 UK 8 Western Europe 10 Central Eastern Europe 12 South Eastern Europe 13 Russia and the CIS 14 India 16 China 17 Asia 18 Background to this Fact Book 19 About the Fact Sheet Layout 22 Abbreviations 22 Individual Company Fact Sheets 23 Index 161
  • 3. Autumn 2008 Building the Future 3 Building the Future Real Estate Sector Overview There are many investment opportunities at the moment – from deeply discounted shares of listed property companies to direct exposure to the underlying properties or projects – driven by forced sellers of the shares of these companies and forced sellers of the assets themselves. We expect the underlying assets from portfolios of many of the listed companies to be for sale, either direct properties that need to be sold to reduce gearing or development projects that are unable to access funding. We also expect governments’ spending on infrastructure will increase as they seek to build themselves out of a recession (see the ‘Bridges to Nowhere’ policy in Japan over the last 15 years), which will benefit buyers of both individual infrastructure projects and the listed funds of infrastructure projects. General Recommendations In general, we like countries with GDP growth. Although scaled back from prior 2008 estimates, GDPs of some countries are still over 5% (e.g. India, China or Russia). We prefer countries with transparent ownership of underlying real estate and where repatriation of gains to investors is possible. We like real estate where there is some form of government guarantee or support to the occupier and returns (e.g. the healthcare sector or properties let to government departments). Also, we like real estate and infrastructure projects which have local monopolies, long-term contracts and are newly completed, so are no longer in the construction stage. We like companies which have a commitment to pay dividends or where there are planned capital exits or wind- up dates. The interests of shareholders’ and managers’ being closely aligned is also desirable. We prefer to avoid countries undergoing a recession (e.g. UK, US, EU). We also seek to avoid high gearing and speculative project developments. Specific Recommendations Investors who are keen to maintain exposure to the UK should look at those companies with low or no gearing and where there is a clearly announced commitment to unchanged dividends such as F&C Commercial Property Trust (FCPT), ISIS Property Trust (IPT), IRP Property Trust (formerly ISIS Property Trust 2) (IRP) and UK Commercial Property Trust (UKCM). Other income-seeking investors should look at those companies whose properties are occupied by government or where rents are ultimately backed by government. Examples of those holding properties that are in the healthcare sector, such as those let to GPs, are: Assura Group (AGP), MedicX Fund (MXF) and Primary Health Properties (PHP) or Wichford (WICH), which holds properties let directly to government in the UK or in the EU. While we remain cautious of the new-build residential sector, those that target secured rents could also be safer havens. In Germany, Speymill Deutsche Immobilien (SDIC) has more than 26,000 units in over 1,000 properties in the mid-market sector with secured and rising rents. Infrastructure assets typically have long leases and guaranteed rents including schools, hospitals, roads and railways. We suggest these assets are safer havens in times of poor economic prospects. For international infrastructure exposure, the choice is HSBC Infrastructure (HICL), 3i Infrastructure (3IN) and Babcock & Brown Public Partnerships (BBPP). For country specific infrastructure, there is Macquarie Korea (MKIF), Vietnam Infrastructure (VNI), India Infrastructure (IIP), Trikona Trinity Capital (TRC) and Eredene Capital (ERE) – the latter two invest in India. Residential rentals Likes Dislikes Healthcare and government lets Infrastructure UK Executive Summary
  • 4. Building the Future Autumn 2008 4 In south eastern Europe (SEE) and central eastern Europe (CEE) we like: Bulgaria and the wider Balkans region; companies that have a diversity of several projects, not just in one sector or location; projects at different stages of completion; and projects that are complete and fully let. Our favourites are: Bulgarian Land Development (BLD), Equest Balkan Properties (EBP); Eastern European Property (EEP), Atlas Estates (ATLS), Engel East Europe (EEE), Plaza Centers (PLAZ). In Ukraine our preferred choice is Aisi Realty Public (AISI). We like Russia, China and India where the economies are growing rather than shrinking as in the West or in other more developed nations. Specifically, in Russia we like: Raven Russia (RUS); and in China: China Real Estate Opportunities (CREO) and Speymill Macau Property (MCAU). In India, we prefer: Hirco (HRCO) for residential, Eredene Capital (ERE) for infrastructure and West Pioneer Properties (WPR) for commercial. BRIC economies Eastern Europe
  • 5. Autumn 2008 Building the Future 5 Introduction In this fact book, we cover 138 real estate companies listed on the stock exchange in London. Our universe covers investment funds as well as trading companies and developers along with investors. Although listed in London, the underlying properties and projects are all over the world. Most are specialised and focus on a single country or sector and are managed by locally-based, experienced teams. Initially, we covered only those stocks listed in London either on AIM or the main market of the LSE. We have since added stocks listed on Euronext, in response to our institutional clients’ requests, and are currently looking to add companies listed on other exchanges such as on the Specialist Fund Market (SFM) and in Frankfurt as well as those listed on the exchange in the country where they invest e.g. Russia and Poland. Discounts Our daily list (available on request) shows that there are some very wide discounts. There are companies where the property portfolios are valued at €2bn yet the market value is only €10m. Some clearly have problems with high gearing, bank loan covenant breaches and dividends cut or dividends suspended. However, there are others that are well run, with sound tenants and good dividend cover such as Speymill Deutsche Immobilien (SDIC), which is on a 93% discount to NAV. Sector Discounts Total Market Value (£m) Number of Companies Size-Weighted Average Discount (%) UK – REITs and Equivalents 15,057 28 -49.8 UK – Healthcare and Government-Backed 278 3 -35.1 UK – Other 426 9 -28.8 Western Europe – Germany 260 8 -81.3 Western Europe – Other Countries 701 14 -60.1 South East Europe (SEE) – Bulgaria & Romania 261 12 -56.6 Europe - Russia, Ukraine, CIS, Baltic States & Nordic 654 11 -87.2 Central & Eastern Europe (CEE) – Other Countries 646 11 -74.7 Asia – China 538 6 -77.6 Asia – India 410 10 -64.9 Asia – Other Countries 480 9 -78.2 Other Countries 111 3 -67.3 Global 470 7 -43.8 Infrastructure 1,519 7 -23.2 Total 21,810 138 -51.5 Source: Libertas Capital Discounts to NAV for Selected Individual Companies Company (Ticker) Sector Discount (%) Total Assets Market Value (£m) Gross Gearing (%) Net Gearing (%) Invista Foundation Property (IFD) UK -79.1 £660m 55 39 30 Speymill Deutsche Immobilien (SDIC) Germany -92.9 €2.0bn 29 60 54 Invista European Real Estate Trust (IERE) Pan Europe -92.1 €812m 21 54 49 Equest Balkan Properties (EBP) SEE -77.2 €430m 48 40 38 Raven Russia (RUS) Russia -80.8 $1.4bn 117 19 - Atlas Estate (ATLS) CEE -97.6 €558m 7 28 25 China Real Estate Opportunities (CREO) China -78.2 £814m 109 31 22 Speymill Macau Property (MCAU) Macau -86.8 U$290m 22 7 0 Source: Libertas Capital Stock exchanges covered
  • 6. Building the Future Autumn 2008 6 Why are Discounts so Wide? As well as forced sellers, as described earlier, many companies do not communicate well with shareholders. Uncertainty of investments’ progress or valuation can lead to extra selling pressure. Some companies do not publish NAVs, hence investors do not know the value of what they hold. Often, there is poor communication: websites that are not easy to follow; few RNS announcements; infrequent updates of trading and progress; managers based at a distance from shareholders and have infrequent contact with investors (either face- to-face or via conference calls). The UK REIT-like offshore property investment companies, as a group, have the best communication with shareholders. They co-ordinate announcements so that all quarterly report updates are at the same quarter ends and they announce within a few days of each other. The on-shore UK REITs by comparison are amongst the worst communicators, reporting only half-yearly at best and with a long delay between the quarter end and the announcement of results. Most have websites but all should. All should announce NAVs quarterly and should have the same quarter end. Companies need to announce standard information, not just to comply with LSE rules (e.g. AIM rule 26) – regular quarterly newsletters or fact sheets are useful for shareholders and their underlying clients too, especially in the case of funds or private client fund managers. In general, more detail is needed in the announcements: NAV per share and quarterly changes, including and excluding current period revenue; gearing; LTV (gross and net of cash); LTV maximum covenant; interest rate on the loans, interest cover and minimum covenant; total property value and quarterly changes; geographical and sector spread of investments; the top ten properties or projects and their values; rents; tenant quality; average lease length; development progress at each project; dividend projections; dividend cover; and total expense ratios (‘TERs’). We suggest that co-ordination could be brokered by a trade body like the Association of Investment Companies (AIC), Reita or the European Public Real Estate Association (EPRA). Shareholder communication What companies should announce Specific detail needed
  • 7. Autumn 2008 Building the Future 7 Regional Summaries Global 3IN.L BBPP.L BLK.L CNMI.L RIG.L DGRE.L HGPC.L IGRE.L PSPI.L TRY.L 3i Infrastructure plc Babcock & Brown Public Partnerships Ltd Blackrock International Land plc Camper & Nicholson Marina Investment Ltd CQS Rig Finance Fund Ltd Delek Global Real Estate Ltd Henderson Global Property Co. Ltd ING Global Real Estate Securities Ltd Public Service Properties Investments Ltd TR Property Investment Trust plc Infrastructure Social Infrastructure Commercial – Industrial – Residential Marina Infrastructure – Oil Rigs Commercial Commercial Commercial Care Homes in the UK, Switzerland & Germany Shares of Listed Property Companies Analyst’s Comments Economies worldwide look to be in the doldrums with low levels of growth forecast for 2009 and 2010 (+0.8% and +1.9% respectively, down from +2.5% in 2008 and a respectable +3.8% in 2007). However, an average figure masks the variation at the individual level. While the global outlook is muted but positive, some countries are in recession and others have good growth prospects. We will cover the individual countries and regions later in this report. Recommendations Of the companies in our universe with a global portfolio, we prefer the safer haven of infrastructure assets, with Babcock & Brown Public Partnerships (BBPP) – our preferred choice. We continue to expound the virtues of infrastructure funds. Typically, they have diverse portfolios with long contracts backed by governments; this should make them safer havens than other listed investments. We like BBPP for its global reach via its connections with the Babcock & Brown group. Of the London-listed infrastructure funds, BBPP has one of the best global deal sourcing networks through the B&B connections. The mix of mature and development projects means there is a strong likelihood of both NAV and income growth. We believe that BBPP would suit risk-averse investors who prefer inflation-linked dividends from a diverse portfolio of international infrastructure assets. Economic Summary World 2008 2009 2010 Real GDP (%) 2.5 0.8 1.9 Consumer Price (%) 6.1 3.8 3.2 Curr. Acct. Bal. % GDP - 0.7 0.7 Source: Economist Intelligence Unit
  • 8. Building the Future Autumn 2008 8 United Kingdom TAP.L Advantage Property Income Trust Ltd Offices, Industrial, Retail, Leisure, Retail Warehousing AGR.L Assura Group Ltd Infrastructure – Healthcare BYG.L Big Yellow Group Self Storage BLND.L British Land Co. plc Commercial BXTN.L Brixton plc Industrial – Warehouse CHI.L Close High Income Properties plc Commercial CHID.L Close High Income Properties plc (D shares) Commercial CIC.L Conygar Investment Company plc Residential – Leisure – Retail DLN.L Derwent London plc Office DSC.L Development Securities plc Retail – Industrial – Office FCPT.L F&C Commercial Property Trust Ltd Commercial GPOR.L Great Portland Estate plc Office – retail – residential HCFT.L Highcroft Investment plc Diversified HICL.L HSBC Infrastructure Company Ltd Infrastructure IRET.L ING UK Real Estate Income Trust Ltd Retail – Office – Industrial – Leisure – Warehouse INL.L Inland plc Residential IFD.L Invista Foundation Property Trust Ltd Commercial IRP.L IRP Property Investments Ltd Commercial IPT.L ISIS Property Trust Ltd Commercial LAND.L Land Securities Group plc Residential – Commercial LII.L Liberty International plc Shopping Centres LSR.L Local Shopping REIT plc Retail LSP.L London & Stamford Property Ltd Commercial MCKS.L McKay Securities plc Commercial MXF.L MedicX Fund Ltd Infrastructure – Healthcare MKLW.L Mucklow (A&J) Group plc Industrial – Commercial OTE.L O Twelve Estate Ltd Shopping Centres – Industrial – Retail OPF.L Off-Plan Fund Ltd Residential PHP.L Primary Health Properties plc Infrastructure – Healthcare RLE.L Real Estate Investors plc Commercial – Industrial REO.L Real Estate Opportunities Ltd (Ordinary Shares) Commercial RUGB.L Rugby Estates Investment Trust plc Commercial SGRO.L Segro plc Commercial SHB.L Shaftesbury plc Retail – Residential – Office – Leisure SVN.L Sovereign Reversion plc Residential SLI.L Standard Life Investment Property Income Trust plc Commercial THG.L Terrace Hill Group plc Commercial – Residential TCSC.L Town Centre Securities plc Retail UKCM.L UK Commercial Property Trust Ltd Commercial WNER.L Warner Estate Holdings plc Retail WKP.L Workspace Group plc Office – Industrial Analyst’s Comment The UK is currently in recession, but property values have been falling for c.18 months. However, this reversed an appreciating trend which began in 1996 and represents one of the most dramatic rallies in recent history. UK Capital Values Rise (1989-2008) UK Capital Values Fall (2006-2008) Source: Thomson Datastream and Investment Property Databank (IPD) Economic Summary United Kingdom 2008 2009 2010 Real GDP %) 1.0 -2.1 -0.9 Consumer Price (%) 3.8 1.8 1.1 Curr. Acct. Bal. % GDP -2.5 -2.1 Source: IMF International Financial Stats IPD: CAPITAL INDEX (TIME-WEIGHTED) 11/12/08 89 90 91 92 93 94 95 96 97 98 99 00 01 02 03 04 05 06 07 08 100 120 140 160 180 200 220 240 UK IPD: CAPITAL INDEX (TIME-WEIGHTED) NADJ
  • 9. Autumn 2008 Building the Future 9 The beginning of this rally was marked by the entry of pension funds that were fuelled by the desire to diversify away from equities and gilts. Pension funds move slowly, like oil tankers. Once turned on they are hard to stop. Institutions continued to buy property until the yield on fully let property fell below the risk free rate on gilts - a reverse yield gap – this was a clear indication that UK property values had risen too far. The process began to reverse in early 2008 before the current banking crisis began. Real estate sellers predominated and values fell, NAVs fell, private clients and their pensions fund woke up to the falls. Investing in bricks and mortar were not totally safe – valuations could fall. Publicity around falling real estate values triggered sales from open-ended property funds. This process forced fund managers to sell properties to meet client redemptions, despite a shortfall of buyers. Unit trusts and other open- ended funds tried to limit client redemptions, but saw further pressure when the ‘credit crunch’ impacted financial institutions, resulting in a recognised recession. Commercial vacancies are only just beginning to rise. Precious support to capital value falls has come from rental growth of 0.5% pcm i.e. 6% p.a. However, this looks under threat now. Currently, there is rent support for values but this may not last for much longer. The UK real estate market is mature and transactions are the most transparent in Europe. Valuers marked property values down to levels that buyers told them they would be paying. Not so in Europe, which seemed to hold up but valuers now have to recognise the real value and are marking down prices more aggressively. Most listed property funds have high levels of debt which leads to geared falls at the NAV per share level. Asset managers cannot sell properties quickly enough and in large enough size to deleverage. Several funds hit their loan to value (‘LTV’) covenant limits on their bank loans. Loans also have interest rate cover (‘IRC’) tests, but none of the funds are yet in breach of these. The next bank loan test for most companies will be at 2008 year-end. We expect to see the results of these tests and any repercussions in 1Q09. We do not expect to see banks calling in loans and ‘fire sales’ of whole portfolios (this will only hurt valuations even more and hit other parts of bank loan books). Instead, banks will concentrate on IRC, forcing companies to reduce outgoings as much as possible so that interest cover is maintained. We expect this to lead to dividend cuts/suspensions, management fee cuts or both. We may also see consolidation to reduce total expense ratios and rescue issues of equity to bolster balance sheets (possibly as preference shares). Our checks with UK property managers suggest they are de-gearing as fast as possible. Many have pushed out predictions for a real estate recovery – currently not until 2010. Recommendations Avoid: city and residential, developers, new REITs, high gearing. Like: good dividend cover and forecast unchanged dividends, low gearing, government backed income e.g. GP surgeries (e.g. Primary Health Properties (PHP), Assura Group (AGR), MedicX Fund (MXF)) or government-occupied buildings (e.g. Wichford (WICH)), or infrastructure (e.g. HSBC Infrastructure (HICL)). Investors who are keen to maintain exposure to the general UK commercial sector should look at those companies with low or no gearing and where there is a clearly announced commitment to unchanged dividends, such as F&C Commercial Property Trust (FCPT), ISIS Property Trust (IPT), IRP Property Trust (formerly ISIS Property Trust 2) (IRP) and UK Commercial Property Trust (UKCM). Gearing When will it end? Dividend cuts likely
  • 10. Building the Future Autumn 2008 10 Western Europe ALPH.L Alpha Pyrenees Trust Ltd France – Spain Industrial - Logistics - Office - Retail APT.L AXA Property Trust Pan-Europe Offices – Retail – Industrial – Leisure – Hotels CAL.L Capital & Regional Germany Retail CRF.L Ciref Pan-Europe Retail – Commercial DTR.L Dawnay Day Treveria Germany Retail DLD.L Deutsche Land Germany Retail – Office – Hotel DDE.L Develica Deutschland Germany Office – Retail – Distribution HMSO.L Hammerson France – UK Retail HSTN.L Hansteen Holdings Pan-Europe Commercial IPI.L Invesco Property Income Trust Pan-Europe Commercial IERE.L Invista European Real Estate Trust France – Germany commercial KEIF.L Kenmore European Industrial Fund Pan-Europe Industrial MERE.L Matrix European REIT Pan-Europe Commercial PUMA.L Puma Brandenburg Germany Residential – Retail – Commercial RTY.L Rutley European Property Ltd Pan-Europe Commercial SRE.L Sirius Real Estate Ltd Germany Office – Industrial – Business Park SPNV.L Spazio Investment Italy Industrial SDIC.L Speymill Deutsche Immobilien Co. Germany Residential SGL.L Summit Germany Germany Commercial TPF.L Taliesin Property Fund Germany Residential TCF.L Terra Catalyst Fund Pan-Europe Listed Real Estate Securities TRYS.L TR Property Investment Trust plc (Sigma) Pan-Europe Listed Real Estate Securities WICH.L Wichford Europe – UK Government – Offices Analyst’s Comment Europe – West This is a mature market with many commercial and investment properties available. Valuations in general are currently being marked down having been held up by valuers for far too long. It had looked like Western Europe was initially immune from the falls in the UK. Properties in Europe had not been so highly priced as in UK, so we do not expect that there should be as hard a fall as in the UK. However, even in Europe, retailers are going bust and vacancies are rising. Within Europe, the real estate sector in each country is different. Real estate is one of only a few sectors that cannot be treated with one global set of rules (unlike, for example, Automotives or Electronics) Because Kenmore European Industrial Fund (KEIF) has such a broad portfolio of properties across Western Europe, we use news and results at KEIF to represent a good summary of the whole of the Western European commercial property sector: “European property values continue to decline as a result of the wider economic climate, with the industry expecting values to fall further through to the end of 2008. Lack of credit has seen the investment market slow considerably with transactions limited to mostly individual property sales of assets under €20 million. While occupier demand remained strong in 3Q08, albeit slower than expected for the summer months, tenant demand is expected to slow as economies see sluggish GDP growth and, in some cases, recession. Bank debt remains difficult to source at gearing levels over 50% and recent interest rate cuts have not been reflected in the terms offered by the banks with the inter-bank lending rate remaining stubbornly high and reflecting the banking institutions' continued concerns about lending to one another. The European property market is not expected to recover in the near term. Higher CPI is a positive factor in the current market and should help off-set some of the downward value pressure and tenants are expected to minimise their own costs by remaining in situ on lease expiry, avoiding moving costs.” (Source: Kenmore European Industrial Fund (KEIF)) European Property Market Outlook We believe the UK property market will fall 45% from its peak in February 2007. Europe, excluding the UK, is unlikely to fall as far since Continental property markets did not get so overvalued. Economic Summary France 2008 2009 2010 Real GDP (%) 0.8 -0.7 0.6 Consumer Price (%) 3.4 1.6 1.4 Curr. Acct. Bal. % GDP - -1.4 -1.3 Germany 2008 2009 2010 Real GDP (%) 1.9 -0.7 0.4 Consumer Price (%) 2.9 0.6 1.4 Curr. Acct. Bal. % GDP - 7.0 5.8 Italy 2008 2009 2010 Real GDP (%) -0.06 -1.0 0.5 Consumer Price (%) 3.44 1.3 1.3 Curr. Acct. Bal. % GDP - -2.1 -1.8 Spain 2008 2009 2010 Real GDP (%) 1.38 -1.2 0.7 Consumer Price (%) 4.5 2.5 1.8 Curr. Acct. Bal. % GDP - -8.6 -7.5 Source: Economist Intelligence Unit, Eurostat, and IMF
  • 11. Autumn 2008 Building the Future 11 Norway This has seen the worst falls in value. It is a very thin market and there have been very few transactions. However, there are several positives: recent cuts in interest rates should stimulate the sector; low tenant risk; no speculative developments; and a strong economy based on its oil and gas revenues. Sweden We prefer Sweden to Norway as the economy is more diversified: more industries, more cities and more investors. Finland This is the strongest property market in northern Europe. Tenants typically do not move, leasing demand is consistent and there are many private buyers. Germany The market has regional characteristics. The east is suffering. The normally resilient south west is reeling from recent financial shocks (including problems at Hypo Real Estate) and rising unemployment. It will be another six to nine months before the full effects of the downturn materialise. We expect real estate values to fall but less severely than in the UK. France Laws to retrieve rents from defaulting tenants are particularly hard to enforce in France, making property yields vulnerable in a recession. France is usually a strong market and Paris has been the second largest property market in Europe after London. Property in Paris became the most overvalued of all European markets after London so is likely to falloff quite steeply. Belgium This is a defensive economy though the Fortis impact will ripple out to affect the wider economy. Property around Antwerp port and nearby trade routes should be particularly good defensive investments. Netherlands The real estate market is very transparent, like the UK. Local and international investors are active in the sector. Although property is expensive, it is a defensive sector at the moment. Recommendations Avoid: Commercial property in Germany and France where steeper falls are expected. Avoid: Spain – where oversupply means rents are falling and there are high vacancy rates. Netherlands, Belgium and Finland are good defensive plays. We also like: the German residential sector (e.g. Speymill Deutsche Immobilien (SDIC)); infrastructure and properties occupied by governments (e.g. Wichford (WICH)); countries which have a transparent property sector, a wide institutional investor base and a high level of transactions (e.g. Netherlands).
  • 12. Building the Future Autumn 2008 12 Central Eastern Europe ABL.L Ablon Group Ltd Budapest – Prague – Bucharest Office, Residential, Hotel, Retail, Logistics ATLS.L Atlas Estates Ltd Pan CEE Commercial – Residential CPT.L Carpathian plc Pan CEE Retail – Shopping Centres – Supermarkets – Warehousing EEE.L Engel East Europe NV Pan CEE Residential NAT.L Nanette Real Estate Group NV Pan CEE Residential PHU.L Pactolus Hungarian Property plc Budapest Residential PLAZ.L Plaza Centers NV Pan CEE Shopping Centres Analyst’s Comments Central and Eastern European (‘CEE’) countries are nascent markets. There are few investment opportunities. Accordingly, we believe that there are more developments than investment opportunities. One of the main drivers has been the enlargement of the European Union to include countries in the East. In 2004 the Czech Republic, Estonia, Cyprus, Hungary, Latvia, Lithuania, Malta, Poland, Slovakia and Slovenia joined. This was a historic enlargement which signified the re-unification of Europe after decades of division. On January 1 2007, Bulgaria and Romania also joined, completing this historic process (see the section on South Eastern Europe (‘SEE’) later in this report which covers Bulgaria and Romania). In each of these countries, there were several years of fast GDP growth in the immediate run-up to joining the EU and beyond, as these countries sought to catch up to Western Europe (in terms of wages), increased access to finance and increasing inward investment levels from expanding Western European companies. This process has continued with new EU joiners Bulgaria and Romania. We expect the process to be repeated with further joiners. Current candidate countries are Croatia, the Former Yugoslav Republic of Macedonia (FYROM) and Turkey. The potential candidate countries are Albania, Bosnia and Herzegovina, Kosovo (under UN Security Council Resolution 1244), Montenegro and Serbia. Typically, many residents in former communist countries: (a) own their own homes and (b) have little to no debt. As access to borrowings has been increasing more personal loans have been taken out but they are still at much lower penetration levels than in the West. Also new entrants to the EU have generally experienced increased trade, inward investment and jobs. Salaries have been rising from amongst the lowest levels in Europe. Both effects have fuelled consumer spending. This has opened up real estate opportunities in the residential sector (for locals trading up) and for shopping malls (for international brands wishing to capture increasing consumer spending when their home Western European markets appear to be slowing). EU membership also triggers the release of infrastructure grants. This is aimed at opening up new trading routes and necessitates the building of new motorways, ring roads, tunnels and bridges. The European Commission has identified key trade corridors, especially the pan Europe transport corridor X (linking Austria to Greece and Turkey via Bulgaria and Serbia) and pan Europe transport corridor IV (linking Germany to Romania, Turkey, Bulgaria and Greece). In July 08 the EU suspended grants to Bulgaria and Romania as these countries had not cleaned up corruption quickly enough. When these grants resume it should trigger renewed FDI (Foreign Direct Investment) & investment opportunities in these two countries. Meanwhile transport corridor VII is the Danube, a natural and already busy highway linking the Black Sea with southern Germany and via the Main canal to the Rhine and the North Sea. We see key projects on the Danube as beneficiaries of increasing East- West trade across Europe as the CEE and SEE countries develop. EU enlargement New and future joiners Increased domestic consumption European infrastructure grants Danube transport corridor
  • 13. Autumn 2008 Building the Future 13 Both the CEE and SEE are newer real estate markets, offering fewer investment opportunities. Development projects predominate. These take longer and have more risk so investors should expect higher returns than for investment (i.e. completed and fully let) properties. To be successful, these developments need locally based and experienced managers. Investors based abroad are often unfamiliar as to how the local real estate market works so need a trusted local manager. There also needs to be good and regular communication of progress back to the investor. In the current market, where access to bank financing is restricted (even in the CEE and SEE markets), developers are scaling back on projects. Banks are currently only lending to the better projects which have pre-lets to quality tenants and are managed by experienced developers. In October the ECB extended a €5bn credit line to Hungary to cover an acute shortage of euros among Hungarian banks. The ECB has never publicly helped an EU member that is not in the Eurozone until now. The IMF will also help Hungary. New loans to banks in Hungary may ease developers’ access to finance and kick start construction. Projects previously on hold may be able to restart. This could improve sentiment to the listed real estate companies in Hungary. Recommendations Avoid: speculative developments, second homes, holiday-related. Like: Bulgaria and the wider Balkans region; companies that have a diversity of several projects, not just in one sector or location; projects at different stages of completion; projects that are complete and fully let. Favourites: Bulgarian Land Development (BLD), Equest Balkan Properties (EBP); Eastern European Property (EEP), Atlas Estates (ATLS), Engel East Europe (EEE), Plaza Centers (PLAZ). South Eastern Europe AREO.L Argo Real Estate Opportunities Fund Romania Commercial BKSA.L Black Sea Property Fund Ltd Bulgaria Vacation Property on Black Sea – Ski Resort BLD.L Bulgarian Land Development plc Bulgaria Residential – Commercial BPD.L Bulgarian Property Developments plc Bulgaria Commercial CBX.L Cubus Lux plc Croatia Casino – Marina – Resort DCI.L Dolphin Capital Investors Ltd Greece -Turkey – Cyprus – Croatia Residential – Leisure EEP.L Eastern European Property Fund Ltd Bulgaria – Romania - Turkey Office – Warehouse – Retail EBP.L Equest Balkan Properties plc Bulgaria – Romania Commercial – Retail – Industrial Property ECDC.L European Convergence Development Company plc Bulgaria – Romania Residential – Retail – Commercial – Industrial Property. ECPC.L European Convergence Property Company plc Turkey – Romania Commercial – Retail –Industrial FAB.L Fabian Romania Ltd Romania Commercial – Residential LCSR.L Lewis Charles Romania Property Fund Ltd Romania Commercial – Residential LCSS.L Lewis Charles Sofia Property Fund Ltd Bulgaria Residential – Sky Resort MBF.L Madara Bulgarian Property Fund Ltd Bulgaria Land Development NEPI.L New Europe Property Investment plc Romania – CEE Commercial Property OCH.L Orchid Developments Ltd Bulgaria Residential – Hotel – Retail – Logistic OTM.L Ottoman Fund Ltd Turkey Residential Analyst’s Comments The SEE region covers the newest EU joiners and the countries next in line to join. Just before and just after joining the EU a country shows the highest growth (e.g. see the Baltic States and CEE countries when they joined the EU). Within the SEE region, there are more than enough Bulgarian real estate companies which would benefit from consolidation. The sea and ski residential sector seems to be the worst hit by recession. We prefer the commercial property sector, fully let properties and infrastructure projects. Economic Summary Czech Republic 2008 2009 2010 Real GDP (%) 4.03 3.0 3.4 Consumer Price (%) 6.74 3.0 2.3 Curr. Acct. Bal. % GDP - -3.1 -3.3 Hungary 2008 2009 2010 Real GDP (%) 1.9 3.0 3.8 Consumer Price (%) 6.3 4.2 3.2 Curr. Acct. Bal. % GDP - -6.2 -6.3 Poland 2008 2009 2010 Real GDP (%) 5.2 2.9 3.6 Consumer Price (%) 4.0 3.6 2.8 Curr. Acct. Bal. % GDP - -5.0 -3.9 Source: Eurostat, Economist Intelligence Unit and IMF Economic Summary Bulgaria 2008 2009 2010 Real GDP (%) 6.25 1.9 2.6 Consumer Price (%) 12.22 7.1 4.3 Curr. Acct. Bal. % GDP - -18.8 -10.5 Romania 2008 2009 2010 Real GDP (%) 8.60 2.6 3.9 Consumer Price (%) 8.225 5.8 4.2 Curr. Acct. Bal. % GDP - -12.8 -9.8 Turkey 2008 2009 2010 Real GDP (%) 3.50 1.5 3.3 Consumer Price (%) 10.48 10.8 7.0 Curr. Acct. Bal. % GDP - -4.1 -3.6 Source: Central Bank of the Republic of Turkey, Eurostat, IMF and the National Statistical Institute
  • 14. Building the Future Autumn 2008 14 Russia and the CIS AFID.LI AFI Development plc Russia Commercial – Residential AISI.L Aisi Realty Public Ltd Ukraine Residential – Office – Warehouse DUPD.L Dragon-Ukrainian Properties & Development plc Ukraine Commercial KDDG.L KDD Group NV Ukraine Office – Retail – Residential – Mixed-Use MLD.L Mirland Development Corp plc Russia Residential – Commercial RUS.L Raven Russia Ltd Russia Logistic RGI.L RGI International Ltd Russia Residential – Office XXIC.L XXI Century Investments Public Ltd Ukraine Shopping Centres – Offices – Hotels – Logistics – Residential Analyst’s Comment Russia has been riding the crest of a commodity boom as it has significant oil and gas reserves. This benefit has led to a healthy growth rate, major spending on infrastructure projects, a growing consumer demand and a real estate building program. It appears that Russian GDP growth rate averaged approximately 7.3% p.a. over the last four years. The current forecast (as at December 8, 2008) is 7% for 2008, 3.7% for 2009 and 5% for 2010. We believe that these are still good growth rates in comparison with the global average. There has been an average of 13.8% growth in residential construction over the last four years. However, we feel that inflationary pressures are now being felt and the lack of liquidity within the banking system has put speculative development projects on hold. Russia’s prime minister and president have both indicated that they remain committed to spending the country’s oil wealth on infrastructure projects. A new road building program should greatly facilitate access to the Russian interior. We expect that linking up towns will open them up to logistics and commercial entrants. New ring roads will allow former potato fields to become logistics depots, shopping malls, commercial or residential developments. Such change of use will bring significant increases in land value. Individuals are typically un-leveraged yet own their own home. While they have started to borrow and consume, we expect that the bank lending hiatus will dampen consumer spending. However, Russia’s banks were typically not involved in the sub-prime inter– bank securitisations so are not invested in now worthless CDOs. Banks are still hit by problems with access to each other’s capital. Credit (like elsewhere) is now harder to get. GDP will slow but is still positive. The winter Olympics in Russia’s Black Sea resort of Sochi in 2014 should also be a boom to infrastructure and real estate projects. We see strong demand for housing from new customers from Russia’s growing middle classes out of a total population of 143 million. Two-thirds of the current national social housing stock is in need of replacement. Better housing for ordinary Russians is a political priority for the government. There continues to be chronic shortages of residential housing and a large obsolete housing stock in the country. While Russia has recently felt the effects of the global credit crisis, the Russian economy is well capitalised and continues to grow. (Source: PIK Group) Residential development projects get significant deposits from pre-sales. It is even possible for developers to charge interest on the unpaid amounts so encouraging buyers to pay as much as possible up front; this significantly reduces the cash required to fund the construction stage of residential projects. There is little need for bank debt to fund construction. Buyers of high end residential property may be hit by reduced availability of mortgages. However, at the lower end of the market, cash buyers predominate and most customers do not require mortgage financing from credit institutions. PIK Group targets this lower end of the market. While smaller developers may face difficulty from a short-term tightening of credit, PIK Group is a well capitalised business with strong cash flows that has continued to grow revenues throughout this challenging period in the financial markets. While the pre-fab housing that PIK Russian Residential Market Economic Summary Russia 2008 2009 2010 Real GDP (%) 7.00 3.7 5.0 Consumer Price (%) 14.03 11.2 9.4 Curr. Acct. Bal. % GDP 2.2 1.1 Ukraine 2008 2009 2010 Real GDP (%) 6.39 -2.5 1.5 Consumer Price (%) 25.25 11.6 11.3 Curr. Acct. Bal. % GDP -4.0 -2.6 Source: Central Bank of Russia, IMF and Thomson Financial
  • 15. Autumn 2008 Building the Future 15 manufactures en masse might not appeal to Western readers, these are just what middle- income Russians want. There seems to be no weakness in the prices that they can charge for their units and the company is doing very well financially. PIK does not build speculatively like other (mostly Moscow based) Russian residential developers and its land banking and expansion plans will also serve to distance itself from its rivals. The GDRs of this company are London listed. In Russia, the real estate sector is not transparent and the planning approval process is slow. It is important to look for experienced local developers before investing. Recommendations Avoid: high end residential sector which has been overdone; most portfolios that are not diversified and are focused only around Moscow; small, poorly-financed developers. Like: logistics. We are positive about the prospects for the Russian logistics market and about Raven Russia (RUS) in particular. The continued availability of bank financing to RUS confirms the quality and financial viability of the projects and confidence in the RUS management team’s ability to execute. Ukraine In October the IMF agreed to a US$14bn loan to Ukraine. New loans to banks in Ukraine may ease developers’ access to finance and kick start construction. Projects previously on hold may be resumed. This factor could improve sentiment to the listed real estate companies that have projects in Ukraine. The IMF has, in principle, agreed to this loan to the Ukraine (the fact that the country turned to the IMF for help shows how far pro-West the Ukraine has moved). How good this will be for the country depends on what strings are attached. The transaction still needs to be approved by Ukraine’s government, but this was recently dissolved. New elections originally scheduled for early December will be needed to speed this loan approval process. Recommendations We like Aisi Realty Public (AISI). AISI itself has no debt and so is not dogged by the fall out from the global credit crunch. It has a $65m loan facility (but undrawn) in place with the Cyprus bank – “Marfin Bank” – and has signed another loan with the European Bank of Reconstruction and Development (EBRD). It will total US$37.3m from the EBRD, although half of this will be syndicated to other banks. EBRD approval of this loan also demonstrates that the AISI management team has passed the EBRD’s thorough due diligence process. Ukraine economy
  • 16. Building the Future Autumn 2008 16 India ATPT.L Alpha Tiger Property Trust Ltd Business Parks – Commercial – Residential ERE.L Eredene Capital plc Commercial/IT Parks – Residential – Retail HRCO.L Hirco plc Residential – Commercial IIP.L Infrastructure India plc Infrastructure ISH.L Ishaan Real Estate plc IT Park – SEZ Projects NBPC.L Naya Bharat Property Co. plc Indian Listed Real Estate Securities TRC.L Trikona Trinity Capital plc Infrastructure – Residential – Township – Business Park – Hotels UCP.L Unitech Corporate Parks plc Commercial WPR.L West Pioneer Properties Ltd Shopping Mall YATRA.AS Yatra Capital Ltd Retail – Commercial – Residential – Mixed-use – Hospitality Analyst’s comment India, China and Russia have been vying for the top spot for the best GDP growth in the world. The latest forecasts for 2009 are 6.1%, 7.5% and 3.7% for India, China and Russia respectively; this puts India in second place. In Russia, growth has been underpinned by oil and gas revenues. In China, growth was centrally planned based on cheap labour, limited capitalism and controlled inward investment. India not only has relatively cheap labour, but also has free market capitalism, a well-educated middle class, is English speaking and has a democratic government. While the democratic process may lead to more delays and the planning and approval process may take longer in India, once done it is legal and binding. Crucial legal title for land ownership and real estate transactions are much more transparent than in either China or Russia. Indians are getting wealthier and there is a growing middle class. Migration to cities has created a demand for new homes. City centres are too congested and infrastructure is outdated and to fix this needs a big commitment. Central and local governments are courting foreign investors for major projects in all sectors: commercial, residential and infrastructure. There is an unsatisfied demand for better residential apartments. The increasingly sophisticated domestic consumer has created a need for better shops and malls. Growing cities means there is a need for more infrastructure projects. India has benefited from outsourcing by international companies for many years (e.g. software development, call centres). In the current downturn, we expect India to benefit since we expect an increase in outsourcing as companies cut costs to survive. Key bottlenecks that need addressing are fuel supplies, housing and infrastructure. India needs ports, roads, railways, logistics’ warehouses and distribution centres (especially of refrigerated food stocks). We expect that increased infrastructure investments will lead to significant rises in land values in surrounding areas and open up more areas for development. There is not much local experience in infrastructure projects, which traditionally has been concentrated in a few family firms. Ideally, infrastructure project managers need: good access to local planners; central government infrastructure experience; port experience; and logistics experience. For non-infrastructure developments e.g. hotels, commercial or shopping malls, these are comparatively new sectors in India and home-grown expertise is rare. The best teams will often include many who have gained their experience abroad or with international organisations. Recommendations Avoid: inexperienced managers, unfocused portfolios. Likes: Residential: Hirco (HRCO), run by the long-established Hiranandani family; Infrastructure: Trikona Trinity Capital (TRC) & Eredene Capital (ERE); Commercial: West Pioneer Properties (WPR). Economic Summary India 2008 2009 2010 Real GDP (%) 7.9 6.1 7.1 Consumer Price (%) 7.9 6.7 4.9 Curr. Acct. Bal. % GDP - -3.8 -4.2 Source: IMF
  • 17. Autumn 2008 Building the Future 17 China AGP.L Asian Growth Properties Ltd Hong Kong Commercial – Hotel – Retail – Residential CPIL.L Canton Property Investment Ltd Guangzhou Shopping Mall CCPL.L China Central Properties Ltd Mainland Commercial – Retail – Residential (Prime Location) CREO.L China Real Estate Opportunities Ltd Mainland Office – Residential – Warehouse MPO.L Macau Property Opportunities Fund Ltd Macau Residential – Mixed-Use – Logistic PACL.L Pacific Alliance China Land Ltd Mainland Residential – Office – Retail – Hospitality – Industrial MCAU.L Speymill Macau Property Co. plc Macau Commercial – Residential CPIL.L Canton Property Investment Ltd Guangzhou Shopping Mall CCPL.L China Central Properties Ltd Mainland Commercial – Retail – Residential (Prime Location) CREO.L China Real Estate Opportunities Ltd Mainland Office – Residential – Warehouse MPO.L Macau Property Opportunities Fund Ltd Macau Residential – Mixed-Use – Logistic Analyst’s Comment China is the powerhouse of the Asia region. Forecast growth is still the highest in the world at 7.5% for 2009 and 2010. China has its own domestic consumer which is becoming a major driver for growth. Population movement from rural regions to cities has put demands on those cities. Increased per capita wealth has led to greater demand for higher quality goods and food, which has pushed up prices globally. Nevertheless, China remains a cheap source of labour for the west. As demand from the US stalls, we expect China’s growth to slow, but it will be offset by increased home consumption. Gambling is a Chinese obsession. The world’s biggest rollers are Chinese. Macau is the only place in China where gambling has been legalised. Two billion people live within a five hour flight to Macau. Gambling revenues have surpassed those at Las Vegas. New casino building has recently stalled but there is enough capital committed to existing projects to keep the economy growing for many more years. On top of this, gambling stocks are a known safe haven for investors in times of recession. The province of Macau, Hong Kong and neighbouring Guangdong are all committed to major infrastructure projects to glue the region together (land reclamation, roads, bridges, ports, airports). We believe that this will increase traffic between the cities and should harmonise property prices and valuations. Macau property is currently significantly cheaper than Hong Kong. Recommendations Like: Cash rich companies, which are well run, diversified portfolio of projects, investments and developments: e.g. China Real Estate Opportunities (CREO), Speymill Macau Property (MCAU). Avoid: smaller companies with few projects; companies that only have early stage development projects; and projects where development financing has not been secured. Economic Summary China 2008 2009 2010 Real GDP (%) 9.7 7.5 7.5 Consumer Price (%) 6.4 2.9 3.5 Curr Acct Bal % GDP 9.2 7.3 Source: IMF
  • 18. Building the Future Autumn 2008 18 Asia ASPL.L Aseana Properties Ltd Vietnam Shopping Mall – Residential – Office – Hospitality – Retail JRIC.L Japan Residential Investment Company Ltd Japan Residential JSM.L JSM Indochina Ltd Vietnam Retail – Residential MKIF.LI Macquarie Korea Infrastructure Fund Korea Infrastructure PEJR.L Prospect Epicure J-REIT Value Fund plc Japan Japan-Listed REITs SGLV.L SGL Vietnam Development Ltd Vietnam Residential VNI.L Vietnam Infrastructure Ltd Vietnam Infrastructure VPF.L Vietnam Property Fund Ltd Vietnam Listed Equities VNL.L Vinaland Ltd Vietnam Residential – Office – Retail – Industrial – Leisure Analyst’s Comment China’s neighbours covet the growth shown by the cities of Shanghai and Shenzhen – and want their own boom towns. Other Asian countries are planning similar Special Economic Zones along the lines of the China model. There are many capital city re- developments planned, including ring roads, bridges, tunnels and the re-zoning of existing agricultural outskirts. Countries are trying to avoid the mistakes of quick and unplanned developments and crucially there is increasing transparency to real estate transactions. Recommendations Likes: Vietnam, especially infrastructure projects e.g. Vietnam Infrastructure (VNI); Macquarie Korea Infrastructure (MKIF). Avoid: Japan, Thailand. Economic Summary Japan 2008 2009 2010 Real GDP (%) 0.69 -0.1 0.9 Consumer Price (%) 1.57 1.2 0.9 Curr. Acct. Bal. % GDP 4.2 3.6 Korea 2008 2009 2010 Real GDP (%) 4.11 1.6 2.3 Consumer Price (%) 4.80 3.9 2.9 Curr. Acct. Bal. % GDP -0.3 -0.8 Vietnam 2008 2009 2010 Real GDP (%) 6.30 4.3 5.3 Consumer Price (%) 24.00 8.7 6.3 Curr. Acct. Bal. % GDP -5.9 -2.9 Source: Eurostat, Economist Intelligence Unit and IMF
  • 19. Autumn 2008 Building the Future 19 Background to this Fact Book This fact book is aimed at institutional investors. Libertas Capital has sales teams based in Hong Kong, Dubai, London and New York. From these offices, we can reach investors based anywhere in the world. Please contact one of our offices for a hard copy of this report. Through our global reach, many of our institutional clients and wealth managers have large cash reserves, particularly from our Middle East sales clients. These investors see the current market as a buying opportunity at the company level (listed and unlisted) and in respect of individual properties or projects. To aid comparisons between companies, we divided the set into c.12 geographical regions, with global and infrastructure as separate sections. Individual regions are analysed separately subsequently. The main body of the fact book is alphabetical with one page per company; inevitably this is only an abbreviated summary of each company. Several London listed companies are currently seeking (or have already achieved) dual listings to attract new investors. For example, AIM is not a recognised investment exchange (RIE), so making it easier to list new companies here, but this non-RIE status is a barrier to investment for some institutional investors, particularly continental European funds. A dual listing on Euronext, Frankfurt or Warsaw for example would widen the likely investor base and help to narrow discounts. A key difference between companies in the same geographical remit is whether they are an investor or a developer. The former hold fully let properties (usually commercial offices, retail or industrial); these normally pay dividends and management is focused on maximising rent. The latter do not usually pay dividends, have many years before a project can be exited and are held for capital growth. Some clients prefer to invest in funds, which are externally managed and have an independent board of directors to look after shareholders’ interests. These funds have an annual management fee and performance fee. Other clients prefer trading companies to funds, especially for development companies, where there is usually less ‘leakage’ from fees and where on the ground managers typically have more financial incentives. Several institutions that usually invest in this universe do not seem to have heard of many of these companies. Some of those we speak to are surprised that there are so many to choose from and that the global reach is so wide. Most of our universe is new: the first AIM listed, non-UK company launched in March 2005. Most were launched by a small group of stockbrokers to a small list of mostly UK based institutions. Since launch, brokers have not significantly widened the net of shareholders in these companies. Often fund managers complain to us of no/little after IPO sales or research support once the sponsor has secured its launch fee. (3%-5% launch costs are typical compared with secondary dealing commission of less than 0.5%). There has also been significant turnover of staff at brokers that cover these stocks (UBS, Teather & Greenwood, Bridgewell, Collins Stewart, Dresdner Kleinwort Benson, Arbuthnot, KBC Peel Hunt) leading to periods of little analyst coverage of news and a dearth of research on these companies. In the UK, the first property funds launched from 2002 onwards and were set up as offshore investment companies, usually based in the Channel Islands, to avoid tax. This trend took place before the UK introduced its own REITs regime. The success of the offshore route triggered the UK to bring forward the introduction of UK REITs to prevent all UK property companies moving offshore. Several pension funds, fund managers and banks offloaded their UK commercial properties (partly to comply with the Basel II accord, see below) into newly listed property investment companies. Thus, they were fully invested from the start and paying dividends. In many cases, the issuing company retained a significant shareholding. Private investors and their advisers were delighted with these issues. The Investment Management Association (IMA) recommended that private clients should have an allocation of their portfolios in to property for diversification and risk reduction. New launches traded at premia, which Layout of this book Funds versus trading companies Why do we write this? History of the UK-listed sector from 2002 Who is this report aimed at?
  • 20. Building the Future Autumn 2008 20 encouraged further launches. Over £2bn was raised for new listed UK property funds in the three years from 2002-2005. Moreover, there was a boom time in open-ended funds that invested in UK property. Significant new money was raised here too (readers may remember the much publicised launch of New Star’s UK property fund). This trend created significant buying demand for UK commercial properties. Property prices were pushed up, further fuelling fund inflows from private clients and pension funds. Eventually, property values rose to levels where the rental yield fell below the yield on UK risk free gilts; this was a clear signal that prices had risen too far. The meteoric rise turned into a catastrophic fall. Many open-ended funds were forced to suspend redemptions, as they were unable to sell properties quick enough to finance exits. Even now, many of these funds are still forced sellers of UK property. Unfortunately, the timing is poor given the recession. Occupiers in all sectors (retail, industrial and offices) are under pressure. Vacancies are rising and rents are falling. Buyers are staying away and larger transactions are non- existent. Values will continue to be marked down until buyers start to come forward. None of the fund managers to whom we speak is predicting an improving situation until 2010. Basel II is a voluntary accord agreed between international banks in developed markets. The Basel Committee on Banking Supervision published the agreed text in June 2004 with the aim of revising the standards governing the capital adequacy of internationally active banks. This accord requires banks and other deposit takers to use fair or market value for their assets. This requirement has led to the securitisation of property portfolios in the UK (a listed share has a market price so can be valued daily as opposed to a portfolio of hundreds of buildings which at best are valued only quarterly). The fair value approach also led in part to securitisations of mortgage portfolios, but that is another story. The EU enshrined the principles of Basel II in a banking law, which became effective on January 1 2008. Other countries have adopted it too: India joined in April 2008 and its banks must comply by April 1 2009; US banks must comply by January 2009. Once the listed market became saturated with UK property companies, and premium ratings fell to discounts, new fund launches began to focus on overseas property. First, into western Europe and then further east: central and eastern Europe (CEE), south- eastern Europe (SEE), Ukraine and Russia. A similar trend in the Far East: India, China and Vietnam. Several countries had more than one rival issue, often trying to launch at the same time. To attract new money, these new funds not only had to have a different geographical remit but also had to offer better terms. Typically, the first entrant into a new market could charge more (in terms of fees), and get away with being less experienced: overall returns were geared more toward the manager than shareholders. Second and later launches had to be more attractive than previous ones to encourage new investors. These later ones tend to have better managers, lower fees and returns are more aligned to shareholders’ interests. For example, earlier funds had launch costs of 5%, 2% annual management fees (including fees based on uninvested cash) and performance fees based on value increases. Later launches offered better terms such as 3% launch costs, 1% management fees and a performance fee based on shareholders’ returns and not on NAV. Current best practice is to have: local based and experienced managers with a good track record; a portfolio with some initial assets (i.e. not a blind pool); a focus on giving a return to shareholders either through dividends or a fixed wind up date; managers’ interests that are aligned with those of shareholders. For example, performance fees should depend on cash returns to shareholders and a proportion of the managers’ fee should be paid in shares or held back until the wind up. Attention also needs to be given on how to address the discount between the share price and the NAV. Wide discounts now are discouraging new issues and private placement is the preferred route. AIM is perceived as bringing illiquidity. Euronext or dual listing on a local exchange is being explored by several companies. Basel II Sector expands to non-UK property Shareholders demand better terms Current best practice Open-ended funds Values rise and fall
  • 21. Autumn 2008 Building the Future 21 Most new launches over the last six years have focused on the same small band of shareholders, often less than twenty. Typically, these are large, UK-based funds of funds or hedge funds. This grouping was a rich and easy seam for the issuing brokers’ sales team to tap. Secondary sales were insufficient to widen the shareholder base. Consequently, the share registers of many companies is small and each holder holds a large amount of shares. Some of the original shareholders have had their own problems in the last six months – either facing redemptions or more stringent banking requirements. This situation has required them to sell positions, even if they are still believers in the ability of the fund manager or CEO and of the sector in which he invests. Forced sellers have included property unit trusts facing redemptions from private clients; holders who are selling in a perceived flight to quality; and hedge funds where access to credit lines has been restricted. Large real estate transactions have dried up. There are few cash rich institutions around; those there are see no rush to buy when property prices are still forecast to fall. Selling pressure predominates, new buyers have not been found and discounts have widened. The widening discount has attracted a newer set of activist shareholders. They use the arbitrage between the discount and an index that represents the underlying assets as nearly as possible. They make money by narrowing the discount even if asset values are falling. They are usually not long-term investors. Their modus operandi is typically to get the company to sell assets and to return cash to shareholders and may ultimately lead to a wind-up of the company. New long-term investors that are currently attracted to the listed sector are cash rich investors, for example, sovereign wealth funds of oil rich nations. These buyers usually prefer to buy direct property or real estate/infrastructure projects but the current wide discounts in the listed market present a much cheaper way to invest. Gearing Property portfolios of fully let investment properties had been geared up, usually to 70% as the gap between property yields and bank loan interest rates meant that the higher the gearing, the better dividend to shareholders. In good times, this structure meant higher NAV growth at the per equity share level. As property values fall, in a geared portfolio the NAV falls further. This leads to an increase in the loan to value (‘LTV’) ratio. Banks stipulate maximum allowed LTVs (e.g. 85%) and income cover for their loan’s interest (e.g. 150%). These covenant levels are usually tested only at set times per year (e.g. quarterly). As the test approaches, managers of companies nearing any breach should be able to sell assets and repay the loan to stay within the LTV covenant. This process is sensible when the debt and assets are matched and both are as easy to liquidate as each other. The current market means that managers cannot de- gear quickly enough, because they are not able to sell sufficient properties to repay debt. In contrast, development projects need access to capital to fund the construction stage. The availability of this financing has become severely restricted across the world. Where projects are still able to secure construction financing, it is usually because the projects are not speculatively built; have a high proportion of space pre-let; the developer is experienced, well financed and has a good track record of project completion on time and within budget. Currently, we see companies’ development project pipelines being severely curtailed. Companies are focusing only on those projects that already have financing in place. Investors can get a good idea of the rating of a project and of its developer by seeing the continued support for the project from the local bank. Original shareholders New shareholders – activists New shareholders – long-term holders Investment properties Development projects Forced sellers
  • 22. Building the Future Autumn 2008 22 About the fact sheet layout Each fact sheet contains: • A summary snap shot of what new investors might need to consider before buying into a company. This is meant as a first sift only, further work would normally be required before investing. We have a daily list of current trading data on all companies – available by email on request; • A summary of the company’s objective, trading information on LHS; • An outline of the portfolio: largest assets, geographic and sector breakdown, manager biography and the investment strategy; One page per company is necessarily brief. We have more information available on request. In many cases, we have recently met managers so we have details on current trading and future prospects. Also, we have annual and interim accounts, prospectuses and company fact sheets. It is important also to consider who the shareholders are and their plans for the company. For example, if 70% is owned by the manager, then minority investors will clearly not have much influence. If activist short-term shareholders dominate then we expect boardroom changes and more immediate action to move the share price. If shareholders are institutions who have trouble with their own investors, then forced sellers may predominate and the share price may languish. We also have shareholder information; discounts; share trading volume; and more detail on individual properties/projects. Abbreviations To save space, we have used abbreviations and shorthand throughout: • Notice period = How much notice is required by the managers of the company to be removed from office – for example, in a takeover or in a shareholders’ forced wind- up situation. “3yrs; 1yr” means initially three years’ notice is required from launch and only one year’s notice thereafter. Normally, the manager is prepared to give up running the company in less than the full notice period but on payment of an amount equal to the lost fees. • AMC = Annual Management Charge. This applies to funds rather than trading companies. The AMC is usually based on total gross assets (e.g. 2%). • Performance fee = The fee paid to managers is calculated as a percentage of the gain in value above a certain return. This should incentivise managers. For example, “20% of the outperformance of the net assets over a certain hurdle rate”. The hurdle rate could be a fixed percentage figure or reference to a specific benchmark index. This gives rise to the common phrase “two and twenty” = 2% annual management fee + 20% performance fee. The details on just about all the companies are different – net or gross, on distributed returns to shareholders or on audited NAV gain, paid partly in shares, held back to the end of the life, different AMC if growth is positive than if negative; high water mark (HWM), based on share price. We have more detail on the AMC and performance fee for each company which space necessarily prevents us from showing here. Please contact us if this is required. Shareholder information More detail on request
  • 23. Autumn 2008 23 Listing Details Bloomberg 3IN LN Exchange LSE ISIN JE00B1RJLF86 Domicile Jersey Launch date 13-Mar-07 Market value £778.55m Market value US$1,189.78m Investment Focus Geography Europe – North America – Asia Strategy Investor Sector Infrastructure Current Trading Price 96.00p NAV per share 108.60p NAV date 31-Mar-08 NAV frequency H Next NAV announced 22-Nov-08 Discount -11.6% Dividend yield 2.06% Share Price & NAV Since Launch 80 85 90 95 100 105 110 115 120 Mar-07 Mar-08 Source: Proquote and Libertas Capital Assets No. of properties/projects 9 Total assets £784.8m Cash £253.7m % cash 32.3% Loans £0.0m Gross gearing 0.0% Net gearing -32.3% Management Company structure Fund Management group 3i investments plc Annual fee 1.5% Performance fee 20% over 8% Management notice period 1yr Key individual Michael Queen Tel. +44 (0)7975 3572 E-mail michael.queen@3i.com Valuer Own valuation Website www.3i-infrastructure.com 3i Infrastructure plc Company Summary 3i Infrastructure plc (3IN) is a Jersey-incorporated investment company that invests in infrastructure businesses and assets. It was admitted to the LSE on March 13 2007 and became a constituent of the FTSE 250 index on September 24 2007. 3i Infrastructure aims to build a diversified portfolio of infrastructure investments across the globe, with an initial focus on Europe, North America and Asia. Fundraising: £703m at IPO in March 2007; £115m in July 2008. Analyst’s Comment 3IN is cash-rich and has been able to invest in debt instruments at low prices, given the current state of the credit market. It does not have a problem with over gearing, nor restricted access to financing. 3IN has a good dividend policy and has increased the interim by 5% to 2.1p. Its assets are relatively mature and most are in the income producing stage. We believe there is every chance that 3IN will be able to improve its dividends as more assets mature and since many of the projects will have revenues that increase in line with inflation. Once fully invested its dividend target is 5% on opening NAV at IPO of 98p, i.e. 4.9p p.a. This puts the shares on a 5.6% prospective dividend yield and a 19% discount to current NAV. 3IN is a good haven to weather the current financial storm. (Nov-04-08) Portfolio Summary Infrastructure businesses tend to be asset-intensive enterprises that provide essential services over the long term, often on a regulated basis or with a significant component of revenue and costs that are subject to long-term contracts. Portfolio - Top Five Projects Project Cost (£m) Directors' Valuation (£m) Income (£m) Asset Total Return (£m) Equity Interest (%) Anglian Water 140.0 159.6 8.7 28.3 9 Infrastructure Investors LP 106.1 125.1 10.7 29.7 31.2 Octagon 13.2 13.6 1.2 1.6 26.3 Alpha Schools 0.2 0.3 - 0.1 50 Oystercatcher 84.5 98.3 5.5 19.3 45 Source: 3IN at March 31 2008 Sector Distribution Geographic Distribution Maturity Distribution Sector % Geography % Maturity % Utilities 44 UK 70 Mature 53 Social infrastructure 36 Continental Europe 22 Operational growth 38 Transportation 20 Asia 8 Early-stage 9 Source: 3IN at March 31 2008 Investment Manager Mr Queen joined 3i in 1987 and is currently the Managing Partner of 3i’s infrastructure business after several years as 3i Global Head of Growth Capital. He is part of 3i’s Management Committee. During his time at 3i he has worked in a number of offices in various roles and, in 1994, he was seconded to HM Treasury to help to develop the potential for the Private Finance Initiative in the NHS as head of the NHS Private Finance Unit. Mr Queen has invested across a broad range of sectors, but has a particular focus on healthcare and financial services. He has been closely involved in the investment decisions for most of the transactions in the overall track record. Mr Queen has a BA (Hons) Industrial Economics from Nottingham University and is a qualified chartered accountant. He is a member of the CBI's Financial Services Council. In 2002/2003 he was chairman of the British Venture Capital Association. Investment Strategy To create a balanced portfolio 3IN invests in infrastructure assets across the different stages of the asset life cycle, including assets that are at an early stage of development, most likely to be PFI/PPPs, where the potential for capital growth exists, but yields tend to be limited until operational ramp up. It also invests in assets, including PPP projects and privatisations, that are undergoing a period of operational ramp up, following construction, and which generate yields and capital growth. In addition, 3IN invests in mature assets that are in a steady operational state and generate predictable returns and yields, often correlated to GDP, with some capital growth.
  • 24. Autumn 2008 24 Listing Details Bloomberg ABL LN Exchange AIM ISIN GG00B1LB2139 Domicile Guernsey Launch date 07-Feb-07 Market value £46.80m Market value US$71.52m Investment Focus Geography Budapest – Prague – Bucharest Strategy Developer Sector Commercial - Residential Current Trading Price 44.75p NAV per share €4.41 NAV date 30-Jun-08 NAV frequency H Next NAV announced 26-Mar-09 Discount -88.1% Dividend yield 0.08% Share Price & NAV Since Launch 2.9 3.1 3.3 3.5 3.7 3.9 4.1 4.3 4.5 4.7 30 80 130 180 230 280 330 Feb-07 Feb-08 Price(GBX) (L.H.S) NAV(EUR) (R.H.S) Source: Proquote and Libertas Capital Assets No. of properties/projects 54 Total assets €654.2m Cash €16.7m % cash 2.6% Loans €255.0m Gross gearing 39.0% Net gearing 36.4% Management Company structure Trading Management group Self-managed Annual fee n/a Performance fee n/a Management notice period n/a Key individual Uri Heller Tel. +36 1 225 6600 E-mail avidan@ablon-group.com Valuer King Sturge Website www.ablon-group.com Ablon Group Ltd Company Summary Ablon Group Limited (ABL) is a Guernsey-incorporated holding company of a group whose core business is the sourcing, acquisition, construction, ownership, leasing, servicing and management of a diverse portfolio of commercial property, and the acquisition, construction and sale of residential properties in Hungary, the Czech Republic and Romania, primarily in Budapest and Prague. The group employs a ‘build and hold’ strategy for its commercial properties, which means that it generally retains developments once completed and leases them to tenants, while residential projects are typically sold once developed. The group believes that it is one of the leading real estate development businesses in Budapest and it has a well-established presence in Prague. Through the development of its large and diverse real estate portfolio, the group has obtained significant property development and management experience, first-hand knowledge of regional markets, relationships and contacts with local owners, brokers and tenants, and an understanding of the needs and behaviour of public sector and corporate tenants. In addition, ABL is vertically-integrated along the spectrum of the real estate development value chain from the sourcing, purchase and construction of projects to the marketing, sale, rental, operation and servicing of its properties. Portfolio Summary As at March 25 2008, ABL’s portfolio comprised properties at 28 different locations, split into 54 different projects or phases of which there were 13 completed projects and 16 development projects. There were 17 property locations in Budapest, with a total of 29 phases of development, comprising 11 completed projects (including Zöldváros Residential Park which had sold 239 out of the 240 flats) and 18 development projects. ABL also has properties at seven locations in Prague, with a total of ten phases of development, comprising three completed projects and seven development projects. In Bucharest there are properties at four locations, with a total of twelve phases of development, comprising twelve development projects.The group also has property at two locations in Poland, with a total of five phases of development. Portfolio - Top Five Projects Project City Sector Area (sq.m) Value (€m) Completion Gateway Budapest Office 36,300 80 Yielding Business centre 99 Budapest Office 53,300 63.2 2011 Kolben Prague Mixed-used 73,000 54.3 2010 Blaha Centre Budapest Hotel 17,700 41.2 - M3 business centre Budapest Office 18,100 30.8 3Q08 Source: ABL at August 31 2008 Sector Distribution Geographic Distribution Sector Properties % Geography Properties Value (€m) % Office 12 45 Budapest 17 415 67 Residential 6 23 Prague 6 119 19 Retail 2 7 Bucharest 3 82 13 Hotel 4 14 Warsaw 1 - - Mixed-use 3 11 Total 27 616 100 Source: ABL at August 31 2008 Investment Manager Mr Heller was appointed as a director on October 16 2006. Prior to joining the group, he was managing director for Orlano Ltd / Danly Investments Ltd, an investment company and, from 1990 to 1994, the general manager of the Danel Group, a residential real estate development company in Israel. Mr Heller has spent more than ten years developing his expertise in property investment and property development in central and eastern Europe, specialising in Hungary and the Czech Republic. Mr Heller studied engineering in Israel and is a member of the Israeli Engineering Association. Investment Strategy ABL focuses on execution of current development projects to expand and develop its initial portfolio. It continues to acquire attractive sites for future commercial property and residential development. In Budapest it seeks to maintain a leading position and continues to grow its operations in Prague, Bucharest and Poland. The group’s strategy is to expand operations in other neighbouring markets in major cities where attractive opportunities exist. ABL employs clearly defined strategies for each operating and business segment and optimises capital structure.
  • 25. Autumn 2008 25 Listing Details Bloomberg TAP.LN Exchange LSE ISIN GB00B05LNH5 Domicile Guernsey Launch date 08-Feb-05 Market value £22.13m Market value US$33.81m Investment Focus Geography UK Strategy REIT Sector Commercial Current Trading Price 15.50p NAV per share 76.40p NAV date 30-Sep-08 NAV frequency Q Next NAV announced 21-Jan-09 Discount -79.7% Dividend yield 41.93% Share Price & NAV Since Launch 30 40 50 60 70 80 90 100 110 120 Feb-05 Feb-06 Feb-07 Feb-08 Source: Proquote and Libertas Capital Assets No. of properties/projects 75 Total assets £246.1m Cash £7.3m % cash 3.0% Loans £117.7m Gross gearing 47.8% Net gearing 44.9% Management Company structure Fund Management group Valad Asset Mgt Annual fee 0.65% Performance fee n/a Management notice period 30/9/2010; 1yr Key individual Chris Carter Keall Tel. +44 (0)20 7659 6730 E-mail chris.carterkeall@valad.co.uk Valuer Cushman & Wakefield Website www.tapincome.com Advantage Property Income Trust Ltd Company Summary The Advantage Property Income Trust Limited was launched in February 2005 as a high income UK diversified commercial property company. TAP is a closed-ended property investment company domiciled in Guernsey and listed on both The Channel Islands and London Stock Exchanges. The property fund advisor is Valad Asset Management (UK) Ltd, whose mandate is to increase income, grow dividend cover and ultimately dividends. TAP was launched to provide investors with the opportunity to benefit from investing in commercial property. Historically, this has not been possible due to the capital size of each asset, the illiquidity of real estate and the complexity and cost of the management/ownership. TAP was one of the forerunners to the REIT legislation introduced on January 1 2007. Its foundation has many similarities to the Australian LPT and the US diversified REIT. Within commercial property portfolios, diversity is the name of the game, with the correct balance between office, industrial and retail property being important, as market forces affect each sector differently. The company currently has two separate sources of debt, as shown in the table below. Analyst’s Comment Financial highlights as at September 30 2008: £220m property assets; 73 properties; Gearing 53% (LTV); £117m loan at 5.8% average interest rate; average lease length 6.5 years; void 7.7%; NAV: 76.4p; TAP managers are now focused on asset management initiatives to increase revenues. Gearing is still high, but beneath its covenants (normally at around 75% LTV). The shares are on a discount of 69%. However, the managers and their valuers CBRE still paint a gloomy picture of the outlook for UK commercial property. Whilst we applaud TAP manager’s asset management initiatives to increase rents, the high gearing will continue to knock the NAV per share. (November 4 2008). TAP is selling five properties for £4.2m, 1.8% above previous valuation (at June ‘08) and at 6.0% yield. TAP is also repaying £2.2m of debt. The company’s current strategy is one of selling smaller properties after end of value adding management initiatives. The portfolio is now £234m. The sale price is above valuation so is NAV enhancing, but there are likely to be falls in value elsewhere in the portfolio. TAP’s NAV was 87.6p as at 30/6/08, which puts the shares at 52% discount and 15% yield. We applaud the strategy of sales of mature assets and de-gearing. (Oct-7-08) Portfolio - Largest Properties Property Location Valuation % The Brunel Centre Bletchley 5.34 Waterfront Business Park Fleet 4.81 National Westminster House Guernsey 4.81 Brunswick Point Leeds 4.72 The Links Warrington 4.15 Kingscourt Leisure Complex Dundee 4.03 Silver Court Welwyn Garden City 3.52 Source: Fundamental Data at November 04 2008 Geographic Distribution Sector Distribution Country % Sector % South East 36.36 Offices 36.82 Scotland 11.56 Industrial 21.30 East Midlands 10.17 Retail Warehousing 19.89 West Midlands 9.44 Retail 17.96 Yorkshire & Humberside 7.49 Leisure 4.03 North West 6.98 Channel Islands 4.81 Source: Fundamental Data at November 04 2008 Investment Manager Mr Carter Keall is responsible for fund management of the company's investment portfolio. He has over 18 years’ experience in the commercial property investment market, with the past ten years spent managing over £1.5bn of assets at Arlington and Hammerson. He is an active member of the Investment Property Forum and gained his honours degree at the University of the South Bank. He was formerly director of fund management, accountable for the Arlington Business Park Partnership and latterly the UK direct mandate for a Middle Eastern Investor. Investment Strategy TAP invests in a diversified portfolio of commercial property in the United Kingdom and the Channel Islands.
  • 26. Autumn 2008 26 Listing Details Bloomberg AFID LI Exchange TASE & LSE ISIN US00106J2006 Domicile Cyprus Launch date 01-Aug-07 Market value £254.83m Market value US$373.60m Investment Focus Geography Russia Strategy Developer Sector Commercial – Residential Current Trading Price 117.00 NAV per share US$12.10 NAV date 30-Jun-08 NAV frequency H Next NAV announced 25-Mar-09 Discount -96.1% Dividend yield 0.5% Share Price & NAV Since Launch 0 2 4 6 8 10 12 14 Aug-07 Aug-08 Source: Proquote and Libertas Capital Assets No. of properties/projects 34 Total assets US$2,952.3m Cash US$796.0m % cash 27.0% Loans US$350.2m Gross gearing 11.9% Net gearing -15.1% Management Company structure Trading Management group Self-managed Annual fee n/a Performance fee n/a Management notice period n/a Key individual Alexander Khaldey Tel. +7 495 796-99-88 E-mail dandrienko@sik.ru Valuer Jones Lang Lasalle Website www.afi-development.net AFI Development plc Company Summary AFI Development plc (AFID) develops multi-purpose properties in and around Moscow, St Petersburg, Perm and Volgograd. AFID develops and redevelops high quality commercial and residential real estate assets including offices, shopping centres, hotels, mixed-use properties, and residential projects. Its strategy is to sell the residential properties it develops and to either lease the commercial properties or sell them for a favourable return. The GDRs of the company listed on the LSE in May ‘07 raising a total of US$1.4bn. AFID’s controlling shareholder is Africa Israel Investments Ltd, an international real estate investment and development group based in Israel with over 70 years' experience in real estate development. Incorporated in Cyprus in 2001, AFID is currently one of the few developers in Russia building large-scale, integrated and high profile commercial and residential properties to international standards. AFID has a portfolio of existing Russian development projects, a substantial pipeline of other real estate investment opportunities across Russia and a strong management team, comprising local professionals and international real estate experts. Analyst’s Comment Market outlook: Over 1H08 foreign and domestic investors continued to show strong interest in commercial and residential real estate market segments thanks to the growth of confidence in the Russian economy, high demand from tenants, and the shortage of available premises on the market, with most interest centred on Moscow. According to the real estate forecast in the ‘Emerging Trends in Real Estate Europe 2008’* Moscow ranked first among this year's top real estate markets in Europe for both investment and development prospects. Reduced money supply caused by the global credit tightening and recent withdrawal of western investors from the market should mean focus is increased on the larger, higher quality and less risky projects. Demand for new quality properties in Moscow far exceeds the supply. AFID has 34 projects in 20 locations, which have a combined market value on completion of US$22bn. This is one of the largest London-listed Russian property developers and has a diversified spread of projects. As there is increasing concern about western ownership of directly held assets (whether real estate or private equity), investors should consider getting their exposure to Russia via investing in London-listed AFID. AFID reports a significant slowdown in residential apartment sales. It has scaled back plans for future projects and, having more cash than needed for the remaining three core projects, will be returning $200m to investors. AFID is in a good financial position, which cannot be said of other over-geared Russian developers. The market fundamentals seem to have turned, but AFID looks like it will survive. (Nov-19-08) Portfolio Summary AFID’s portfolio comprises 34 residential, commercial and mixed-use real estate projects in 20 locations in Russia and Ukraine, with over 3.8 million sq.m under development. 90% of AFID’s projects are based in Moscow. The projects include office, retail and residential premises, multi-functional complexes and hotels. Results for 9M to 30/9/08: profits down 67% to US$28m; strong liquidity position, cash of US$569m; construction of core projects on schedule; general slowdown of rental demand; significant slowdown of residential apartment sales; $200m special dividend ($0.38 p/share) after scaling back future development plans. Cash in excess of short-term liabilities. Portfolio - Largest Properties Property Portfolio (%) Net Assets (%) Value (US$m) Moscow City Centre, Shopping Centre 21.44 19.93 1,264.00 Kuntsevo 12.15 11.30 716.68 Tverskaya Zastava, Plaza I 8.42 7.82 496.35 Tverskaya Zastava, Plaza IV 7.68 7.14 453.05 Tverskaya Zastava, Plaza II 7.05 6.55 415.48 Otradnoye 6.91 6.42 407.35 Tverskaya Zastava, Shopping Centre 5.32 4.94 313.50 Source: Fundamental Data at June 30 2008 Portfolio Distribution Country % Value (US$m) Cash 21 569 Investment Properties 9 241 Developments 51 1,411 Total Assets 100 2,760 Source: AFID at September 30 2008 Investment Manager Mr Khaldey is a director and the CEO of AFID. He has served as CEO of Stroyinkom-K since March 2001. He co- founded AFI Development plc and owns a 9% stake in the company through Nirro Group S.A. He has over 30 years’ experience, including work at the Zhiliiproekt Institute and the Ukrspetssatalkonstruktsia Construction Union. He graduated from Dneprepetrovsk Metallurgical Insitute in 1973, with a degree in Industrial Heat Power Engineering. Investment Strategy AFID develops integrated large-scale and complex projects in attractive locations, which generate better returns and increase the overall value for the neighborhood. AFID sells residential property and keep-to-operate commercial property. In addition, it continues to acquire and fund real estate developments that meet its project evaluation criteria and enhance the number of projects in different development phases. *Published by the Urban Land Institute (ULI) and PricewaterhouseCoopers LLP recently.
  • 27. Autumn 2008 27 Listing Details Bloomberg AISI LN Exchange AIM ISIN CY0100441019 Domicile Cyprus Launch date 01-Aug-07 Market value £10.09m Market value US$15.42m Investment Focus Geography Ukraine Strategy Investor Sector Commercial – Residential Current Trading Price 5.25p NAV per share US$0.74 NAV date 30-Jun-08 NAV frequency H Next NAV announced 01-May-09 Discount -89.2% Dividend yield - Share Price & NAV Since Launch 0.6 0.62 0.64 0.66 0.68 0.7 0.72 0.74 0.76 0.78 0.8 0 5 10 15 20 25 30 35 40 45 50 Aug-07 Aug-08 Price(GBX) (L.H.S) NAV(USD) (R.H.S) Source: Proquote and Libertas Capital Assets No. of properties/projects 5 Total assets US$147.2m Cash US$6.7m % cash 4.6% Loans US$0.1m Gross gearing 0.1% Net gearing -4.5% Management Company structure Fund Management group Aisi Realty Capital Annual fee 2.5% Performance fee 20% over 15% hurdle Management notice period - Key individual Beso Sikharulidze Tel. +380 44 459 3000 E-mail Beso@aisicapital.com Valuer DTZ Website www.aisicap.com Aisi Realty Public Ltd* Company Summary Aisi Realty Public Limited (AISI), a closed-ended investment company incorporated in Cyprus, was established in June 2005 to make investments in the real estate market in Ukraine. The company was set up with the intention of providing shareholders with attractive returns, principally from capital appreciation through investment in real estate development projects and related investments, principally in and around the major population centres of Ukraine, with a particular focus on Kiev. AISI's assets are managed by Aisi Realty Capital LLC, a Boston-based investment management company with a presence in Kiev. The Investment Manager intends to capitalise on its local knowledge of the region and real estate development experience to: source real estate investment opportunities (including development projects) at attractive prices; manage and oversee these investments; and structure and execute appropriate exit strategies. Analyst’s Comment AISI, a real estate developer in Ukraine, focused on Kiev, is a £46m market value investment company which listed on AIM in August 2007. AISI has four development projects, with ten others in the pipeline. The valuation of current investment projects is up 59% in just six months to US$90m, with total assets at US$143m. (Oct ‘08) Projects update: The most important project is the 49,200 sq.m Brovary Logistic Centre. It is 27km to the north-east of Kiev, near Boryspil international airport on the Kiev-Moscow highway. This will be one of the first Class A logistics warehouses in Ukraine. Construction work will be completed by the end of 2008 and final fitting-out for the tenant shortly afterwards, and will be occupied by February 2009. The single tenant is UVK, a leading Ukrainian logistics operator, which has signed a ten year lease. Now that this project is nearly finished and fully tenanted AISI has been arranging banking finance. The new loan will total US$37.3m from the European Bank of Reconstruction and Development (EBRD), although half of this will be syndicated to other banks. This will free up c.US$35m to be recycled into existing and/or pipeline projects. The estimated construction costs for the Brovery project are now US$53m, including VAT. Once occupied and income producing (c.13% yield p.a.), this project will be ready for sale. The other project in Odessa should complete in October 2009. (Oct ‘08) Ukraine economy comment: The IMF has in principle agreed a US$16bn loan to Ukraine (the fact that it is to the IMF that the country turned for help shows how pro-West the Ukraine has moved). How beneficial this will be for the country depends on what strings are attached. The transaction still needs to be approved by Ukraine’s government, but this was recently dissolved. New elections originally scheduled for early December may be brought forward to speed this loan approval process. (Oct ‘08) AISI’s financing needs: AISI itself has no debt and so is not geared into falling prices. (Oct-27-08) Portfolio - Significant Projects Projects Sector Location GFA (sq.m) Project Cost ($m) Completion Kyanivsky Lane Residential/Office Kiev 27,890 68 2H10 Brovary Logistic Centre Warehouse Kiev 49,180 53 2H08 Tsymlianskogo Lane Residential/Office Kiev 7,134 18 2H09 Bela Logistic Park Warehouse Odessa 103,000 109 2H09 Podil Residential/Office Kiev 37,900 78 2H10 Source: AISI at June 30 2008 Geographic Distribution Country % Value (US$m) Ukraine 103.12 127.949 Source: Fundamental Data at June 30 2008 Investment Manager Mr Sikharulidze was one of the founding principals of the Investment Manager. For 13 years he was a portfolio manager at Fidelity Investments, where he developed significant investment experience in diverse geographic regions. He held a wide range of positions at Fidelity Investments, including Portfolio Manager for Fidelity Health Care, Fidelity Advisor Health Care Funds, Fidelity Convertible Securities Fund, Fidelity Advisor Aggressive Growth Fund and Fidelity Mid-Cap Stock Fund. Mr Sikharulidze holds a BSc in Mechanical Engineering from Georgia Institute of Technology and an MBA from Harvard Business School. Mr Sikharulidze’s particular areas of responsibilities, in addition to ensuring the overall success of the investments, are: fund-raising, Initial evaluation of possible sites. Investment Strategy Aisi Realty Public Limited is engaged in the principal activity of making investments in the real estate market in Ukraine. The company focuses primarily on the capital city, Kiev. In May 2007 AISI sold Aisi Taurus LLC and its interest in the Tarasovskaya project. In September 2007 it acquired an outdoor advertising company. *Libertas Capital is NOMAD and broker to this company.
  • 28. Autumn 2008 28 Listing Details Bloomberg ALPH LN Exchange LSE ISIN GB00B0P6FY18 Domicile Guernsey Launch date 29-Nov-05 Market value £52.29m Market value US$79.91m Investment Focus Geography France – Spain Strategy Investor – REIT Sector Commercial – Residential Current Trading Price 44.50p NAV per share 82.00p NAV date 30-Sep-08 NAV frequency Q Next NAV announced 10-Mar-09 Discount -45.7% Dividend yield 12.36% Share Price & NAV Since Launch 30 40 50 60 70 80 90 100 110 120 Dec-05 Jan-07 Jan-08 Source: Proquote and Libertas Capital Assets No. of properties/projects 19 Total assets £326.5m Cash £25.6m % cash 7.8% Loans £193.0m Gross gearing 59.1% Net gearing 51.3% Management Company structure Fund Management group Alpha Real Capital Annual fee 1% of gross assets Performance fee 20% over 12%; 35% over 20% Management notice period 8yrs; 8yrs Key individual Phillip Rose Tel. +44 (0)20 7591 1637 E-mail mary-annlitchfield@alpharealcapital.com Valuer Knight Frank Website www.alphapyreneestrust.com Alpha Pyrenees Trust Ltd Company Summary Alpha Pyrenees Trust Limited (ALPH) is a closed-ended investment company. ALPH carries on business as a property investment company, investing in commercial property in France and Spain, and owns a diversified portfolio of approximately £274m. Of the total property portfolio, 88% is invested in France and 12% in Spain in terms of capital value. Analyst’s Comment ALPH has a portfolio value c.£300m in c.20 commercial investment properties in France and Spain, with a 7.5% portfolio yield and average lease length of around five years. Its tenant quality is high (more than 80% of the income is from ‘prime’ tenants), so its revenue stream looks secure. Like other property investment companies, ALPH is highly geared but this is comfortably below its bank loan covenant ceiling of 85% LTV. The £193m debt is well- structured, with a low interest rate of 5.26% fixed to 2015. The combination of low interest rates on its loan and high rental yields on its portfolio means that ALPH can pay a good dividend: 7p is forecast for the full year. The managers remain cautious on taking out more loans and on buying new properties, by which they mean property values are going to carry on falling through 2008. (Sept-08-08) Portfolio Summary ALPH owns a portfolio of fifteen properties in France and four properties in Spain, totalling approximately 260,000 sq.m (approximately 2.77 million sq.ft) of commercial real estate. The properties are well let, well located and offer good value accommodation to occupiers. The valuation of this portfolio as at June 30 2008 showed a total of approximately £281m (€355m). Portfolio - Largest Properties Property Portfolio (%) Net Assets (%) Value (£m) Villarceauz Nozy Business Park 38.19 99.9 107.2 Aubervilliers Offices 7.23 19.92 20.3 Cordoba Retail Park (Spain) 6.27 17.27 17.6 Goussainville Offices 6.02 16.58 16.9 Champs sur Marne Offices 5.02 13.83 14.1 St Cyr L'Ecole 4.42 12.17 12.4 Athis Mons 3.85 10.6 10.8 Source: Fundamental Data at June 30 2008 Sector Distribution Geographic Distribution Sector % Country % Value (£m) Industrials 27 Cash & Fixed Interest 3.53 10.276 Office 64 France 85.23 248.000 Shopping Centres 9 Spain 11.24 32.700 Source: Fundamental Data at June 30 2008 Investment Manager Mr Rose has over 25 years’ experience in the real estate, fund management and banking industries in Europe, the USA and Australasia. He has been the head of real estate for ABN AMRO Bank, chief operating officer of the European shopping centre investor and developer TrizecHahn Europe, managing director of Lend Lease Global Investment and executive manager of the listed fund General Property Trust. Mr Rose is currently a non-executive director of Great Portland Estates and a member of the management committee of the Hermes Property Unit Trust. Alpha Real Capital is an FSA-regulated property fund advisory business. It complements its own international investment, development and asset management skills by working, where appropriate, with local real estate partners in India. Alpha Real Capital seeks to generate high total returns for the company’s investors. It believes these will be generated by a combination of profit from development activity, income yield and capital growth driven by income growth, active asset management and yield compression in the investments it makes. Alpha Real Capital is owned jointly by Sir John Beckwith and the Alpha team. The Alpha team has extensive operating experience of investing, financing, developing and managing real estate throughout Europe, USA and Pacific including UK, France, Spain, Italy, Germany, Austria, Netherlands, Portugal, Greece, Poland, Hungary, Czech Republic, Slovakia, Japan, Singapore, Hong Kong, Indonesia, Thailand and Australia. Investment Strategy ALPH generates returns for investors through acquiring real estate with yields in excess of its cost of borrowing, which has the potential for income growth and/or enhanced returns from active asset management. The company generally targets properties with low vacancy levels, solid tenant covenants strength and good re-letting potential .