Download as PDF, PPTX
![tid1 tid2 Linkage
metadata
a b tid1 tid
2
c
a b tid1 tid
2
c
a b tid1 tid
2
c
Graph Pipeline – Powered by
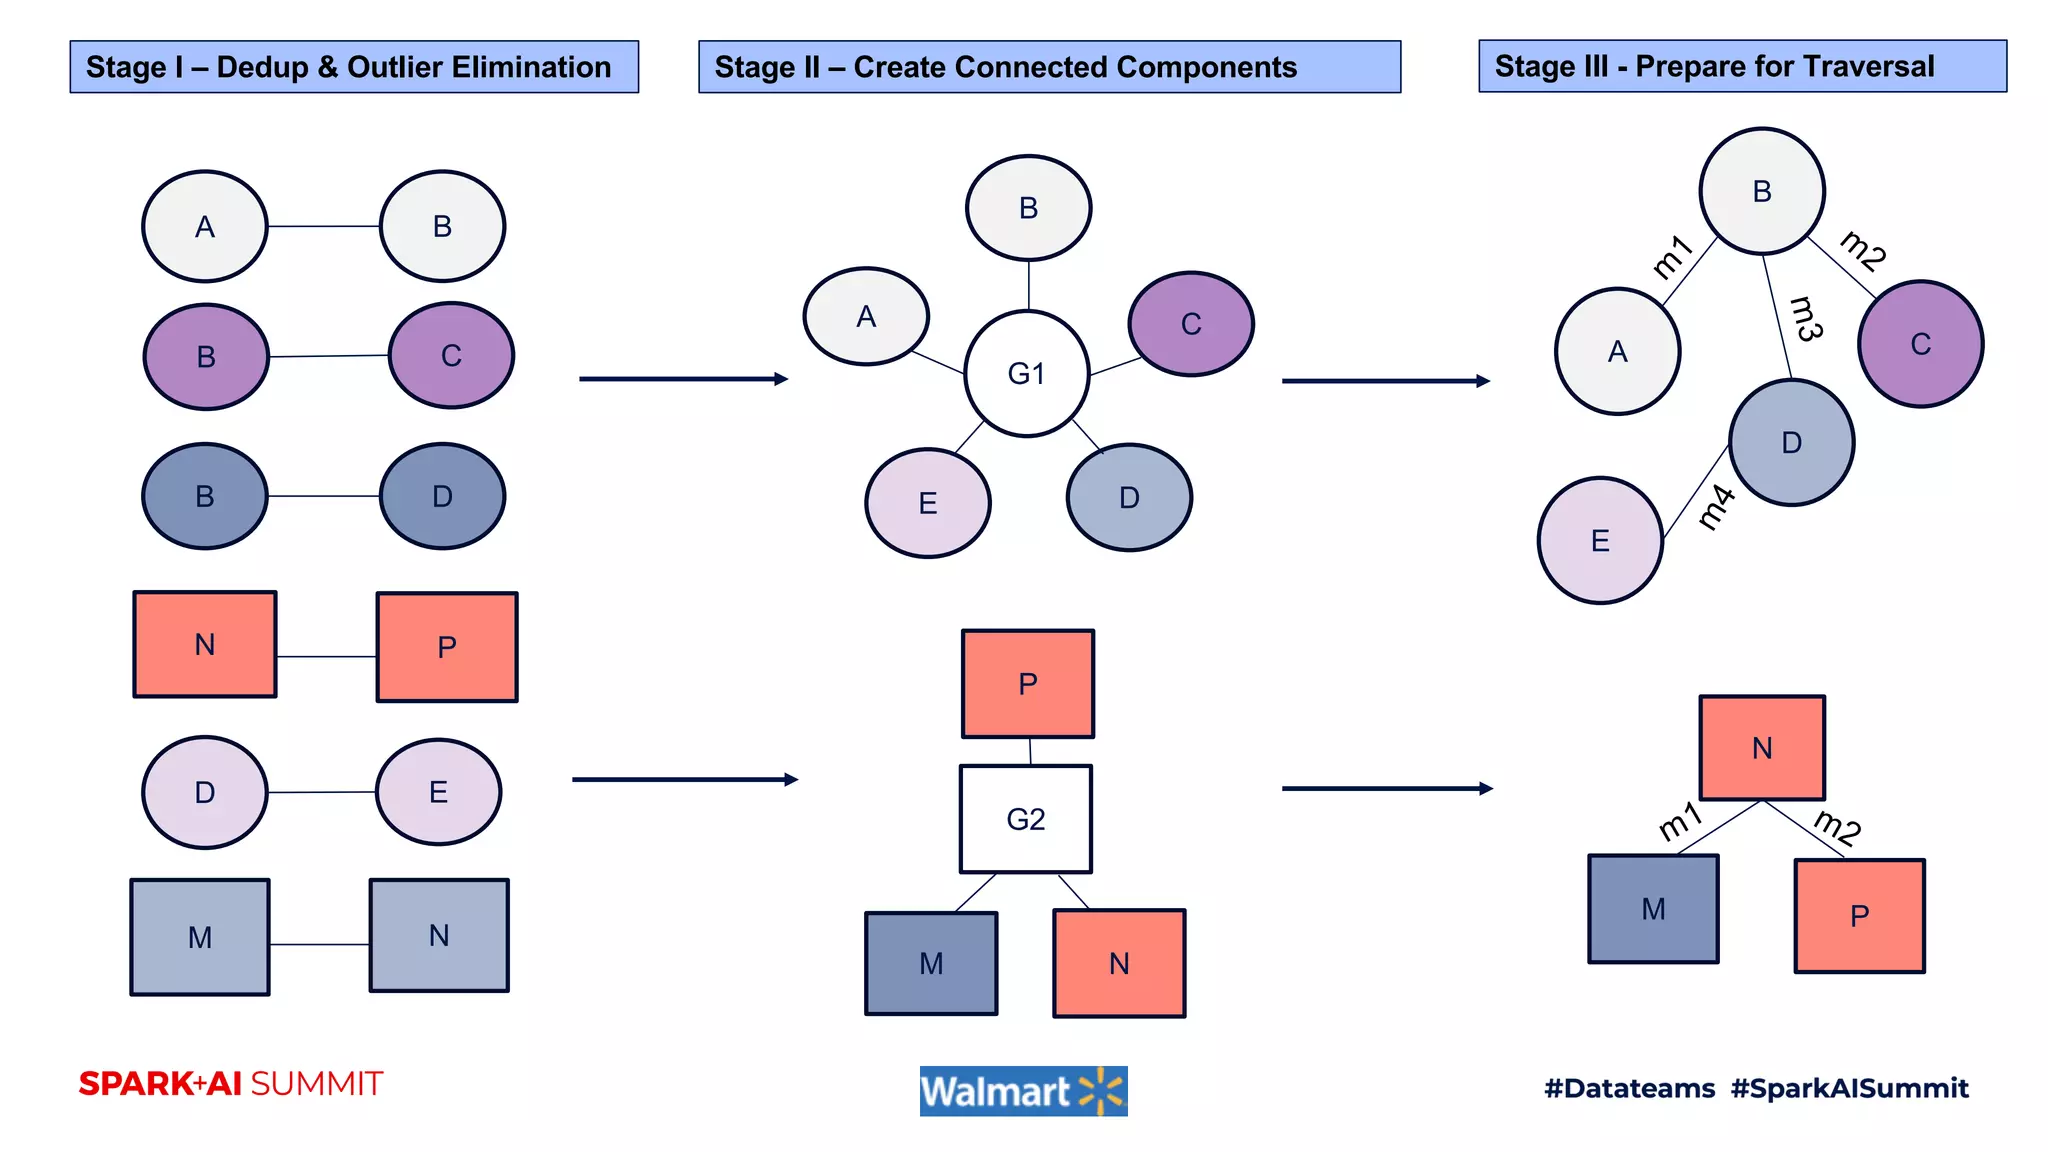
Handling Heterogenous Linkages Stage I Stage II
Stage III - LCC
Stage III - SCC
a b tid1 tid
2
c
a b tid1 tid2 c
15 upstream tables
p q tid6 tid9 r
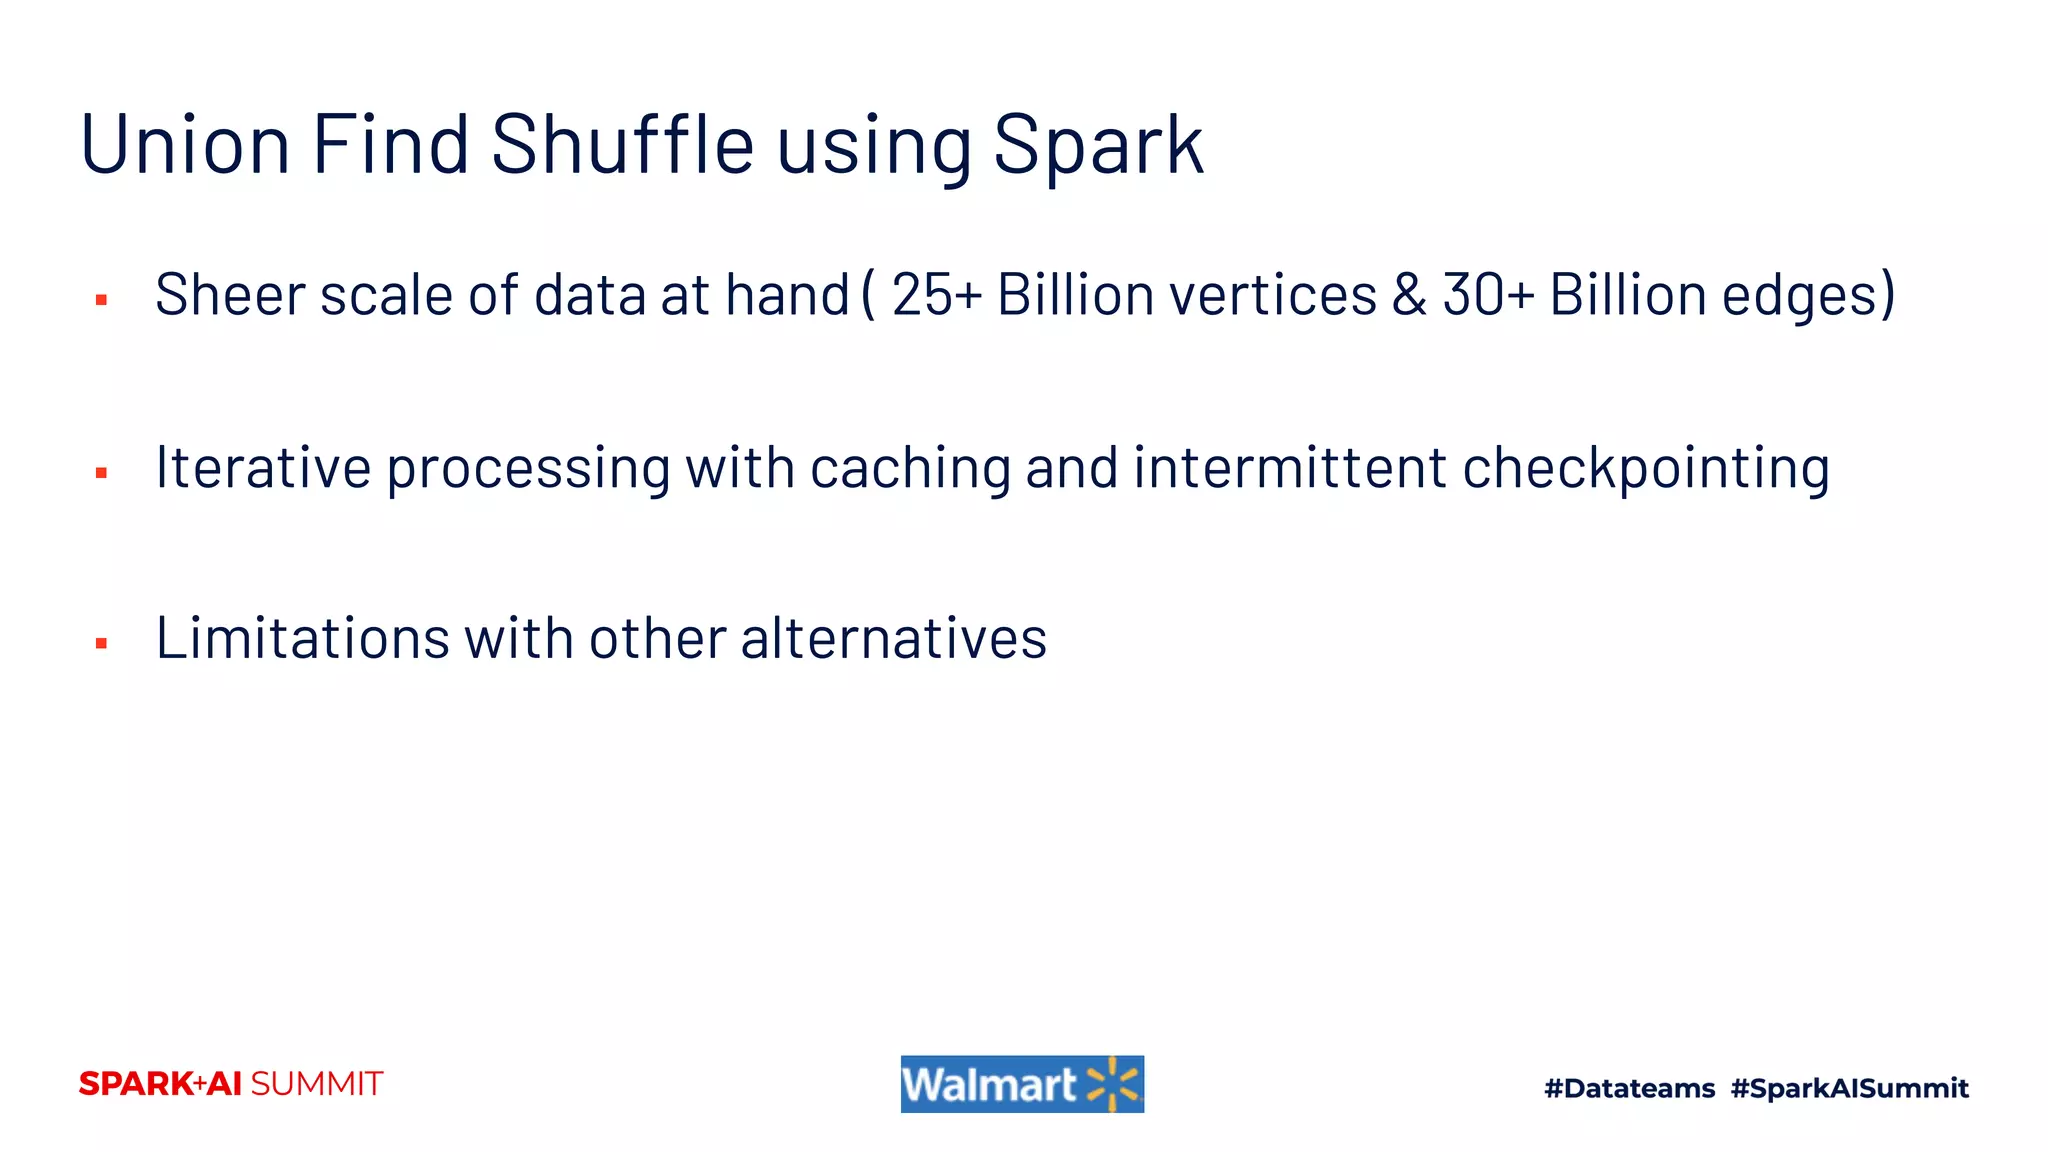
25B+ Raw Linkages &
30B+ Nodes
tid1 tid2 Linkage
metadata
tid1 tid2 Linkage
metadata
tid1_long tid2_long Linkage
metadata
tid6_long tgid120
tid1_long tgid1
tgid Linkages with Metadata
tgid1 {tgid: 1, tid: [aid,bid],
edges:[srcid,
destid,metadata],[] }
1-2
hrs
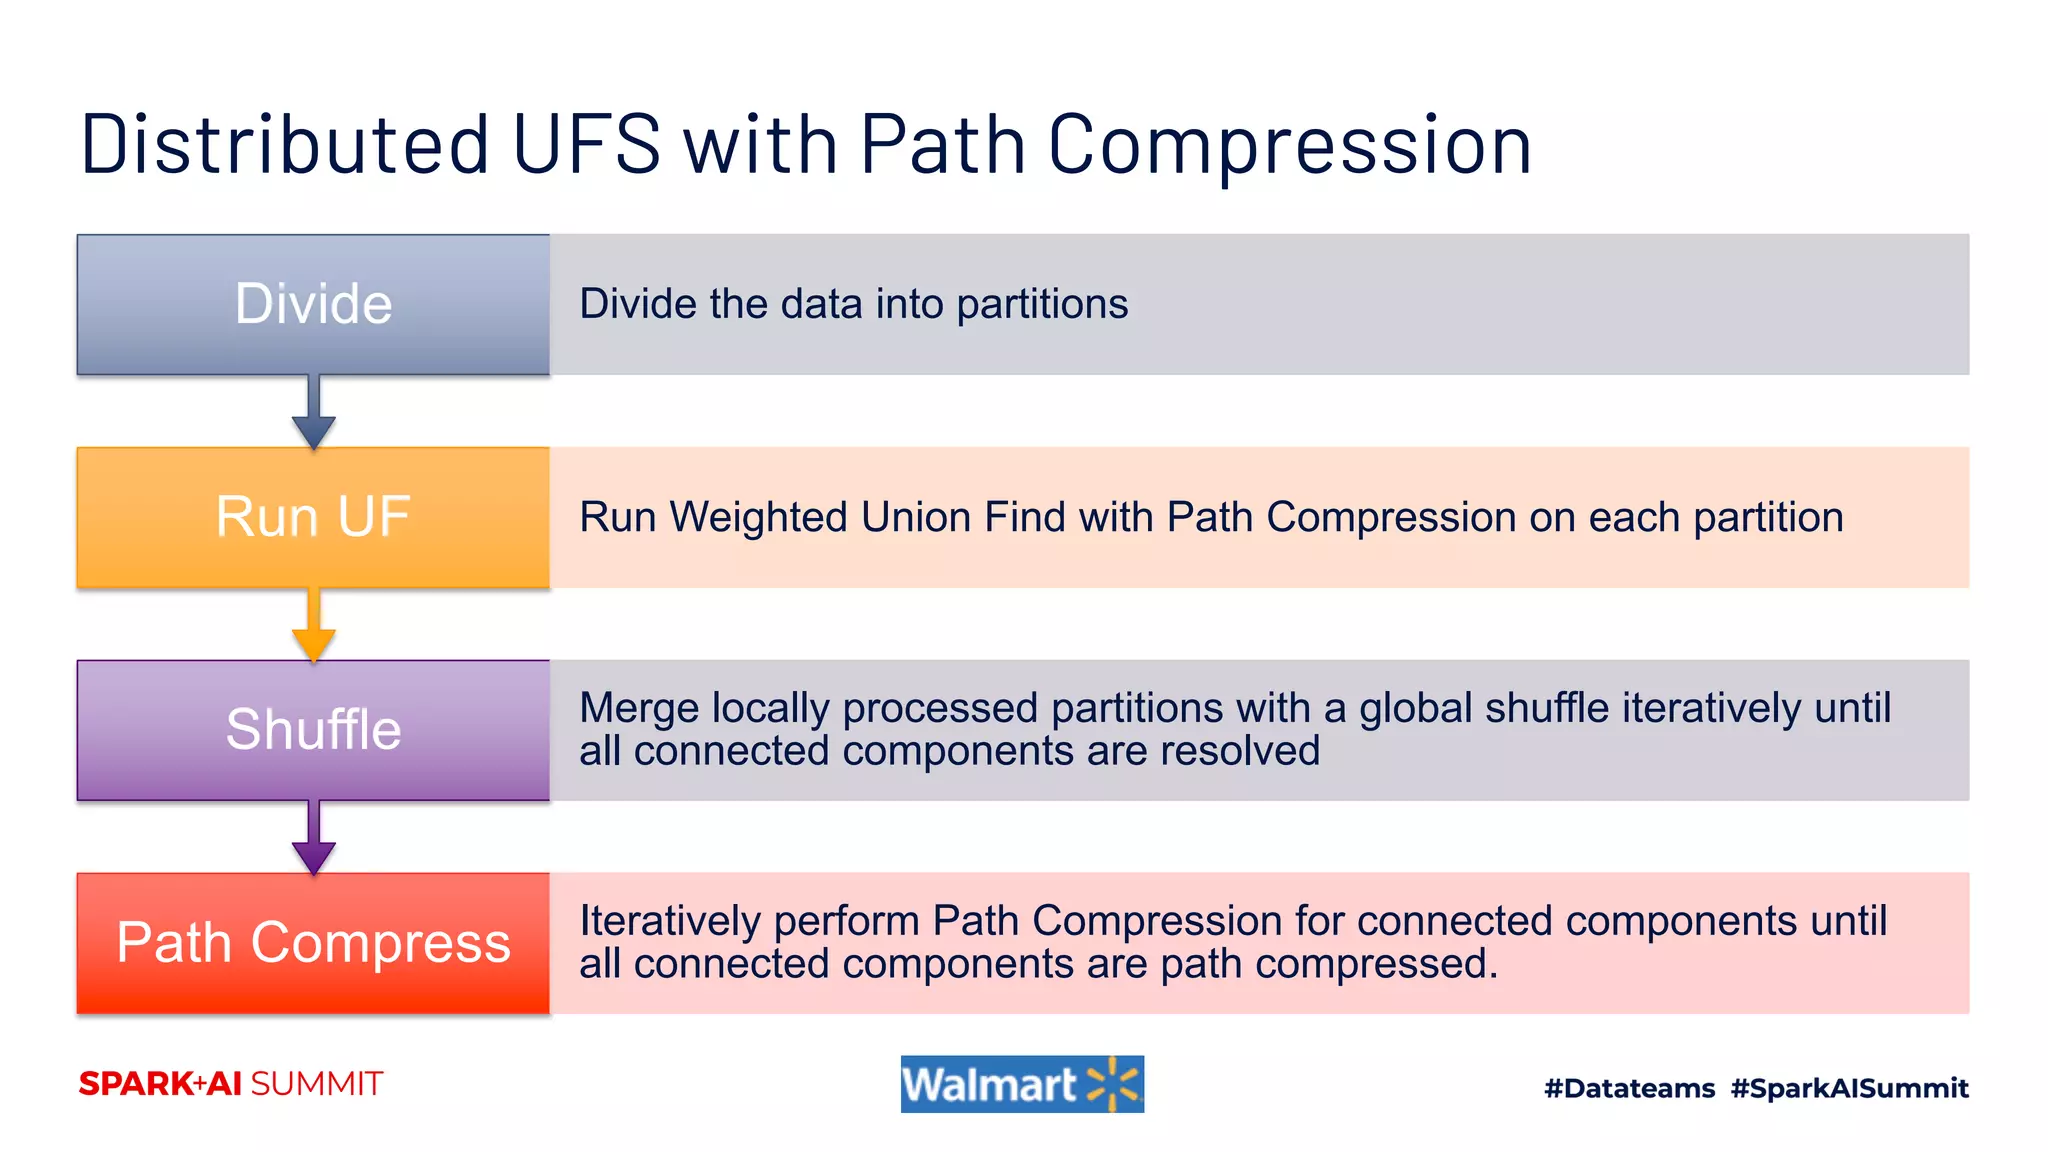
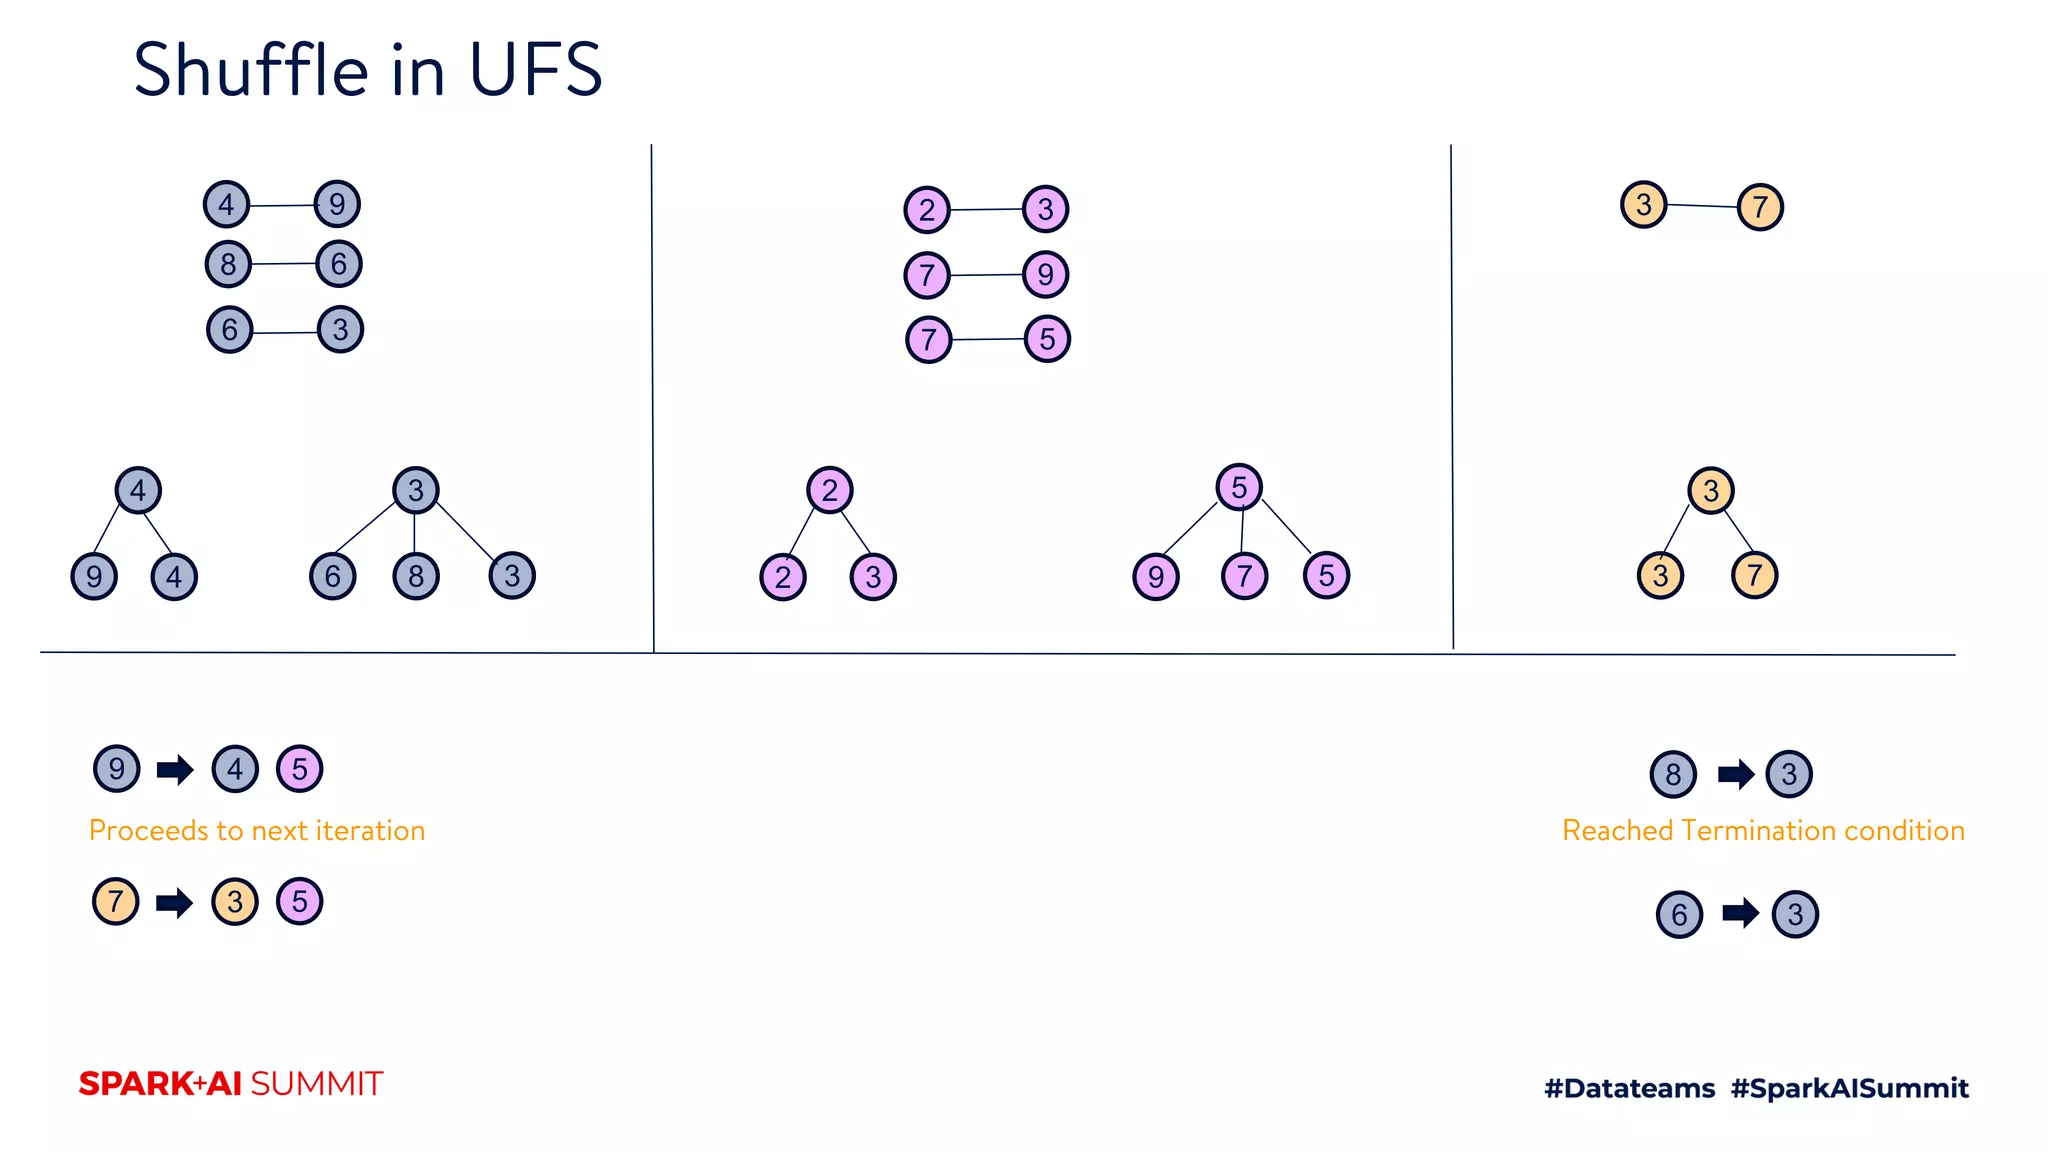
UnionFindShuffle
8-10hrs
1-2
hrs
Subgraphcreation
4-5hrs
tgid tid Linkages
(adj_list)
3 A1 [C1:m1, B1:m2, B2:m3]
2 C1 [A1:m1]
2 A2 B2:m2
3 B1 [A1:m2]
3 B2 [A1:m3]
tid Linkages
A1 [C1:m1, B1:m2]
A2 [B2:m2]
C1 [A1:m1]
B1 [A1:m2]
Give all aid-bid linkages which go via
cid
Traversal request
Give all A– B linkages where
criteria= m1,m2
Traversal request on LCC
Filter tids on
m1,m2
Select
count(*)
by tgid
MR on
filtered
tgid
partitions
Dump
LCC table
> 5k
CC
startnode=A, endnode=B, criteria=m1,m2
tid Linkage
A1 B1
A2 B2
For each tid do
a bfs
(unidirected/bidi
rected)
Map
Map
Map
1 map per tgid
traversal
tid1 tid1_long
tid6 tid6_long
tid6 tgid120
tid1 tgid1
Tableextraction&
transformation30mins
20-30
mins
2.5
hrs
30
mins
20-30
mins](https://image.slidesharecdn.com/129sudhaviswanathansaigopalthota-200707194704/75/Building-Identity-Graphs-over-Heterogeneous-Data-38-2048.jpg)

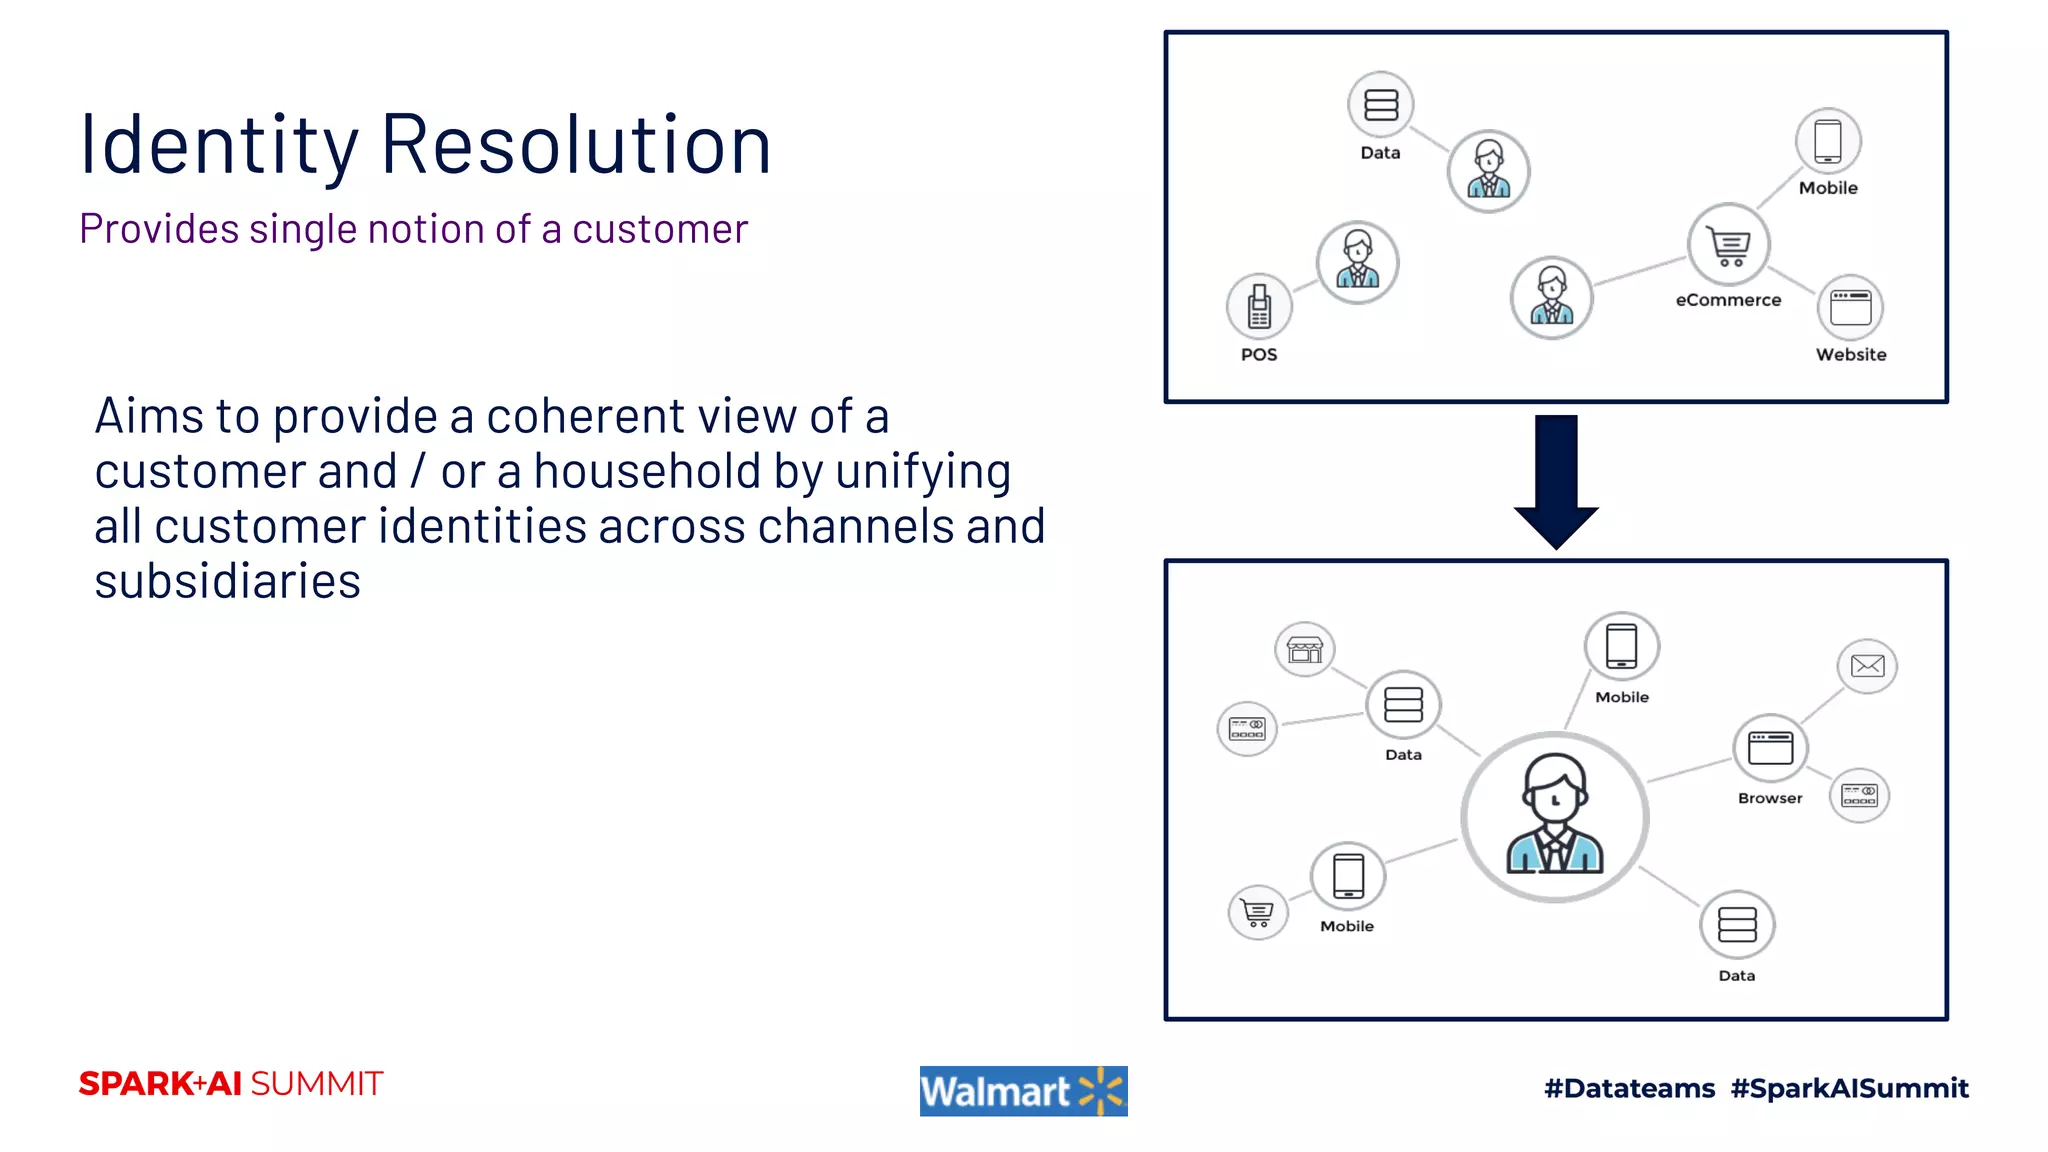
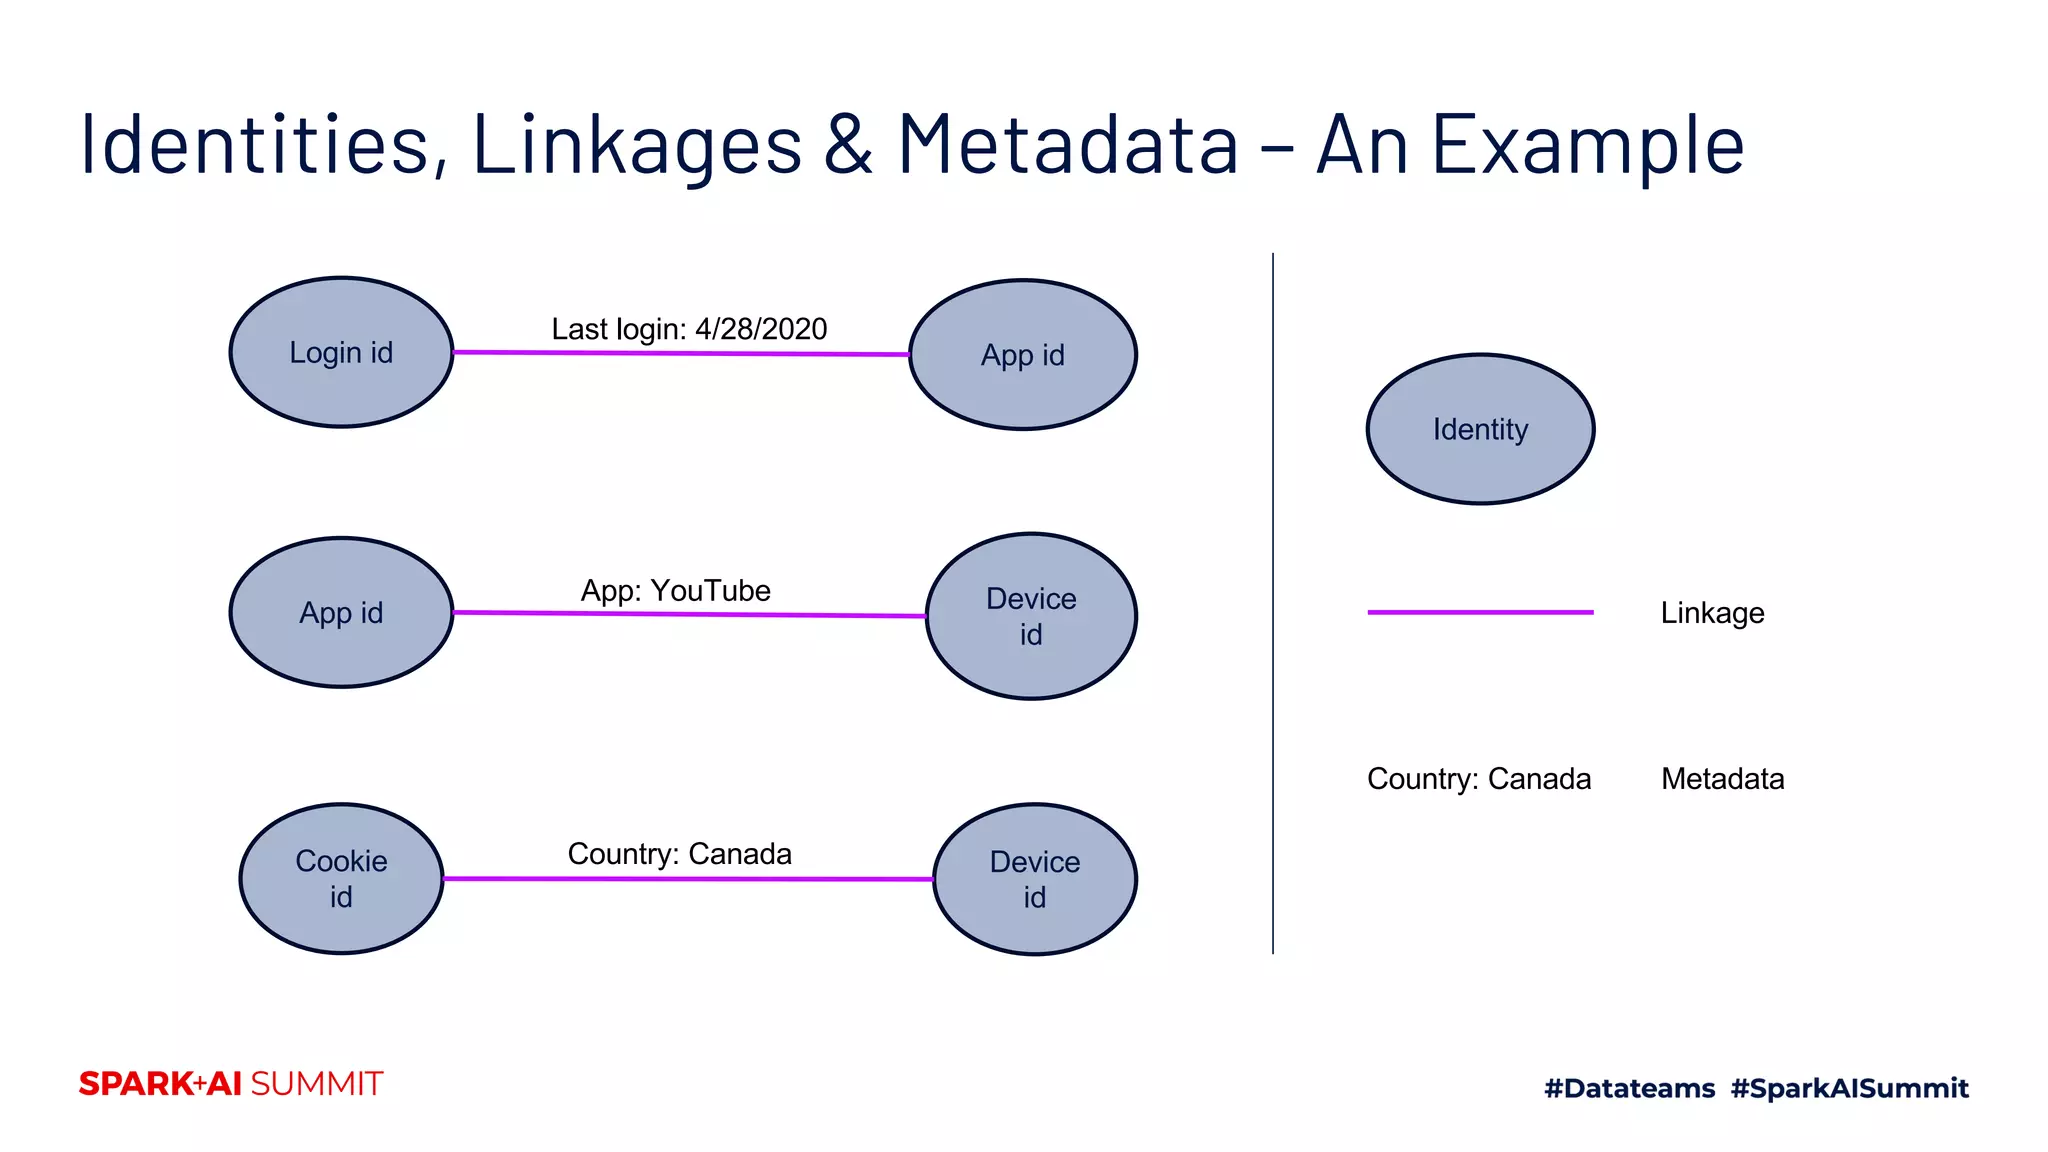
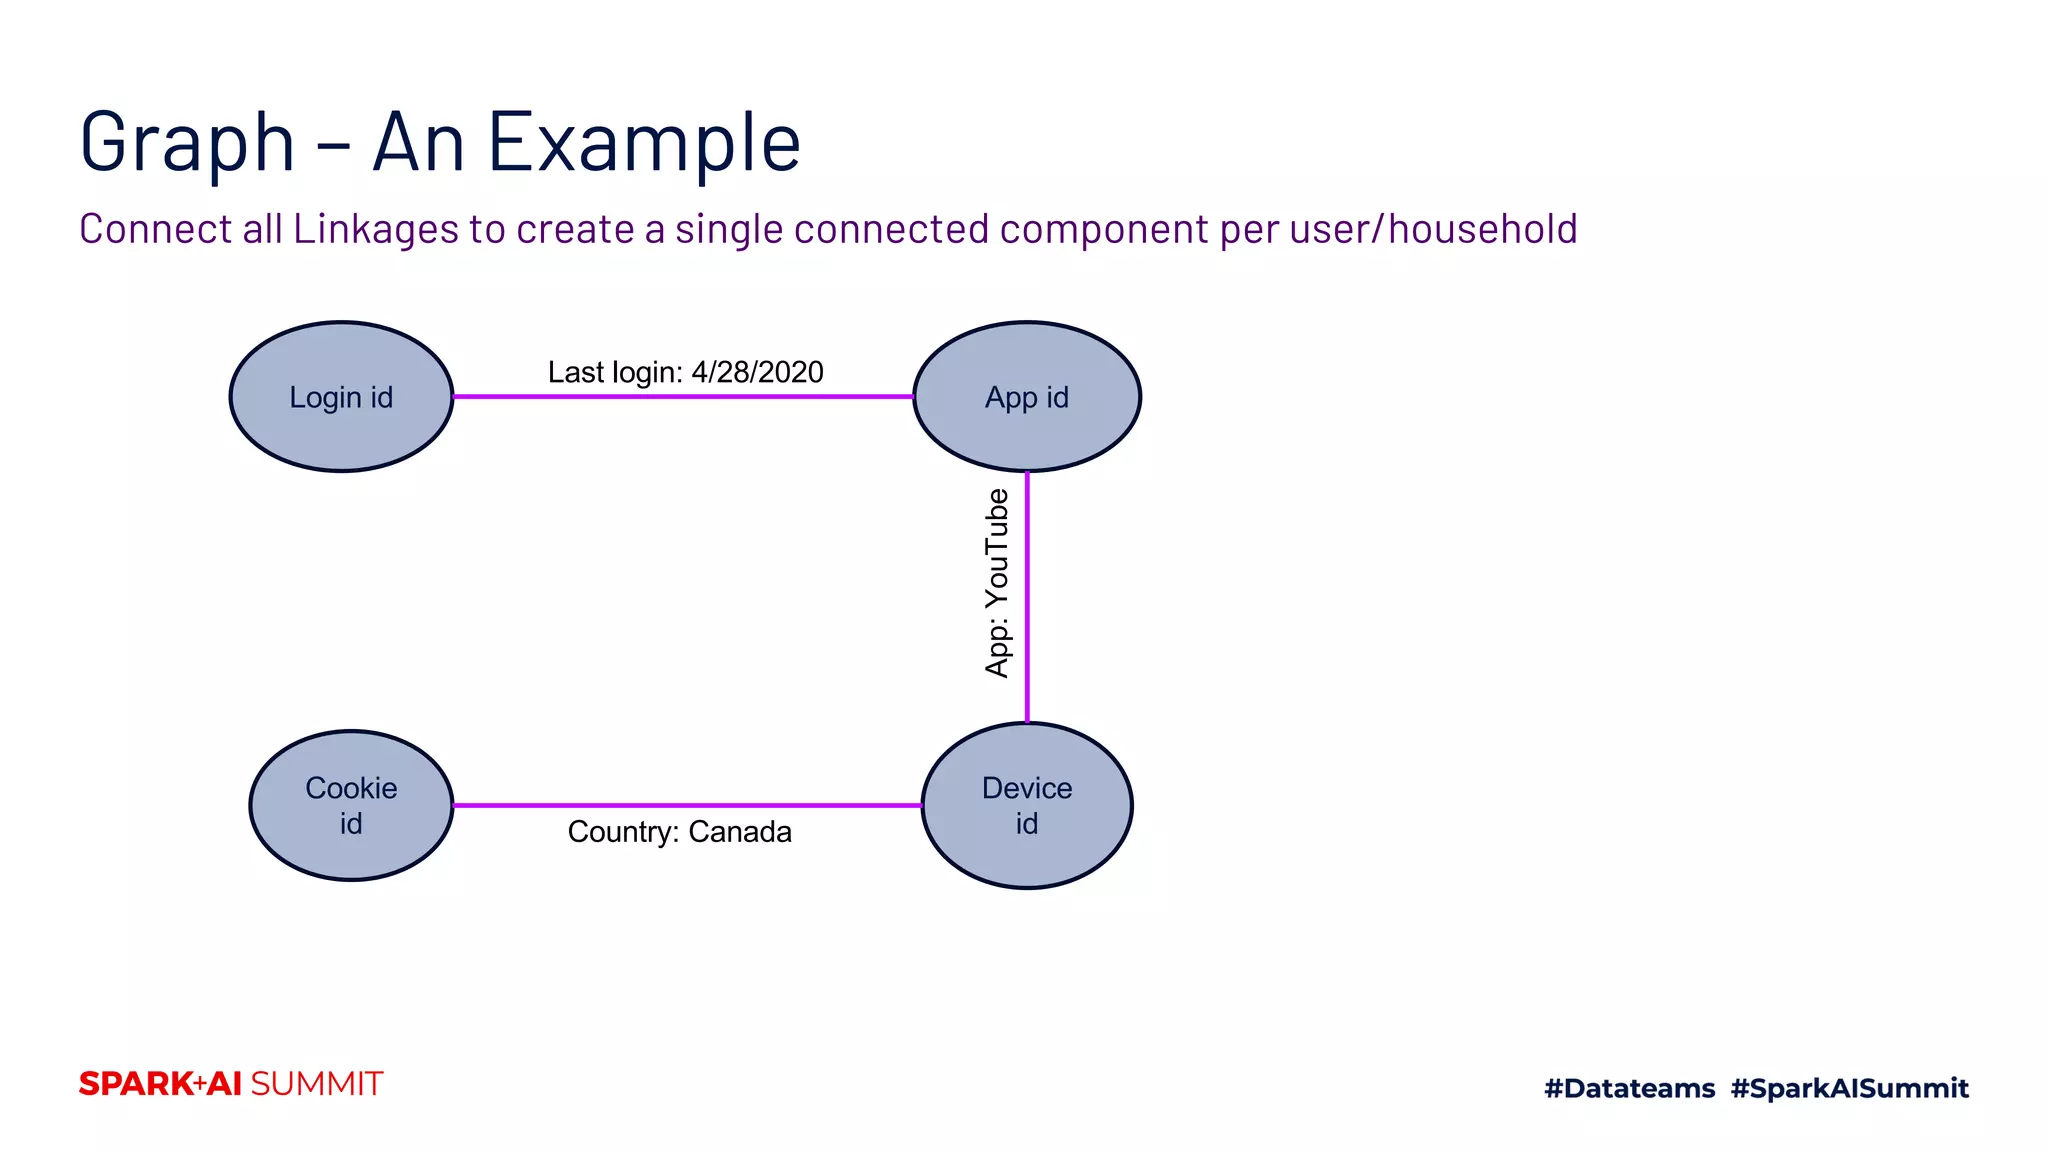
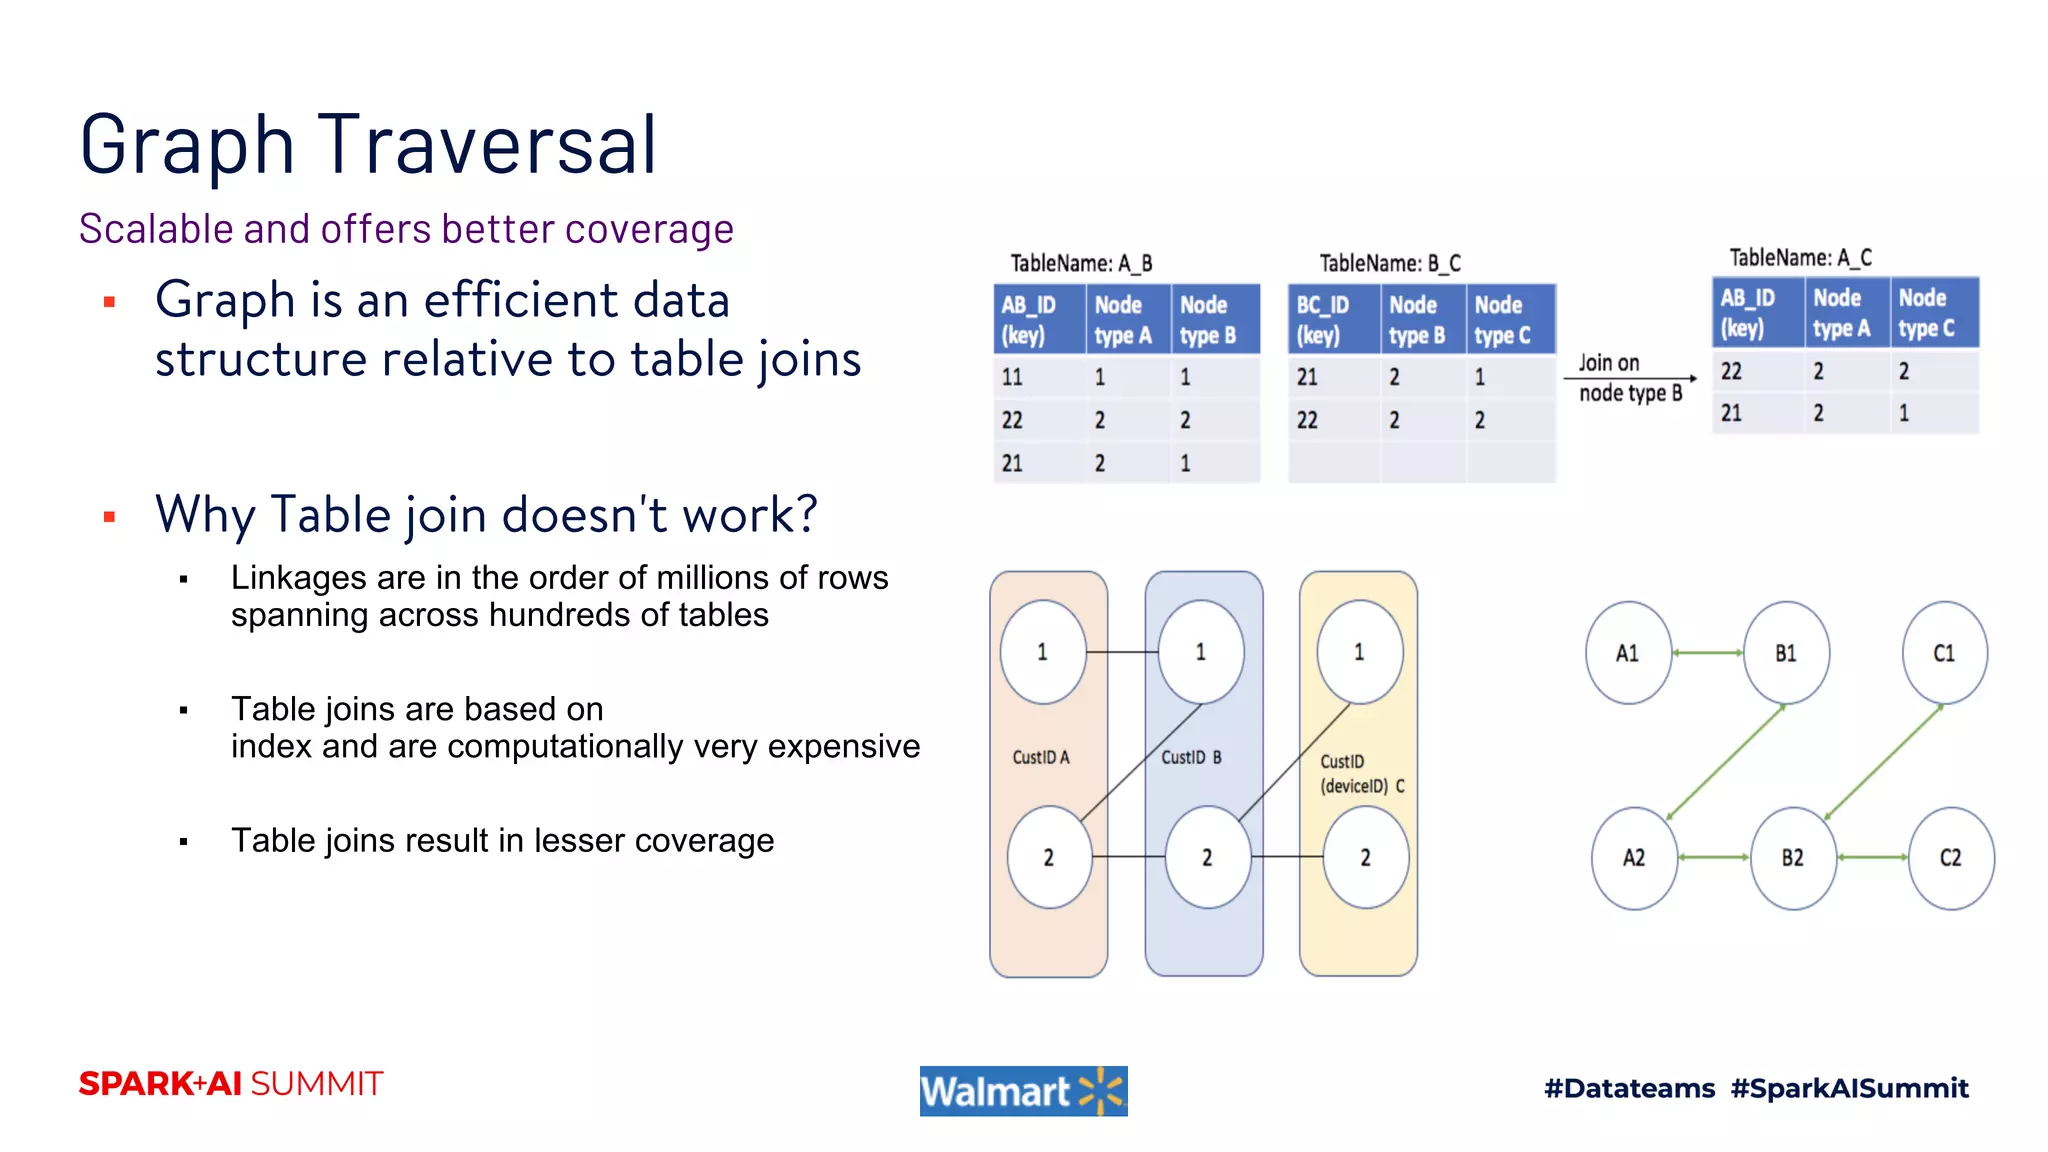
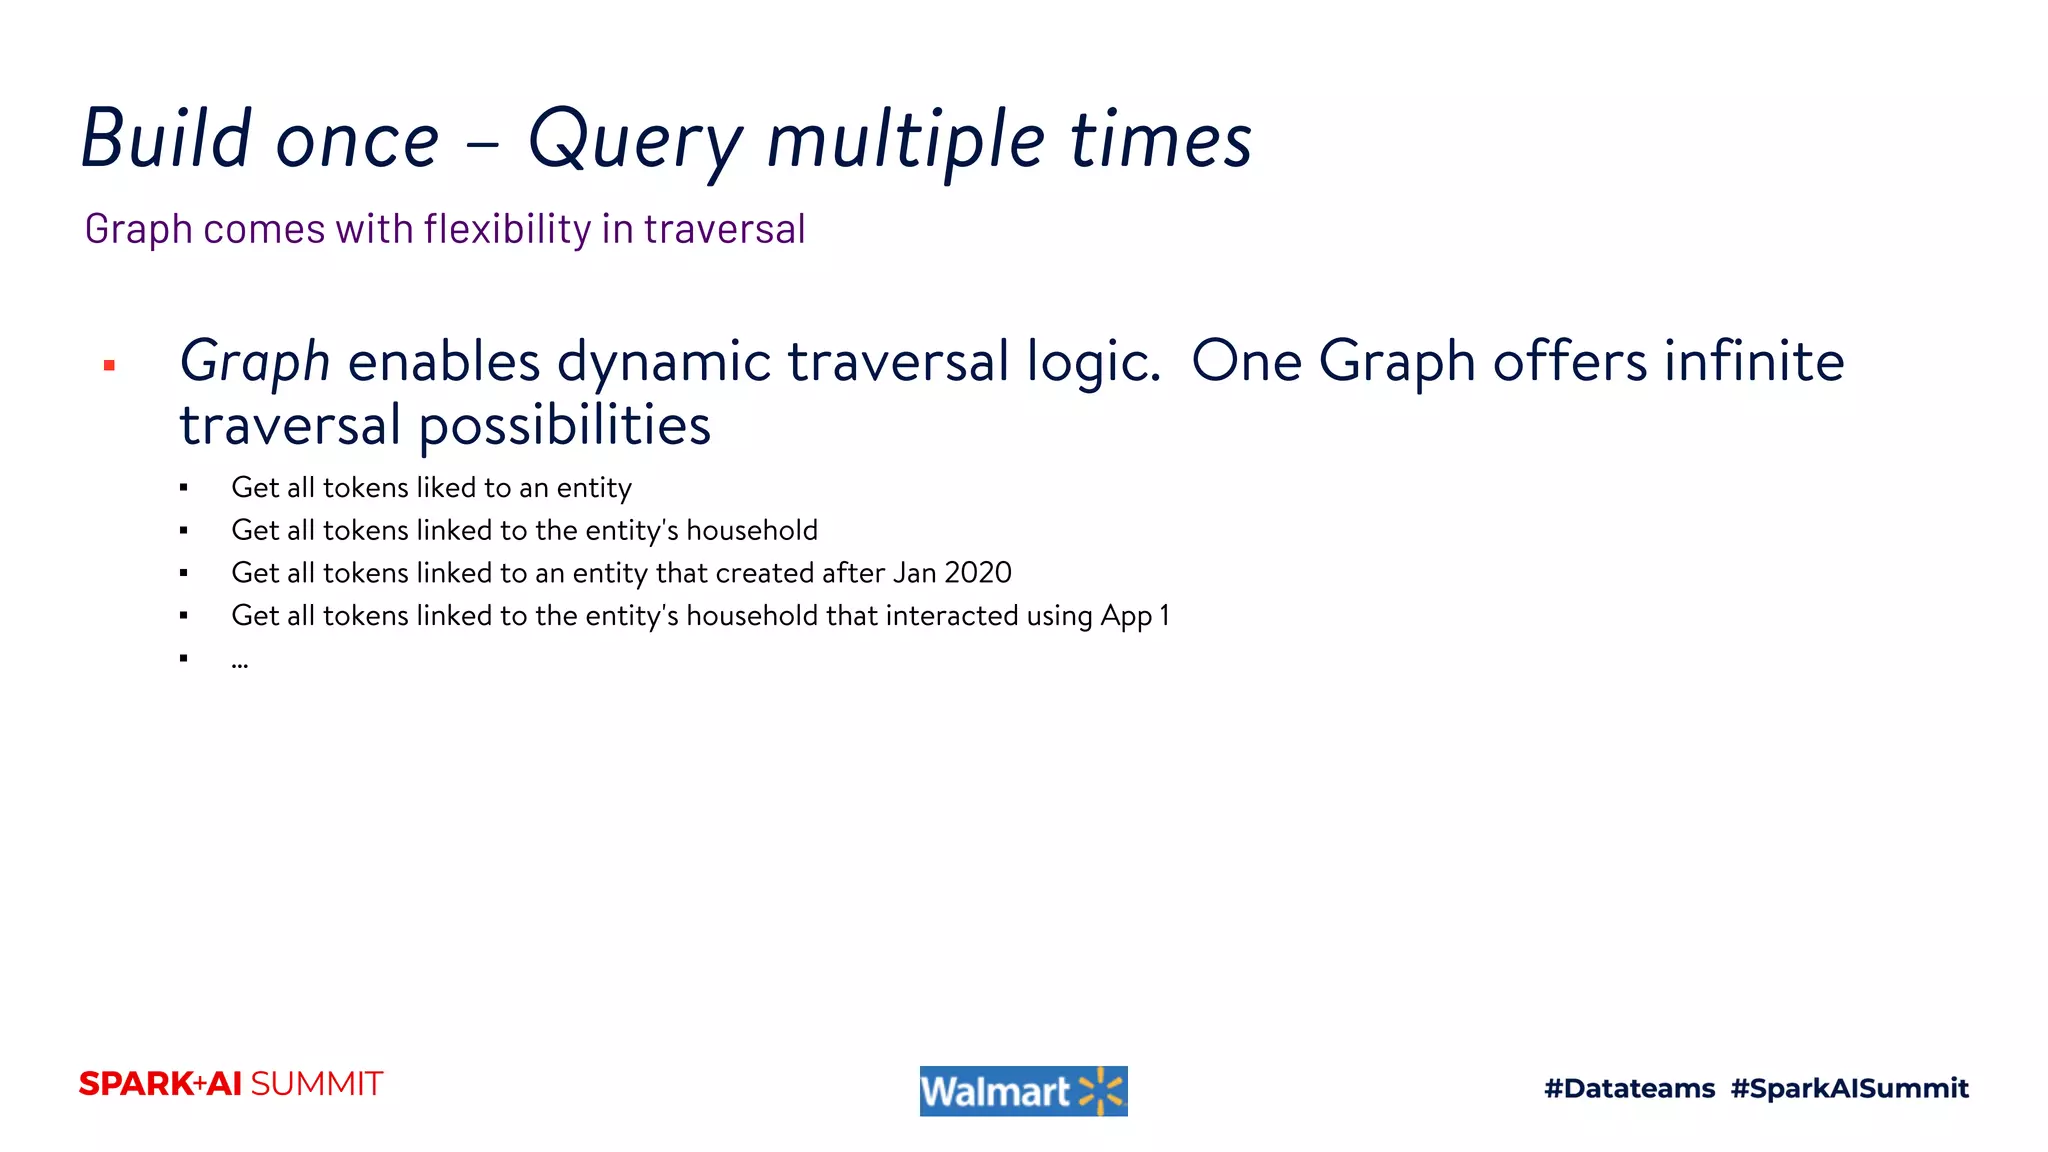
The document discusses the construction and scaling of identity graphs using heterogeneous data to achieve coherent customer identities across multiple channels. It outlines the benefits of using graph structures over traditional table joins, detailing the stages of building and processing identity linkages and the challenges faced, such as data quality issues and the need for real-time updates. Additionally, the paper emphasizes the importance of handling vast amounts of data efficiently while maintaining both precision and coverage in identity resolution.


![[DSC Europe 25] Dusan Jovicic - AI Story: From on-prem to cloud and back agai...](https://cdn.slidesharecdn.com/ss_thumbnails/8kp49m6uq22ifnbwhfnk-2-251205085715-964d11a6-thumbnail.jpg?width=640&height=640&fit=bounds)


![[DSC Europe 25] Nikola Rajovic - Hardware Technologies Under the Hood: RISC-V...](https://cdn.slidesharecdn.com/ss_thumbnails/o2gptrmtoyqndgoshwgq-dsc2025-tenstorrent-rajovic-251205090438-814685f5-thumbnail.jpg?width=640&height=640&fit=bounds)
![[DSC Europe 25] Jim Sterne - Adopting Generative AI Capabilities Into the Ent...](https://cdn.slidesharecdn.com/ss_thumbnails/sxhpofuorcagxsaulkmt-3-251204082258-7e66bc48-thumbnail.jpg?width=640&height=640&fit=bounds)


![[DSC Europe 25] Goran Obradovic - The Rise of Sovereign AI: Building the Regi...](https://cdn.slidesharecdn.com/ss_thumbnails/7nw2xxixrxqdxvrb5wca-6-251205085714-ab09a2ac-thumbnail.jpg?width=640&height=640&fit=bounds)
![[DSC Europe 25] Petar Zivanov - AI meets documents From chatbots to AI-powere...](https://cdn.slidesharecdn.com/ss_thumbnails/xer2bb6nrdc8pdpev0pc-8-251204082258-7c2fa4a1-thumbnail.jpg?width=640&height=640&fit=bounds)


![[DSC Europe 25] Max Talanov - Non digital NNs.pptx](https://cdn.slidesharecdn.com/ss_thumbnails/wif8tr3gtua74qvtopke-non-digital-nns-251205090438-26b0eea6-thumbnail.jpg?width=640&height=640&fit=bounds)
![[DSC Europe 25] Bogdan Daniel Maruneac - AI - It starts with you.pptx](https://cdn.slidesharecdn.com/ss_thumbnails/odov3snhrcqs9hx5ny2n-4-251205085715-f1daacfe-thumbnail.jpg?width=640&height=640&fit=bounds)


