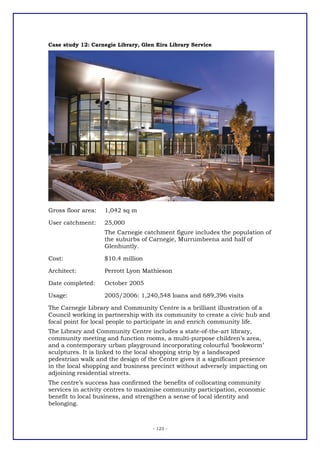
Downloaded 12 times
![BUILDING AUDIT OF
VICTORIAN PUBLIC LIBRARIES
An independent report for the
State Library of Victoria and Victorian public library network
By
BBC Consulting Planners
May 2008
55 MOUNTAIN STREET BROADWAY NSW ~ PO BOX 438 BROADWAY NSW 2007
TELEPHONE [02] 9211 4099 ~ FAX [02] 9211 2740
EMAIL bbc@bbcplanners.com.au ~ WEBSITE www.bbcplanners.com.au
ABN 061 868 942
-1-](https://image.slidesharecdn.com/buildingauditforvictorianpubliclibraries-130214000239-phpapp02/85/Building-Audit-Victorian-Public-Libraries-1-320.jpg)

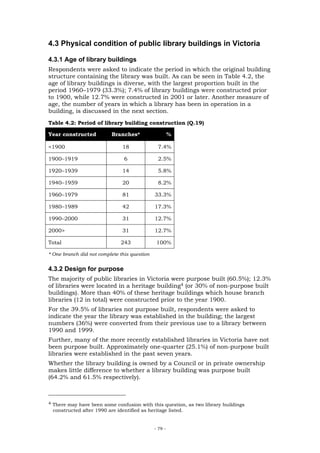
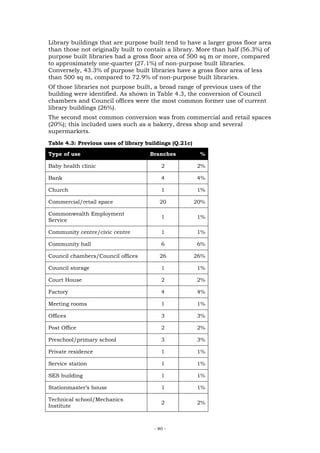
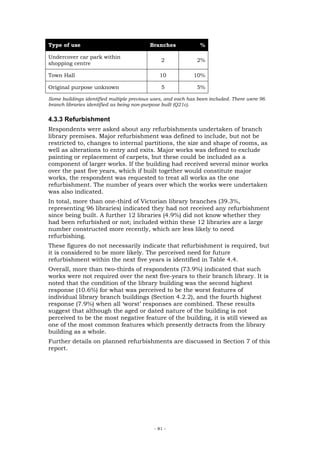
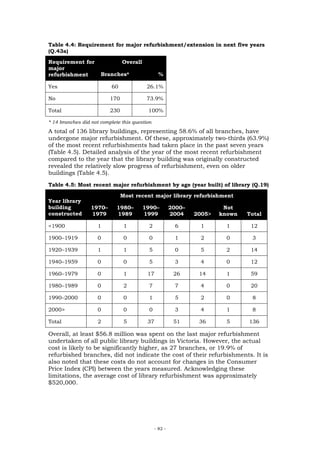


This document provides an independent audit of Victorian public library buildings commissioned by the State Library of Victoria. It finds that many library buildings are aging and may not be well equipped to meet future community needs. The audit assessed building condition, functionality, and compliance with accessibility standards through a survey of local government authorities. It recommends strategies to help ensure library buildings are fit for purpose, including establishing space and quality benchmarks, providing capacity building support, and encouraging the development of library-community hubs.


