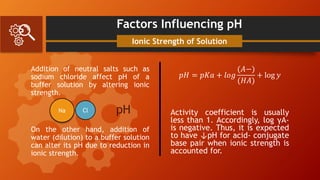
The document discusses buffer systems and isotonic solutions in physical pharmacy, covering key topics such as buffer equations, factors influencing pH, and the role of buffers in pharmaceutical and biological systems. It explains buffer capacity, the impact of pH on drug solubility and therapeutic activity, and the importance of maintaining isotonic conditions for applications involving delicate body membranes. Various methods for measuring tonicity and adjusting solutions to achieve isotonicity are also described.


![Buffer Equation
Problem Solving
A mixture of 0.20 M acetic acid
and 0.30 M sodium acetate is
given. Calculate the pH of the
medium if the pKa of the acetic
is 4.76.
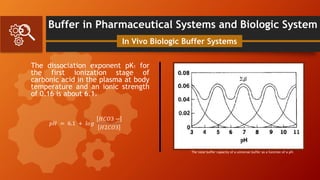
𝑝𝐻 = 𝑝𝐾𝑎 + 𝑙𝑜𝑔
[𝑃𝑟𝑜𝑡𝑜𝑛 𝐴𝑐𝑐𝑒𝑝𝑡𝑜𝑟]
[𝑃𝑟𝑜𝑡𝑜𝑛 𝐷𝑜𝑛𝑜𝑟]
𝑝𝐻 = 4.76 + log
0.30
0.20
𝑝𝐻 = 4.76 + log 1.5
𝑝𝐻 = 4.76 + 0.18
4.94 = 4.76 + 0.18
Problem Solving
Answer: The pH of the given
solution is 4.94](https://image.slidesharecdn.com/group4presentation-210517015016/85/Buffer-System-and-Isotonic-Solutions-5-320.jpg)

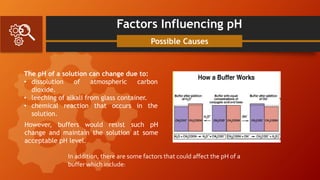


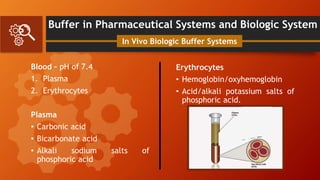
![Buffer in Pharmaceutical Systems and Biologic System
At a pH of 7.4, the ratio of bicarbonate
to carbonic acid (Represents CO2) in
normal blood plasma is
log [HCO3-]/[H2CO3]= 7.4 - 6.1 = 1.3
In Vivo Biologic Buffer Systems
[HCO3-]/[H2CO3] = 20/1
or
Actual Concentration:
0.025 M and 0.00125 M, respectively.
Buffer Capacity of Blood: pH 7.0 to 7.8
Peters and Van Slyke
• Hemoglobin and other constituents = 0.028 g
• Bicarbonate = 0.003 g
Salenius
• Blood = 0.0318 ± 0.0035 g
Ellison et al.
• 0.039 (0.031 cells + 0.008 plasma)
Important Note: It is usually life-threatening
for the pH of the blood to go below 6.9 or
above 7.8. The pH of the blood in diabetic
coma is as low as about 6.8.](https://image.slidesharecdn.com/group4presentation-210517015016/85/Buffer-System-and-Isotonic-Solutions-16-320.jpg)


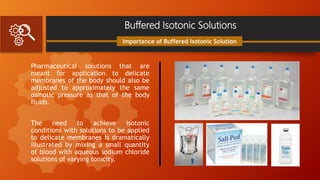


![Measurement of Tonicity
Class II Method
White Vincent Method
involve the addition of water to the drugs
to make an isotonic solution, followed by
the addition of an isotonic or isotonic-
buffered.
Diluting vehicle to bring the solution to the
final volume.
V = w × E × 111.1
Methods of Adjusting Tonicity and pH
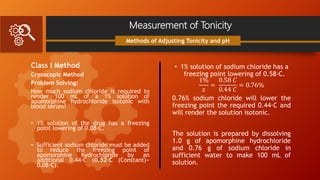
Problem Solving:
Make the following solution isotonic with
respect to an ideal membrane:
Phenacaine Hydrochloride 0.06 g
Boric Acid 0.30 g
Sterilized Distilled Water, enough to make 100 mL.
Based again on the table:
V = [(0.06×0.20)+(0.3×0.50)]×111.1
V = 18mL
The drugs are mixed with water to make 18 mL of
an isotonic solution, and the preparation is
brought to a volume of 100 mL by adding an
isotonic diluting solution.](https://image.slidesharecdn.com/group4presentation-210517015016/85/Buffer-System-and-Isotonic-Solutions-36-320.jpg)


![CTEV [ clubfoot] DR ARUN LAL ,DR MOHAMED ASHRAF travancore medical college k...](https://cdn.slidesharecdn.com/ss_thumbnails/ctevclubfootdrarunlaldrmohamedashraftravancoremedicalcollegekollamkeralaindia-260208063247-18fc466c-thumbnail.jpg?width=640&height=640&fit=bounds)


