Download to read offline


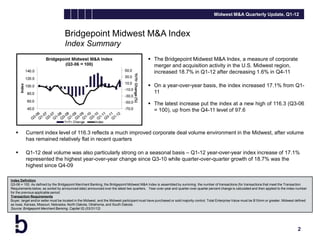
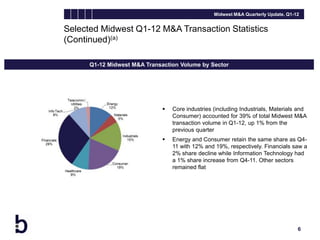
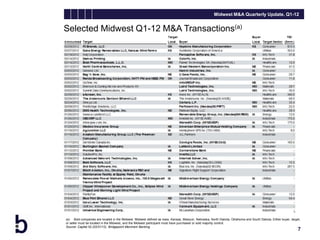


The Bridgepoint Midwest M&A Index, which measures merger and acquisition activity in the Midwest US region, increased 18.7% in the first quarter of 2012 after decreasing in the previous quarter, putting it at a new high. The increase reflected improved deal volume in the Midwest and stronger year-over-year growth compared to recent years. Selected transaction statistics showed higher deal volumes but lower median deal sizes compared to the previous quarter. Core industries accounted for most deal activity while valuations declined on one measure but increased on another.


