Brayano
•Download as DOCX, PDF•
0 likes•89 views

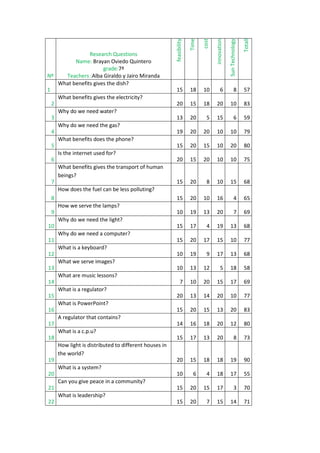
The document contains a student's research questions and teacher feedback. The student posed 40 research questions on various topics like technology, utilities, transportation, education, society and more. The teachers provided feedback on each question by assigning a score out of 20. The feedback is presented in a bar graph showing the distribution of scores.

More Related Content
Viewers also liked
Viewers also liked (13)
Similar to Brayano
Similar to Brayano (17)
More from IETI SD
More from IETI SD (20)
Recently uploaded
Recently uploaded (20)
Brayano
- 1. Totall innovation feasibility Time cost Sun Technology Research Questions Name: Brayan Oviedo Quintero grade:7ª Nº Teachers :Alba Giraldo y Jairo Miranda What benefits gives the dish? 1 15 18 10 6 8 57 What benefits gives the electricity? 2 20 15 18 20 10 83 Why do we need water? 3 13 20 5 15 6 59 Why do we need the gas? 4 19 20 20 10 10 79 What benefits does the phone? 5 15 20 15 10 20 80 Is the internet used for? 6 20 15 20 10 10 75 What benefits gives the transport of human beings? 7 15 20 8 10 15 68 How does the fuel can be less polluting? 8 15 20 10 16 4 65 How we serve the lamps? 9 10 19 13 20 7 69 Why do we need the light? 10 15 17 4 19 13 68 Why do we need a computer? 11 15 20 17 15 10 77 What is a keyboard? 12 10 19 9 17 13 68 What we serve images? 13 10 13 12 5 18 58 What are music lessons? 14 7 10 20 15 17 69 What is a regulator? 15 20 13 14 20 10 77 What is PowerPoint? 16 15 20 15 13 20 83 A regulator that contains? 17 14 16 18 20 12 80 What is a c.p.u? 18 15 17 13 20 8 73 How light is distributed to different houses in the world? 19 20 15 18 18 19 90 What is a system? 20 10 6 4 18 17 55 Can you give peace in a community? 21 15 20 15 17 3 70 What is leadership? 22 15 20 7 15 14 71
- 2. What is a bad person? 23 10 12 2 15 16 55 How to interpret the love? 24 20 15 16 19 6 76 What is humanity? 25 12 8 6 7 15 48 How can you be nice? 26 4 14 16 18 20 72 What is respect? 27 15 13 20 4 5 57 What is service? 28 13 20 8 16 9 66 What is tolerance? 29 20 15 4 8 13 60 What is grid? 30 15 14 20 3 12 64 What good is a robot? 31 20 18 4 15 13 70 What is a cell? 32 14 19 13 5 8 59 Who invented the automobile? 33 16 20 17 9 4 66 How does the radio? 34 19 20 3 14 17 73 How many volts has a lightbulb? 35 20 15 18 13 4 70 What is television? 36 18 13 15 20 4 70 What improved the computer industry? 37 16 19 20 5 18 78 How can we learn? 38 20 14 19 17 6 76 Who discovered the saw? 39 15 19 15 20 20 89 What is an airplane? 40 16 17 20 13 7 73
- 3. 38 39 40 1 2 3 37 3% 3% 2% 3% 4 34 3% 2% 5 36 3% 3% 6 7 3% 35 3% 3% 2% 3% 3% 33 8 32 2% 2% 9 2% 2% 31 10 3% 30 11 2% 2% 3% 29 12 2% 2% 28 13 2% 27 14 2% 2% 26 15 2% 3% 25 16 3% 2% 24 17 3% 3% 23 18 22 21 3% 2% 3% 3% 3% 20 2% 19 3%
- 4. How light is distributed to the different houses of Marinilla? 100 90 80 70 60 50 40 30 20 10 0 1 3 5 7 9 11 13 15 17 19 21 23 25 27 29 31 33 35 37 39