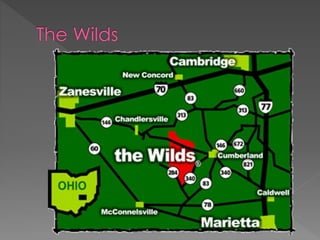
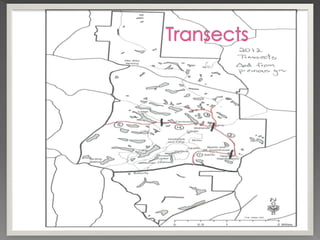
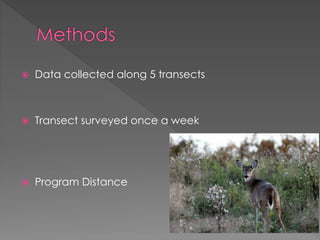
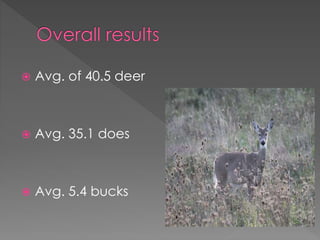
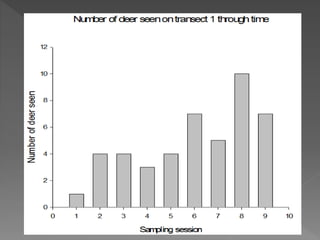
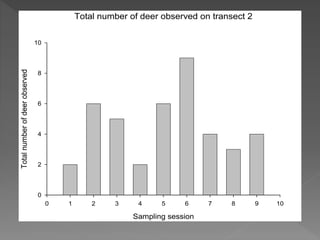
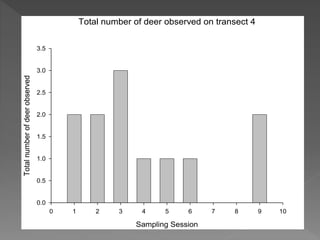
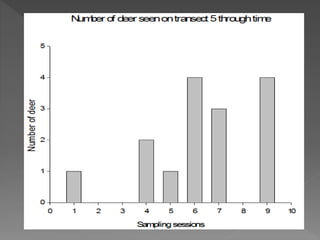
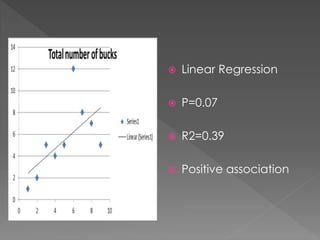
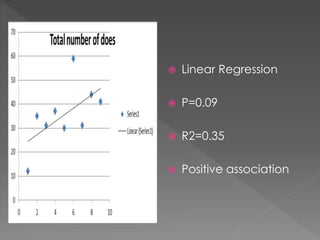
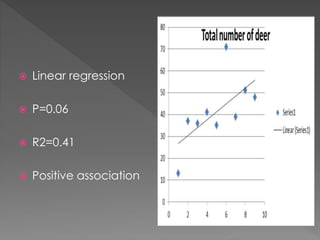
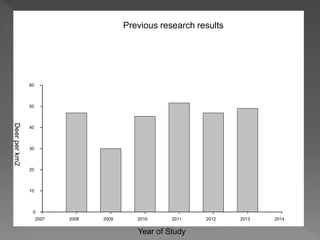
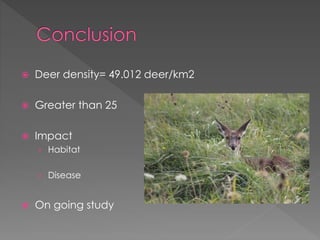
 2008
 Habitat
 Absence of predators
 Hunting regulations
 Protected areas
 Habitat
› Anderson 1997;
› Fowler et. al., 2007
 Agriculture
› Rooney et al., 2010
 Songbirds and small mammals
› Ballard et. al., 2003; McShea & Rappole 1999
› Bynam 2011
 Disease
› Bolzoni et. al., 2012; Duffy et. al., 2002
 Determine if deer population is above ~
25 individuals per square kilometer
 Determine if areas at the Wilds have
higher densities than other areas
 Determine if there are more bucks than
does or vice versa, or if both sexes are
represented equally
 Data collected along 5 transects
 Transect surveyed once a week
 Program Distance
 Avg. of 40.5 deer
 Avg. 35.1 does
 Avg. 5.4 bucks
Total number of deer observed on transect 2
Sampling session
0 1 2 3 4 5 6 7 8 9 10
Totalnumberofdeerobserved
0
2
4
6
8
10
Total number of deer observed on transect 4
Sampling Session
0 1 2 3 4 5 6 7 8 9 10
Totalnumberofdeerobserved
0.0
0.5
1.0
1.5
2.0
2.5
3.0
3.5
 Linear Regression
 P=0.07
 R2=0.39
 Positive association
 Linear Regression
 P=0.09
 R2=0.35
 Positive association
 Linear regression
 P=0.06
 R2=0.41
 Positive association
Year of Study
2007 2008 2009 2010 2011 2012 2013 2014
Deerperkm2
0
10
20
30
40
50
60
Previous research results
 Deer density= 49.012 deer/km2
 Greater than 25
 Impact
› Habitat
› Disease
 On going study
 Dr. Danny Ingold
 Dr. Jim Dooley
 Dan Beetem
 The Wilds
 Josh Goedel
Bradford power point

Bradford power point

  • 2.
  • 3.
     Habitat  Absenceof predators  Hunting regulations  Protected areas
  • 4.
     Habitat › Anderson1997; › Fowler et. al., 2007  Agriculture › Rooney et al., 2010  Songbirds and small mammals › Ballard et. al., 2003; McShea & Rappole 1999 › Bynam 2011  Disease › Bolzoni et. al., 2012; Duffy et. al., 2002
  • 5.
     Determine ifdeer population is above ~ 25 individuals per square kilometer  Determine if areas at the Wilds have higher densities than other areas  Determine if there are more bucks than does or vice versa, or if both sexes are represented equally
  • 8.
     Data collectedalong 5 transects  Transect surveyed once a week  Program Distance
  • 10.
     Avg. of40.5 deer  Avg. 35.1 does  Avg. 5.4 bucks
  • 12.
    Total number ofdeer observed on transect 2 Sampling session 0 1 2 3 4 5 6 7 8 9 10 Totalnumberofdeerobserved 0 2 4 6 8 10
  • 13.
    Total number ofdeer observed on transect 4 Sampling Session 0 1 2 3 4 5 6 7 8 9 10 Totalnumberofdeerobserved 0.0 0.5 1.0 1.5 2.0 2.5 3.0 3.5
  • 15.
     Linear Regression P=0.07  R2=0.39  Positive association
  • 16.
     Linear Regression P=0.09  R2=0.35  Positive association
  • 17.
     Linear regression P=0.06  R2=0.41  Positive association
  • 18.
    Year of Study 20072008 2009 2010 2011 2012 2013 2014 Deerperkm2 0 10 20 30 40 50 60 Previous research results
  • 19.
     Deer density=49.012 deer/km2  Greater than 25  Impact › Habitat › Disease  On going study
  • 20.
     Dr. DannyIngold  Dr. Jim Dooley  Dan Beetem  The Wilds  Josh Goedel