Download as PDF, PPTX


![Consul Services
{
"service":
{
"checks":[{"http":"http://localhost:3000","interval":"10s"}],
"id":”grafana",
"name":”grafana",
"port":3000,
"tags":["metrics"]
}
}
dig @127.0.0.1 -p 8600 grafana.service.consul ANY](https://image.slidesharecdn.com/bootstrappingmultidcobservabilitystackgrafana-211002221530/85/Bootstrapping-multidc-observability-stack-5-320.jpg)
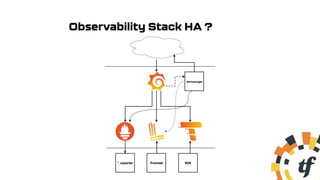
![Consul Prepared Queries
$ curl http://127.0.0.1:8500/v1/query --request POST --data @- << EOF
{
"Name": ”grafana",
"Service": {
"Service": ”grafana",
"Failover": {
"Datacenters": ["dc2"]
}}}
EOF
dig @127.0.0.1 -p 8600 grafana.query.consul ANY](https://image.slidesharecdn.com/bootstrappingmultidcobservabilitystackgrafana-211002221530/85/Bootstrapping-multidc-observability-stack-6-320.jpg)
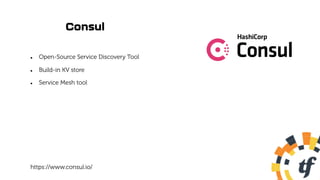
![Alertmanager HA
[Unit]
ExecStart=/usr/local/bin/alertmanager
--config.file=/etc/alertmanager/alertmanager.yaml
--storage.path=/var/lib/alertmanager
--cluster.advertise-address=192.168.43.40:9094
--cluster.peer=192.168.43.41:9094
alerting:
alertmanagers:
- static_configs:
- targets:
- 192.168.43.40:9093
- 192.168.43.41:9093](https://image.slidesharecdn.com/bootstrappingmultidcobservabilitystackgrafana-211002221530/85/Bootstrapping-multidc-observability-stack-14-320.jpg)
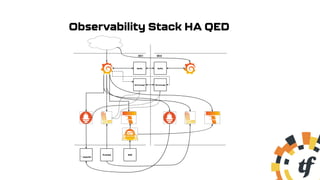


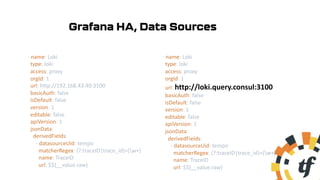
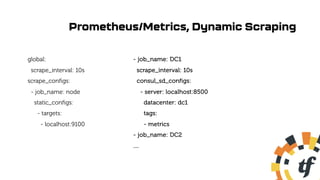
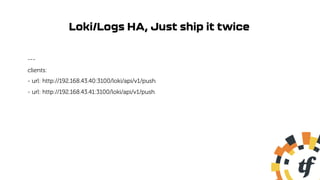
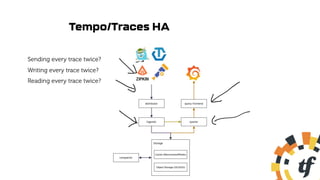
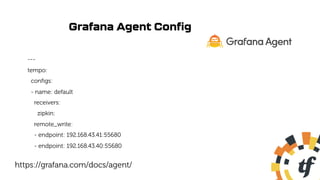
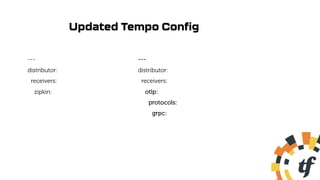
The document outlines a multi-data center (multi-DC) observability stack using tools like Consul, Grafana, Loki, and Tempo, focusing on high availability (HA) configurations across various components. It includes details on service discovery, metrics scraping, and cluster configurations while addressing how to handle data redundancy and synchronization in a multi-DC setup. The author invites questions and provides contact information for further inquiries.