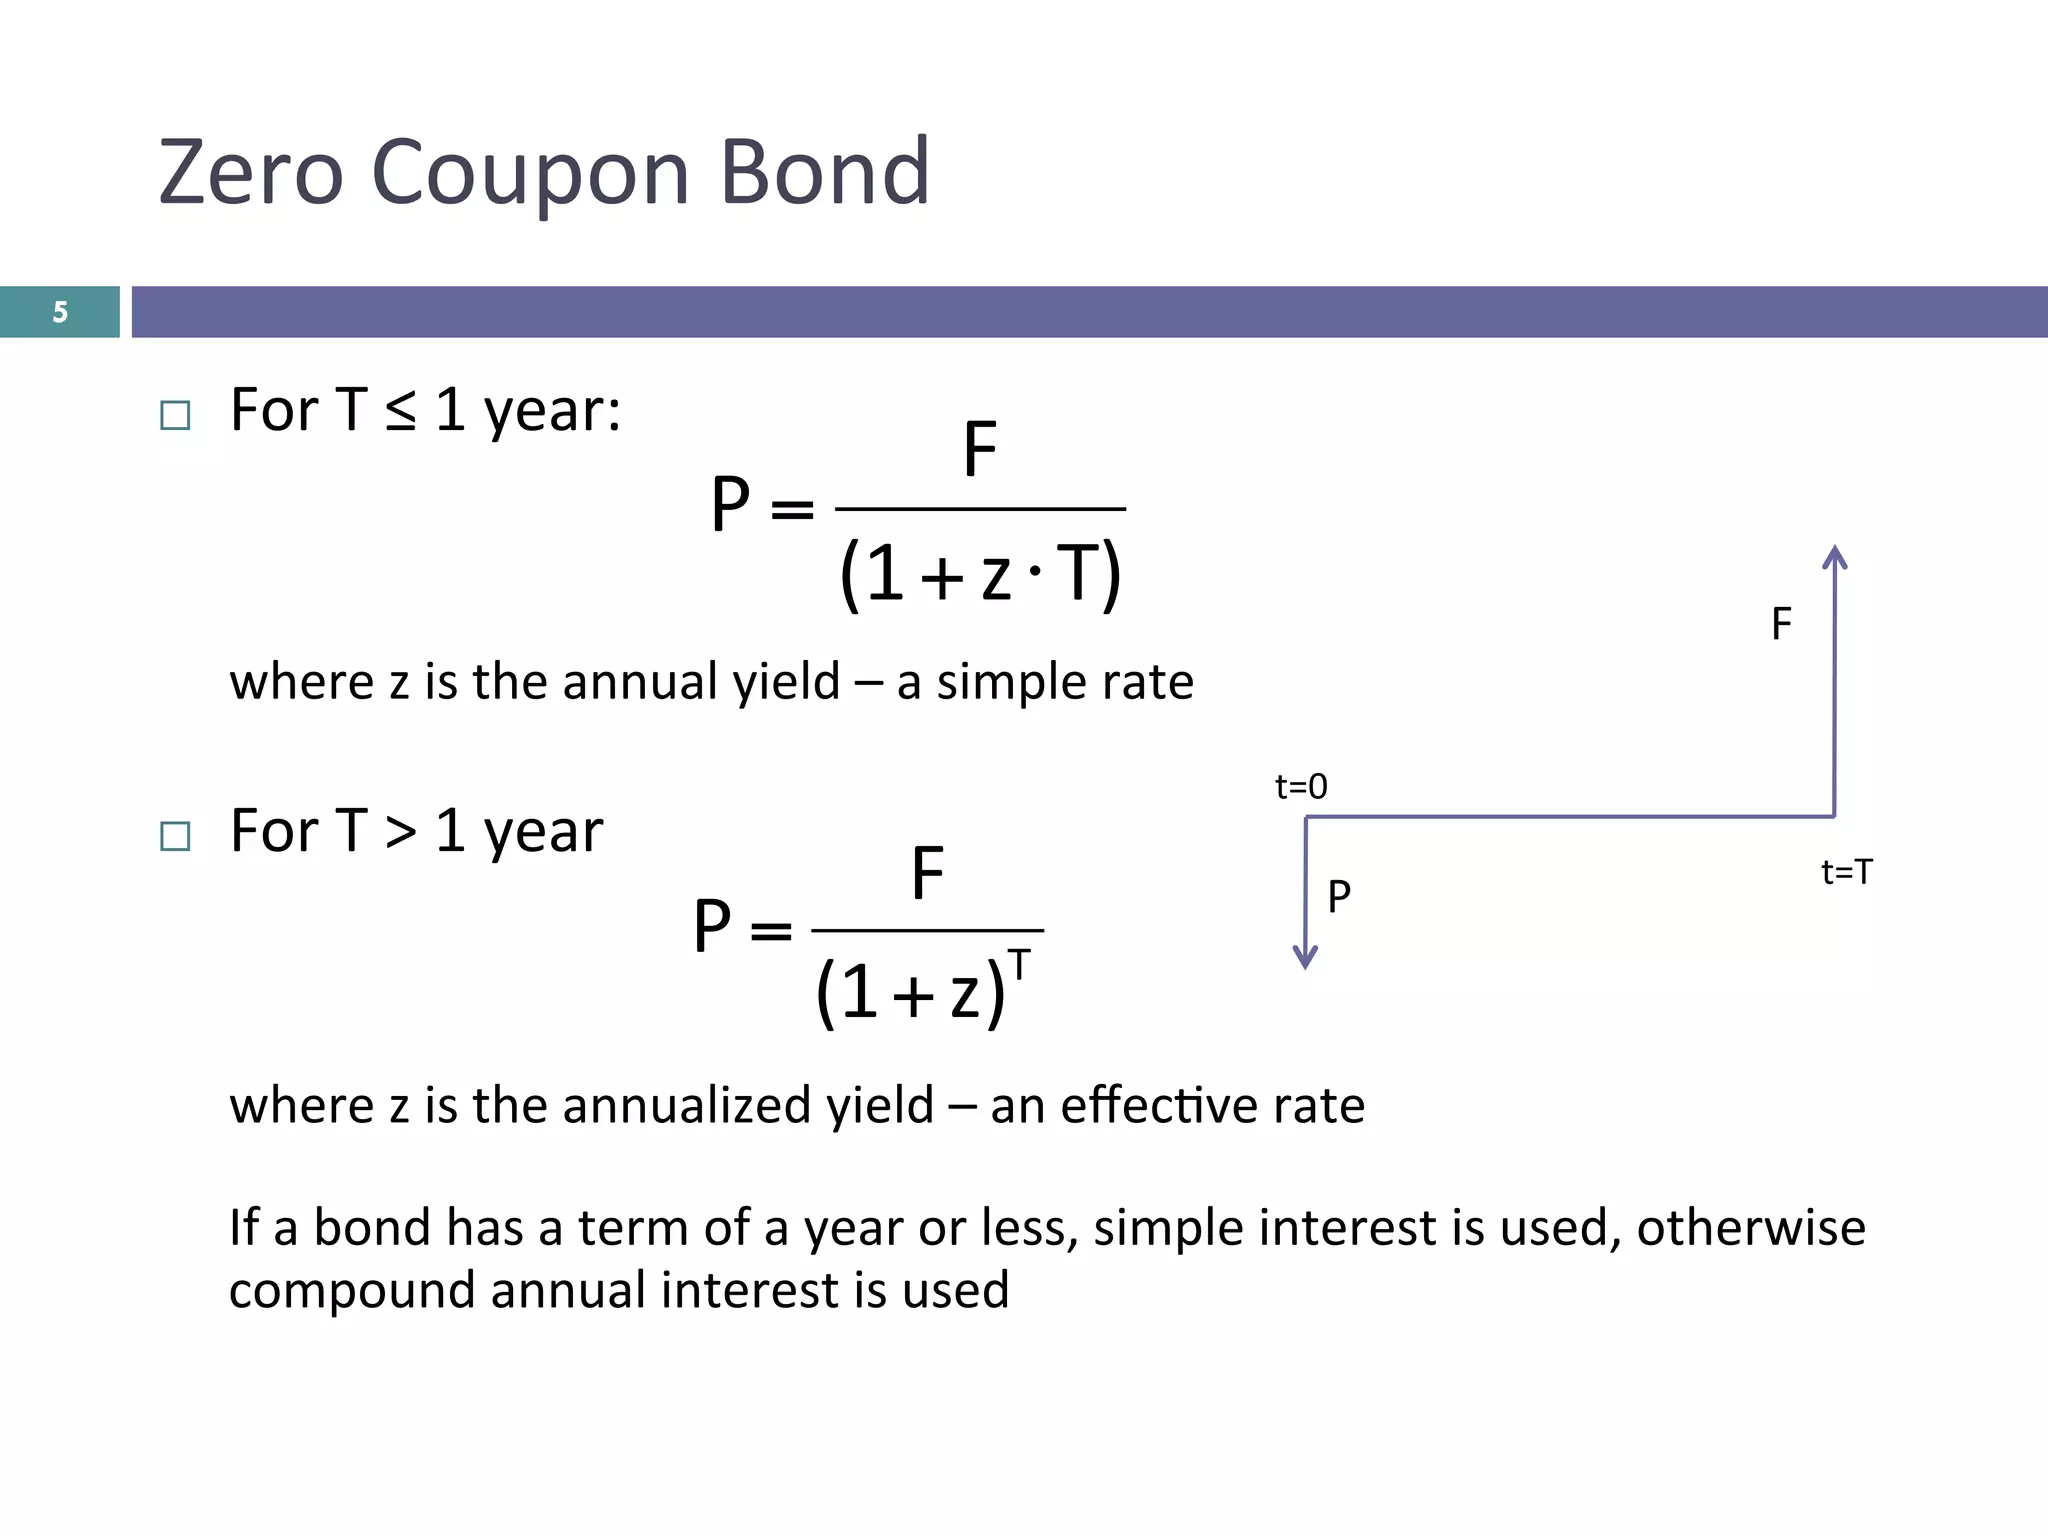
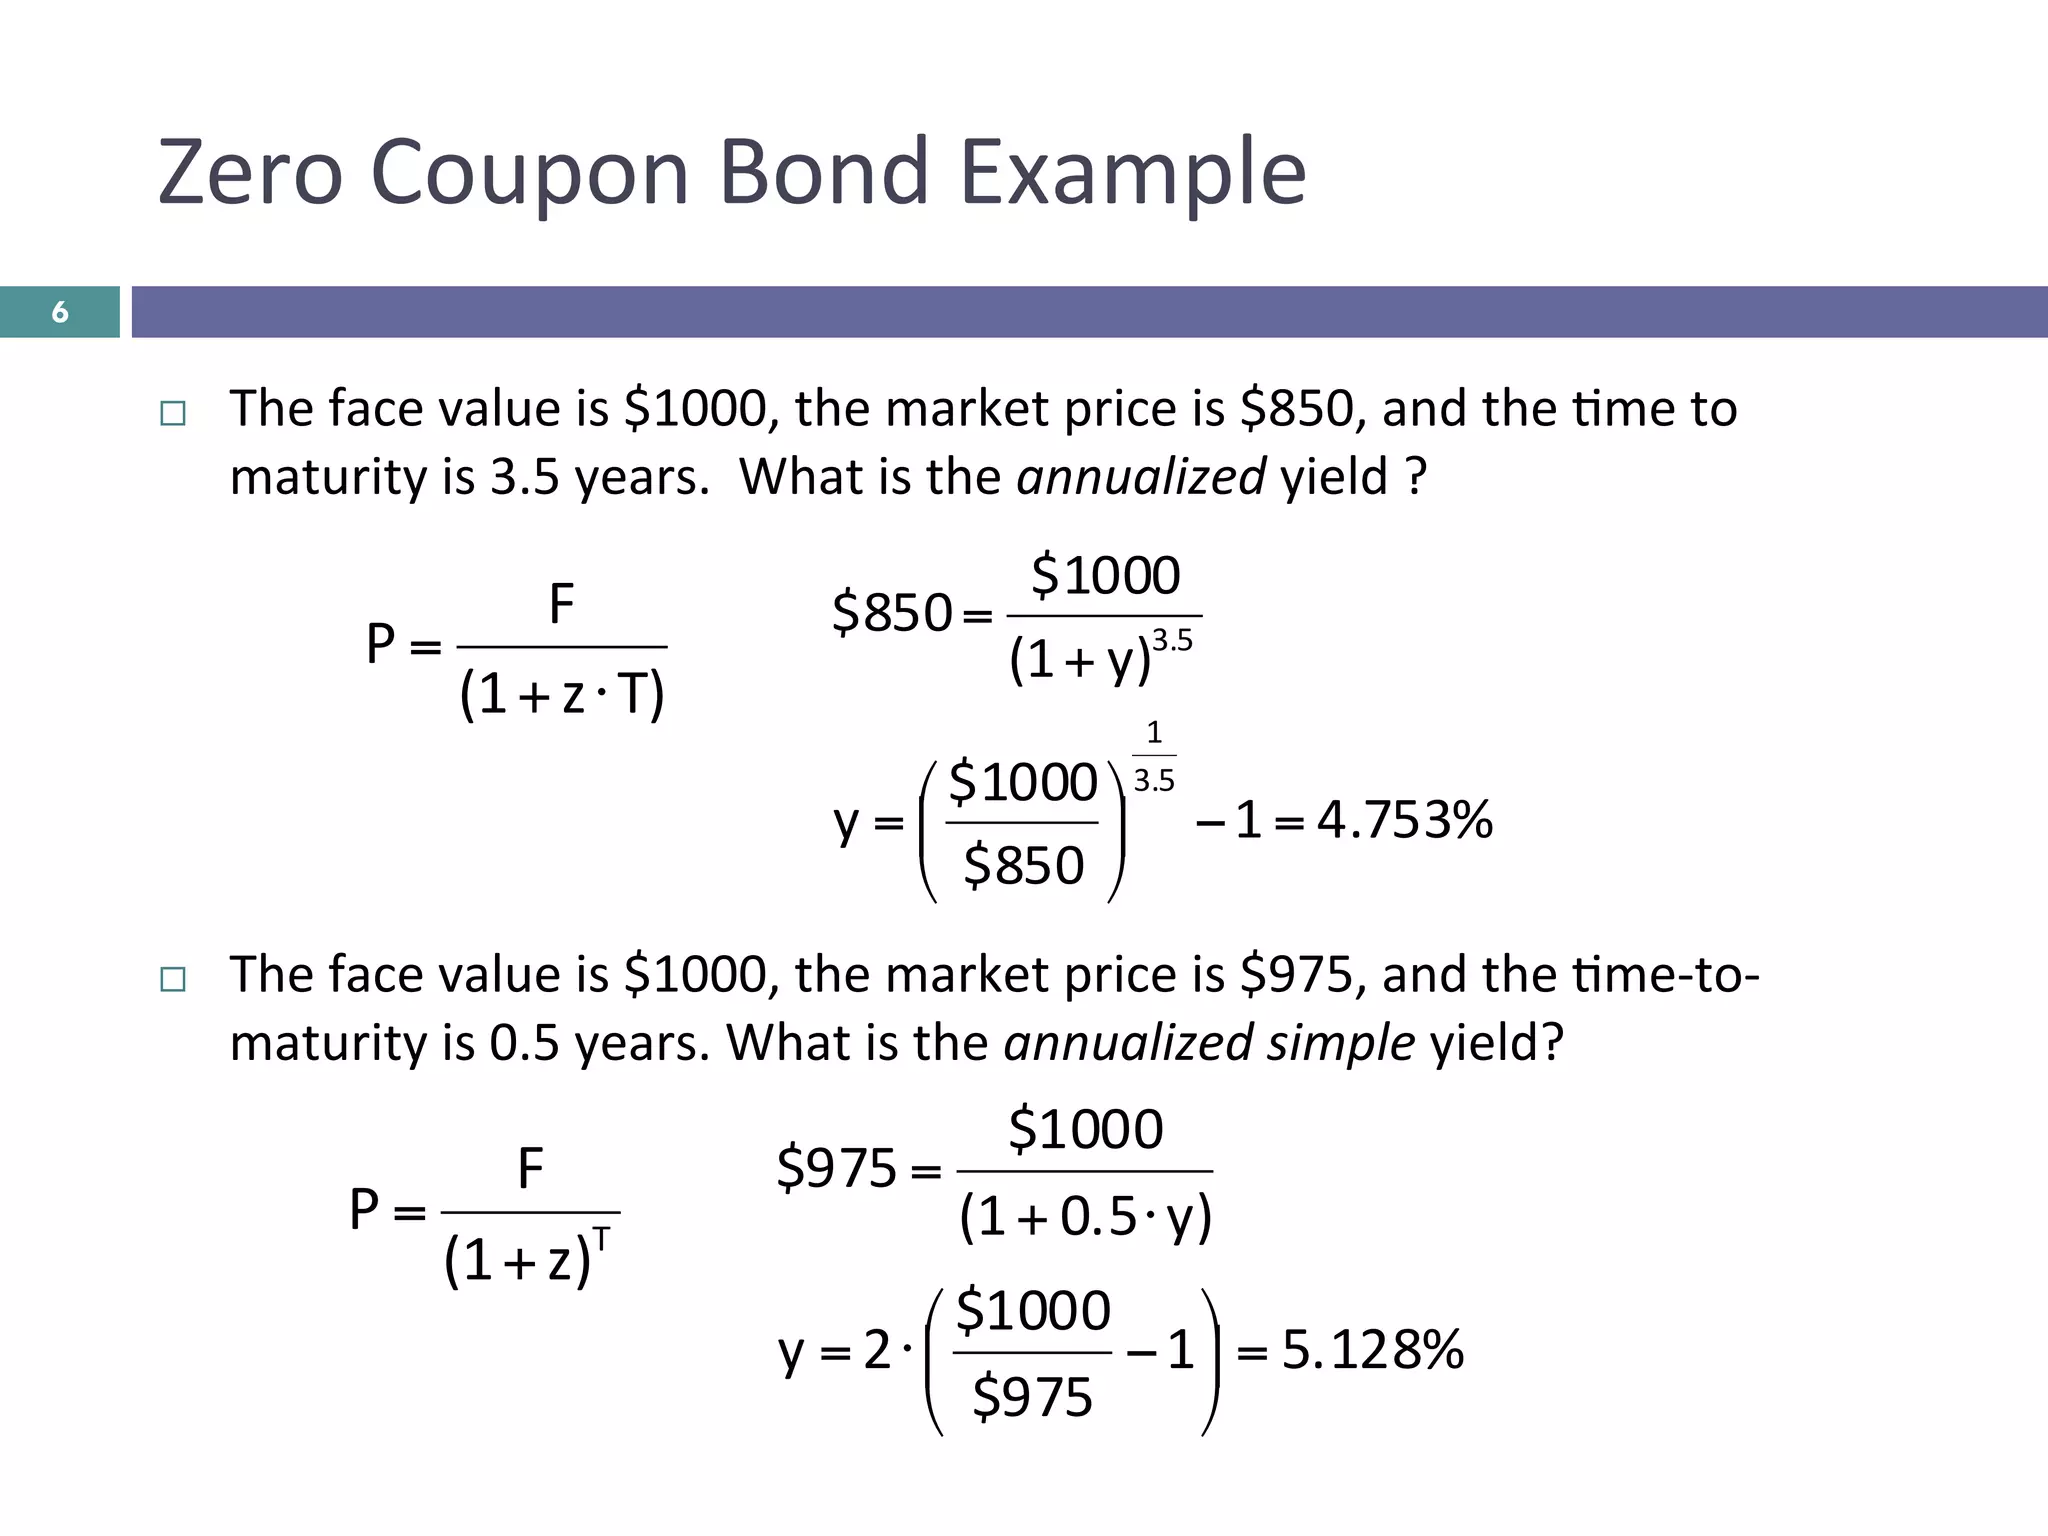
Bonds	
  Prices	
  and	
  Yields	
  	
  
Learning	
  Objec-ves	
  	
  
¨  Types	
  of	
  bonds	
  and	
  bond	
  parameters	
  	
  
¨  The	
  concept	
  of	
  yield	
  
¨  Bond	
  price	
  computed	
  as	
  discounted	
  expected	
  cash	
  flow	
  
¤  Applica-ons	
  	
  
n  Compute	
  bond	
  yield	
  from	
  a	
  known	
  price	
  	
  
n  Compute	
  bond	
  price	
  from	
  a	
  known	
  yield	
  
n  Graph	
  the	
  price	
  v.	
  yield	


n  Compute	
  bond	
  price	
  when	
  yield	
  is	
  not	
  known	
  
n  Graph	
  price	
  v.	
  	
  Time	
  to	
  maturity	
  	
  
n  Compute	
  mortgage	
  payments	
  	
  
¨  Bond	
  price	
  quotes	
  
2
Bonds	
  
¨  Corpora-ons	
  and	
  government	
  en--es	
  can	
  raise	
  capital	
  by	
  selling	
  bonds	
  	
  
¤  Long	
  term	
  liability	
  (accoun-ng)	
  
¤  Debt	
  capital	
  (finance)	
  	
  
¨  The	
  bond	
  has	
  	
  
¤  Principal,	
  par,	
  or	
  face	
  value:	
  F	
  
¤  Price:	
  P	
  
¤  Yield:	
  y	
  	
  (actually	
  “yield	
  to	
  maturity”	
  and	
  the	
  discount	
  rate)	
  	
  
¤  Maturity	
  date,	
  -me	
  to	
  maturity,	
  term,	
  or	
  tenor:	
  T	
  
n  Date	
  at	
  which	
  the	
  bond	
  principal,	
  F,	
  is	
  returned	
  to	
  investors	
  
¤  In	
  the	
  case	
  of	
  a	
  coupon	
  bond	
  	
  (as	
  opposed	
  to	
  a	
  zero	
  coupon	
  bond)	
  
n  Coupon	
  rate:	
  c	
  	
  (annual,	
  simple,	
  nominal	
  rate)	
  	
  
n  Annual	
  payment	
  frequency:	
  m;	
  or	
  period	
  Δt	
  
n  In	
  the	
  U.S.	
  semiannual	
  coupons	
  is	
  typical:	
  m	
  =	
  2	
  or	
  Δt	
  =	
  .5	
  
3
Zero	
  Coupon	
  Bonds	
  
¨  ZCBs	
  do	
  not	
  pay	
  a	
  coupon	
  
¨  The	
  return	
  and	
  	
  ‘yield’	
  (rate)	
  is	
  due	
  to	
  the	
  purchase	
  price	
  at	
  
a	
  discount	
  to	
  face	
  value	


¨  U.S.	
  Treasury	
  bills	
  (T	
  –	
  bills)	
  are	
  zero	
  coupon	
  bonds	
  
¤  Time-­‐to-­‐maturity	
  at	
  issue	
  is	
  4,	
  13,	
  26,	
  52	
  weeks	


¤  Face	
  value	
  $100	
  to	
  $5,000,000	
  
¨  A	
  ZCB	
  yield	
  is	
  the	
  interest	
  rate,	
  	
  
and	
  the	
  discount	
  rate	
  denoted	
  z	
  	
  
4
F	
  
P	
  
t=0	
  
t=T	
  
Zero	
  Coupon	
  Bond	
  
¨  For	
  T	
  ≤	
  1	
  year:	
  
	
  where	
  z	
  is	
  the	
  annual	
  simple	
  rate	
  or	
  yield	


¨  For	
  T	
  >	
  1	
  year	
  
	
  where	
  z	
  is	
  the	
  annualized	
  effec-ve	
  rate	
  or	
  yield	


If	
  a	
  bond	
  has	
  a	
  term	
  of	
  a	
  year	
  or	
  less,	
  simple	
  interest	
  is	
  used,	
  otherwise	
  
compound	
  annual	
  interest	
  is	
  used	
  by	
  conven-on	


T)z(1
F
P
⋅+
=
T
z)(1
F
P
+
=
5
F	
  
P	
  
t=0	
  
t=T	
  
Zero	
  Coupon	
  Bond	
  Example	
  	
  
¨  The	
  face	
  value	
  is	
  $1000,	
  the	
  market	
  price	
  is	
  $850,	
  and	
  the	
  -me	
  to	
  
maturity	
  is	
  3.5	
  years.	
  	
  What	
  is	
  the	
  annualized	
  yield	
  ?	


¨  The	
  face	
  value	
  is	
  $1000,	
  the	
  market	
  price	
  is	
  $975,	
  and	
  the	
  -me-­‐to-­‐
maturity	
  is	
  0.5	
  years.	
  What	
  is	
  the	
  annualized	
  yield?	


$850 =
$1000
(1+z)3.5
z =
$1000
$850
!
"
#
$
%
&
1
3.5
−1= 4.753%
$975=
$1000
(1+0.5⋅z)
z =2⋅
$1000
$975
−1
#
$
%
&
'
(=5.128%
6
T)z(1
F
P
⋅+
=
T
z)(1
F
P
+
=
Coupon	
  Bond	
  	
  
P	
  	
  =	
  
current	
  
price	
  	
  
C	
  =	
  coupon	
  payment	
  	
  
F	
  =	
  face	
  or	
  
par	
  value	


  t=0.0	


  t=Δt	


  t=2·∙Δt	


  t=M·∙Δt=T 	


  i=0	


  i=1	


  i=2	


  i=M	


  t0=0.0	


  t1=Δt	


  t2=2Δt 	


  tM=	
  M·∙Δt	
  =T
7
Coupon	
  Payment	
  	
  
¨  Bond	
  coupon	
  cash	
  flows,	
  C,	
  are	
  defined	
  by	
  a	
  nominal,	
  simple	
  
coupon	
  rate,	
  c,	
  and	
  a	
  compounding	
  frequency	
  per	
  year,	
  m,	
  or	
  
coupon	
  period	
  measured	
  in	
  years,	
  Δt	
  
¨  The	
  total	
  cash	
  flow	
  at	
  -me	
  ti,	
  CFi,	
  is	
  defined	
  as:	
  
CFi
$=$C$$$$$$$$for$$i<M
CFM
$=$C$+$F
8
$8.125	
  	
  C
.5t
1000$F
%625.1c
example
tFc	
  C
=
=Δ
=
=
Δ⋅⋅=
%y1
2
y
1
%632.11
2
1.625%
1
y	
  rate,	
  	
  coupon	
  	
  Effective
2
2
=−⎟
⎠
⎞
⎜
⎝
⎛
+
=−⎟
⎠
⎞
⎜
⎝
⎛
+
T=num	
  of	
  years	
  (floa-ng)	
  
N=num	
  of	
  years	
  (integer)	


m=periods	
  per	
  year	


In	
  this	
  course,	
  generally	
  M=NŸm	


360=	
  30	
  Ÿ12	
  
Coupon	
  Bond	
  Yield	
  
¨  Yield	
  to	
  maturity	
  is	
  the	
  actual	
  yield	
  achieved	
  for	
  a	
  coupon	
  
bond	
  if	
  	
  
¤  The	
  bond	
  is	
  held	
  to	
  maturity,	
  and	
  	
  
¤  Each	
  coupon	
  payment	
  is	
  reinvested	
  at	
  a	
  rate	
  of	
  return	
  of	
  y	
  through	
  
-me	
  T	
  
n  The	
  risk	
  that	
  coupons	
  cannot	
  be	
  reinvented	
  at	
  a	
  rate	
  greater	
  than	
  or	
  
equal	
  to	
  y	
  due	
  to	
  market	
  condi-ons	
  is	
  called	
  “reinvestment	
  risk”	
  
¨  The	
  yield	
  to	
  maturity	
  is	
  the	
  investor’s	
  expected	
  return	
  on	
  
investment	
  and	
  is	
  thus	
  the	
  issuer’s	
  rate	
  cost	
  
¤  It’s	
  the	
  issuer’s	
  cost	
  of	
  debt,	
  kD,	
  for	
  the	
  bond	
  
¨  The	
  yield	
  reflects	
  both	
  the	
  -me	
  value	
  of	
  money	
  and	
  the	
  
credit	
  worthiness	
  of	
  the	
  borrower	
  
¤  The	
  expected	
  variance	
  in	
  the	
  cash	
  flow	
  is	
  reflected	
  in	
  the	
  yield	
  	
  
9
Bond	
  Price	
  
¨  The	
  discount	
  rate	
  y	
  is	
  the	
  yield	
  to	
  maturity	
  or	
  simply	
  the	
  yield	
  
on	
  a	
  coupon	
  bond	
  
¨  It’s	
  an	
  internal	
  rate	
  of	
  return	
  that	
  sets	
  the	
  discounted	
  cash	
  
flow	
  on	
  the	
  right	
  hand	
  side	
  to	
  the	
  market	
  price	
  of	
  the	
  bond,	
  
P,	
  on	
  the	
  lek	
  hand	
  side	
  
∑= +
=
M
1i
t
i
i
)y(1
CF
P∑=
⎟
⎠
⎞
⎜
⎝
⎛
+
=
M
1i
i
i
m
y
1
FC
P
10
y	
  is	
  the	
  nominal	
  annual	
  yield	
  
to	
  maturity	
  	
  in	
  this	
  formula	
  
with	
  integer	
  periods	
  	
  
y	
  is	
  effec8ve	
  annual	
  yield	
  to	
  
maturity	
  in	
  this	
  formula	
  with	
  
discrete	
  real	
  -me	
  periods	
  	
  
¨  For	
  a	
  frac-onal	
  ini-al	
  coupon	
  period:	
  	
  t1	
  <	
  ∆t	
  
Frac-onal	
  Ini-al	
  Time	
  Period	
  
For	
  a	
  bond	
  with	
  semi-­‐annual	
  coupons,	
  assume	
  that	
  the	
  next	
  coupon	
  payment	
  
is	
  in	
  3	
  months.	
  	
  The	
  coupon	
  payments	
  occur	
  at	


t0=0.0,	
  	
  t1=0.25,	
  	
  	
  t2=0.75,	
  	
  t3=1.25,	
  t4	
  =	
  1.75,	
  	
  …	


  i=0	


  i=1	


  i=2	


  i=M	


  t0=0.0	


  t1	


  t2=t1+Δt 	


  tM=	
  T
C	
  =	
  coupon	
  payment	
  	
  
F	
  =	
  face	
  or	
  
par	
  value	
  	
  
11
Zero	
  Coupon	
  Bonds	
  Again	
  	
  
¨  A	
  bond	
  dealer	
  can	
  split	
  a	
  coupon	
  bond	
  into	
  ZCBs	
  
¤  one	
  for	
  the	
  principal	
  and	
  	
  
¤  one	
  for	
  each	
  coupon	
  
¤  This	
  is	
  called	
  ‘stripping’	
  the	
  bond	
  
¨  The	
  advantage	
  of	
  a	
  ZCB	
  is	
  that	
  there	
  is	
  no	
  reinvestment	
  risk	
  
¨  For	
  a	
  ZCB,	
  the	
  yield,	
  y,	
  is	
  the	
  zero	
  coupon	
  rate	
  denoted	
  as	
  z	
  
12
Bond	
  Equa-on	
  Applica-ons	
  	
  
¨  Find	
  the	
  yield-­‐to-­‐maturity,	
  y,	
  from	
  a	
  known	
  market	
  price,	
  P	
  
¤  Solve	
  for	
  y	
  (nominal,	
  y,	
  or	
  effec-ve,	
  y	
  ‘bar’)	


¤  Solve	
  for	
  the	
  roots	
  of	
  a	
  nonlinear	
  equa-on	
  
n  In	
  this	
  course	
  use	
  Excel	
  	
  Goal	
  Seek	
  
¤  Example:	
  Compute	
  both	
  the	
  effec8ve	
  and	
  nominal	
  yield	
  for	
  a	
  bond	
  
with	
  $1000	
  face	
  value,	
  current	
  market	
  price	
  of	
  $800,	
  coupon	
  rate	
  of	
  
7%	
  paid	
  semiannually,	
  and	
  4.5	
  years	
  to	
  maturity.	


∑= +
=
M
1i
t
i
i
)y(1
CF
P∑=
⎟
⎠
⎞
⎜
⎝
⎛
+
=
M
1i
i
i
m
y
1
FC
P
13
Bond	
  Equa-on	
  Applica-ons	
  
$1,000 F
7.00% c nominal
13.434% y effective	
  
t CF DF DCF
0 $0 $0.00
0.5 $35 0.939 $32.86
1 $35 0.882 $30.85
1.5 $35 0.828 $28.97
2 $35 0.777 $27.20
2.5 $35 0.730 $25.54
3 $35 0.685 $23.98
3.5 $35 0.643 $22.51
4 $35 0.604 $21.14
4.5 $1,035 0.567 $586.94
Sum $1,315 P $800.00
13.011% y nominal
t i	
   CF DF DCF
0 0 $0 $0.00
0.5 1 $35 0.939 $32.86
1 2 $35 0.882 $30.85
1.5 3 $35 0.828 $28.97
2 4 $35 0.777 $27.20
2.5 5 $35 0.730 $25.54
3 6 $35 0.685 $23.98
3.5 7 $35 0.643 $22.51
4 8 $35 0.604 $21.14
4.5 9 $1,035 0.567 $586.94
Sum $1,315 P $800.00
∑= +
=
M
1i
t
i
i
)y(1
CF
P ∑=
⎟
⎠
⎞
⎜
⎝
⎛
+
=
M
1i
i
i
m
y
1
FC
P
14
Bond	
  Equa-on	
  Applica-ons	
  
¤  Convert	
  the	
  nominal	
  yield	
  to	
  the	
  effec-ve	
  yield	


¨  Find	
  market	
  price	
  from	
  a	
  known	
  yield	
  
¤  For	
  the	
  bond	
  in	
  the	
  last	
  example,	
  what	
  is	
  the	
  price?	
  	
  
n  Given	
  an	
  effec8ve	
  annual	
  yield	
  of	
  12%	
  	
  or	
  	
  
n  A	
  nominal	
  annual	
  yield	
  of	
  12%	
  
1
2
y
1y
1
2
%011.13
1%434.13
2
2
−⎟
⎠
⎞
⎜
⎝
⎛
+=
−⎟
⎠
⎞
⎜
⎝
⎛
+=
15
Bond	
  Equa-on	
  Applica-ons	
  
$1,000 F
7.00% c nominal
12.000% y effective	
  
t CF DF DCF
0 $0 $0.00
0.5 $35 0.945 $33.07
1 $35 0.893 $31.25
1.5 $35 0.844 $29.53
2 $35 0.797 $27.90
2.5 $35 0.753 $26.36
3 $35 0.712 $24.91
3.5 $35 0.673 $23.54
4 $35 0.636 $22.24
4.5 $1,035 0.601 $621.53
Sum $1,315 P $840.34
∑= +
=
M
1i
t
i
i
)y(1
CF
P
12.000% y nominal
t i	
   CF DF DCF
0 0 $0 $0.00
0.5 1 $35 0.943 $33.02
1 2 $35 0.890 $31.15
1.5 3 $35 0.840 $29.39
2 4 $35 0.792 $27.72
2.5 5 $35 0.747 $26.15
3 6 $35 0.705 $24.67
3.5 7 $35 0.665 $23.28
4 8 $35 0.627 $21.96
4.5 9 $1,035 0.592 $612.61
Sum $1,315 P $829.96
∑=
⎟
⎠
⎞
⎜
⎝
⎛
+
=
M
1i
i
i
m
y
1
FC
P
16
Bond	
  Equa-on	
  Applica-ons	
  
¨  For	
  the	
  bond	
  with	
  a	
  12%	
  effec-ve	
  yield	
  and	
  price	
  $840.34	
  
at	
  -me	
  0,	
  here’s	
  a	
  plot	
  of	
  price	
  as	
  -me	
  progress	
  from	
  0	
  to	
  
4.5	
  years	
  assuming	
  a	
  constant	
  yield	
  of	
  12%	
  
$825
$850
$875
$900
$925
$950
$975
$1,000
$1,025
$1,050
0.0 0.5 1.0 1.5 2.0 2.5 3.0 3.5 4.0 4.5
Time
Price17
Yield	
  Curve	
  
¨  A	
  graph	
  can	
  be	
  developed	
  that	
  plots	
  various	
  (annualized)	
  
yields-­‐to-­‐maturity	
  against	
  -mes-­‐to-­‐maturity	
  for	
  bonds	
  from	
  
the	
  same	
  issuing	
  en-ty	
  or	
  from	
  issuing	
  en--es	
  with	
  the	
  same	
  
risk	
  
y
0	


  T
18
Bloomberg	
  	
  
Animated	
  yield	
  curve	
  
Yield	
  Curve	
  
¨  The	
  most	
  useful	
  version	
  of	
  the	
  yield	
  curve	
  plots	
  zero	
  coupon	
  bond	
  yields	
  
against	
  -mes-­‐to-­‐maturity	
  
¨  A	
  zero	
  coupon	
  yield	
  curve	
  depicts	
  pure	
  interest	
  rates	
  with	
  no	
  ambiguity	
  in	
  
the	
  risk	
  associated	
  with	
  the	
  yield	
  
¨  Thus	
  we	
  can	
  use	
  ZCB	
  yield	
  curve	
  to	
  plot	
  the	
  interest	
  rate	
  with	
  respect	
  to	
  
-me-­‐to-­‐maturity,	
  or	
  holding	
  period	
  
¨  Yields	
  on	
  zero	
  coupon	
  U.S.	
  Treasury	
  debt	
  are	
  risk	
  free	
  
¨  The	
  addi-onal	
  yield	
  for	
  non-­‐U.S.	
  Treasury	
  debt	
  is	
  due	
  largely	
  to	
  credit	
  risk	
  
and	
  is	
  called	
  a	
  risk	
  premium	
  or	
  a	
  credit	
  spread	
  
¨  Moody’s	
  and	
  Standard	
  &	
  Poor’s	
  evaluate	
  bond	
  credit	
  risk	
  via	
  analysis	
  of	
  
the	
  issuer’s	
  financial	
  posi-on	
  and	
  assign	
  risk	
  levels	
  such	
  as	
  AA	
  that	
  
translate	
  into	
  credit	
  risk	
  premiums	
  
19
Corporate	
  Credit	
  Ra-ng	
  
From Investopedia
20
AAA companies
Yield	
  Curve	
  
¨  A	
  corporate	
  bond,	
  say	
  a	
  AA	
  rated	
  bond,	
  might	
  have	
  
the	
  following	
  yield	
  curve	


y	
  
0	


  T	
  
AA	
  Corporate	
  Bond	
  Yield	
  Curve	
  	
  
U.S.	
  Treasury	
  Debt	
  Yield	
  Curve	
  	
  
risk	
  premium	
  and	
  credit	
  spread	


21
Other	
  Types	
  of	
  Risk	
  
¨  Another	
  type	
  of	
  risk	
  known	
  as	
  liquidity	
  risk	
  
¨  Results	
  from	
  a	
  bond	
  having	
  few	
  buyers	
  and	
  sellers	
  
¤  The	
  issue	
  is	
  “illiquid”	


¨  Newer	
  U.S.	
  Treasuries	
  (referred	
  to	
  as	
  “on	
  the	
  run”)	
  
can	
  trade	
  with	
  a	
  liquidity	
  premium	
  compared	
  with	
  
old	
  U.S.	
  Treasuries	
  (referred	
  to	
  as	
  “off	
  the	
  run”)	


y	
  =	
  f(risk	
  free	
  -me	
  value	
  of	
  money,	
  credit	
  risk,	
  
liquidity	
  risk)	
  
22
Reinvestment	
  Risk	
  
¨  Consider	
  a	
  $1000	
  bond	
  with	
  a	
  coupon	
  rate	
  of	
  10%	
  paid	
  annually	
  for	
  10	
  years.	
  
Ini-ally,	
  the	
  yield	
  is	
  11%,	
  the	
  price	
  is	
  $941.11,	
  and	
  the	
  yield	
  curve	
  is	
  flat.	
  Prior	
  to	
  
the	
  payment	
  of	
  the	
  next	
  coupon,	
  we	
  consider	
  three	
  scenarios	
  
1.  the	
  yield	
  curve	
  shiks	
  parallel	
  down	
  to	
  9%	
  
2.  the	
  yield	
  curve	
  remains	
  flat	
  at	
  11%	
  
3.  the	
  yield	
  curve	
  shiks	
  parallel	
  up	
  to	
  12%	
  
What	
  are	
  the	
  actual	
  yields?	
  	
  
$1,000 F
10.00% c nominal Year CF DF DCF 9% 11% 12%
11.00% y nominal 1 100$ 0.9009 90.09$ 217.19$ 255.80$ 277.31$
2 100$ 0.8116 81.16$ 199.26$ 230.45$ 247.60$
3 100$ 0.7312 73.12$ 182.80$ 207.62$ 221.07$
4 100$ 0.6587 65.87$ 167.71$ 187.04$ 197.38$
5 100$ 0.5935 59.35$ 153.86$ 168.51$ 176.23$
6 100$ 0.5346 53.46$ 141.16$ 151.81$ 157.35$
7 100$ 0.4817 48.17$ 129.50$ 136.76$ 140.49$
8 100$ 0.4339 43.39$ 118.81$ 123.21$ 125.44$
9 100$ 0.3909 39.09$ 109.00$ 111.00$ 112.00$
10 1,100$ 0.3522 387.40$ 1,100.00$ 1,100.00$ 1,100.00$
Sum 941.11$ 2,519.29$ 2,672.20$ 2,754.87$
Yield To Maturity 10.35% 11.00% 11.34%
Bond Price Calculation Future Value of Coupon Reinvestment
23
Bond	
  Price	
  Quotes	
  
¨  Dirty	
  and	
  clean	
  prices	


¤  Dirty	
  price	
  
n  Price	
  from	
  DCF	
  formula	
  	
  
n  Transac-on	
  price	
  
n  When	
  the	
  seller	
  sells	
  at	
  this	
  price	
  she	
  gets	
  the	
  prorated	
  share	
  
(accumulated	
  interest)	
  of	
  the	
  next	
  coupon	
  
¤  Clean	
  price	
  
n  Price	
  quoted	
  by	
  bond	
  dealer	
  
n  Excludes	
  accumulated	
  interest	
  on	
  next	
  coupon	
  payment	
  
¤  Clean	
  price	
  =	
  Dirty	
  price	
  –	
  accumulated	
  interest	
  
n  Accumulated	
  as	
  simple	
  interest	
  using	
  applicable	
  day	
  count	
  conven-on	
  	
  
24
Clean	
  and	
  Dirty	
  Bond	
  Prices	
  	
  
Bond	
  purchased	
  just	
  aker	
  its	
  8/15/2008	
  coupon	
  	
  	
   Bond	
  purchased	
  6/12/2009	


From	
  8/15/08	
  to	
  8/15/09	
  is	
  365	
  days From	
  8/15/08	
  to	
  6/12/09	
  is	
  301	
  days	
  or	
  .825	
  yrs	
  
From	
  6/12/09	
  to	
  8/15/09	
  is	
  64	
  days	
  or	
  .175	
  yrs	
  	
  
Payment	
  
Date	
  
t CF DF DCF
15-­‐Aug-­‐08 0 $0 1.000 $0.00
15-­‐Aug-­‐09 1 $5 0.962 $4.81
15-­‐Aug-­‐10 2 $5 0.925 $4.62
15-­‐Aug-­‐11 3 $5 0.889 $4.44
15-­‐Aug-­‐12 4 $5 0.855 $4.27
15-­‐Aug-­‐13 5 $5 0.822 $4.11
15-­‐Aug-­‐14 6 $105 0.790 $82.98
Sum $130.00 P $105.24
Payment	
  
Date	
  
t CF DF DCF
12-­‐Jun-­‐09 0 $0 1.000 $0.00
15-­‐Aug-­‐09 0.175 $5 0.993 $4.97
15-­‐Aug-­‐10 1.175 $5 0.955 $4.77
15-­‐Aug-­‐11 2.175 $5 0.918 $4.59
15-­‐Aug-­‐12 3.175 $5 0.883 $4.41
15-­‐Aug-­‐13 4.175 $5 0.849 $4.24
15-­‐Aug-­‐14 5.175 $105 0.816 $85.71
Sum $130.00 P $108.70
F=$100,	
  c=5%,	
  y=4%,	
  m=1	
  
25
$100
$101
$102
$103
$104
$105
$106
$107
$108
$109
$110
0.0 0.5 1.0 1.5 2.0 2.5 3.0 3.5 4.0 4.5 5.0 5.5 6.0
Time
PriceDirty	
  and	
  Clean	
  Prices	
  
15	
  
Aug	
  
2008	
   Clean	
  price	
  @	
  6/12/09	
  =	
  Dirty	
  price	
  –	
  accumulated	
  interest	


  =	
  $108.70	
  –	
  $5	
  ·∙	
  301	
  /	
  365	


  =	
  $108.70	
  -­‐	
  $4.12	
  =	
  	
  $104.58	
  
15	
  
Aug	
  
2009	
  
26
12	
  June	
  2009	
  
Bond	
  Price	
  Quotes	
  
¨  Bid	
  and	
  ask	
  prices	
  	
  
¤  The	
  clean	
  price	
  is	
  quoted	
  for	
  bid	
  and	
  ask	
  prices	
  
n  The	
  dealer	
  will	
  buy	
  a	
  bond	
  at	
  the	
  bid	
  price	
  	
  
n  The	
  dealer	
  will	
  sell	
  a	
  bond	
  at	
  the	
  ask	
  (offer)	
  price	
  
¨  Bond	
  prices	
  are	
  quoted	
  rela-ve	
  to	
  100	
  regardless	
  of	
  
actual	
  par	
  value	
  
¤  Price	
  is	
  quoted	
  as	
  a	
  percent	
  of	
  par	


¨  Example	
  
27
Plot	
  price	
  v.	
  yields	
  to	
  maturity	
  	
  
$700
$800
$900
$1,000
$1,100
$1,200
$1,300
0% 2% 4% 6% 8% 10% 12% 14% 16%
Yield
Price
F=$1000	
  
c=7%	
  semiannual	
  
T=4.5	
  yrs	
  	
  
Bond	
  “price	
  –	
  yield”	
  or	
  P-­‐y	
  curve	
  
Illustrates	
  how	
  price	
  changes	
  as	
  yield-­‐to-­‐maturity	
  changes	
  for	
  a	
  
par-cular	
  bond	
  (	
  c,	
  m,	
  M,	
  and	
  F	
  are	
  constant)	
  
Each	
  point	
  
represents	
  a	
  
DCF	
  calcula-on	
  
∑= +
=
M
1i
t
i
i
)y(1
CF
P
28
Determine	
  the	
  fair	
  price	
  of	
  a	
  bond	
  	
  
¨  In	
  this	
  case	
  c,	
  m,	
  T,	
  and	
  the	
  relevant	
  zero	
  coupon	
  
yield	
  curve	
  are	
  known	
  
¨  Compute	
  the	
  fair	
  value,	
  P	
   ∑= +
=
M
1i
t
i
i
i
)z(1
CF
P
zt	
  
0	


  T	
  for	
  zero	
  coupon	
  bonds	
  
ti	
  for	
  bond	
  cash	
  flows	
  
CFt	
  
Cash	
  flow	
  diagram	
  
Zero	
  coupon	
  bond	
  yield	
  curve	
  
29
Example	
  of	
  pricing	
  a	
  bond	


Price of the bond
F=$1000	
  
c=7%	
  semiannual	
  
T=4.5	
  yrs	
  
With	
  the	
  following	
  zero	
  coupon	
  yield	
  curve
$1,000 F t CF z DF DCF
7.00% c	
  nominal 0 $0 4.00% $0.00
0.5 $35 4.85% 0.977 $34.18
1 $35 5.20% 0.951 $33.27
1.5 $35 5.47% 0.923 $32.31
2 $35 5.70% 0.895 $31.33
2.5 $35 5.90% 0.867 $30.33
3 $35 6.08% 0.838 $29.32
3.5 $35 6.24% 0.809 $28.31
4 $35 6.40% 0.780 $27.31
4.5 $1,035 6.55% 0.752 $778.09
Sum $1,315 P $1,024.46
0%
1%
2%
3%
4%
5%
6%
7%
0 0.5 1 1.5 2 2.5 3 3.5 4 4.5
t
z
30
Home	
  Mortgage	
  Calcula-on	
  	
  
¨  Given	
  the	
  nominal	
  interest	
  rate,	
  m=12,	
  P,	
  and	
  N,	
  
what	
  is	
  the	
  monthly	
  payment,	
  C?	


¨  C	
  :	
  	
  monthly	
  payment	
  
¤  Includes	
  principal	
  repayment	
  and	
  interest	
  –	
  	
  
there	
  is	
  no	
  return	
  of	
  principal	
  “F”	
  
¨  N	
  :	
  number	
  of	
  years	
  
¨  m	
  :	
  number	
  of	
  compounding	
  periods	
  per	
  year	
  (12	
  for	
  home	
  loans)	
  
¨  y	
  :	
  nominal	
  fixed	
  interest	
  rate	
  for	
  the	
  loan	
  
¨  P	
  :	
  loan	
  principal	
  (the	
  mortgage	
  amount)	
  	
  
¨  Solve	
  for	
  C	
  using	
  Excel	
  Goal	
  Seek	
  	
  
¤  Find	
  the	
  value	
  of	
  C	
  that	
  equates	
  the	
  lek	
  and	
  right	
  hand	
  sides	
  	
  
∑=
⎟
⎠
⎞
⎜
⎝
⎛
+
=
M
1i
i
i
m
y
1
C
P
31
Mortgage	
  Example	
  	
  
¨  You	
  wish	
  to	
  borrow	
  $300,000	
  at	
  6.5%	
  fixed	
  for	
  30	
  years.	


¨  The	
  following	
  excel	
  table	
  shows	
  the	
  calcula-ons	
  for	
  the	
  first	
  
12	
  months	
  and	
  the	
  last	
  5	
  months.	


¨  The	
  monthly	
  payment	
  of	
  $1896	
  is	
  determined	
  using	
  goal	
  seek	
  
to	
  force	
  the	
  sum	
  of	
  the	
  last	
  column	
  to	
  $300,000.	


¨  Note	
  that	
  you	
  will	
  pay	
  out	
  $682,633	
  in	
  principal	
  and	
  interest	
  
¤  $300,000	
  in	
  principal	
  	
  
¤  $382,633	
  in	
  interest	
  	
  
32
Mortgage	
  Example	
  	
  
t i	
   CF DF DCF
0.000 0 -­‐$	


   -­‐$	


0.083 1 1,896$	


   0.995 1,886$	


0.167 2 1,896$	


   0.989 1,876$	


0.250 3 1,896$	


   0.984 1,866$	


0.333 4 1,896$	


   0.979 1,856$	


0.417 5 1,896$	


   0.973 1,846$	


0.500 6 1,896$	


   0.968 1,836$	


0.583 7 1,896$	


   0.963 1,826$	


0.667 8 1,896$	


   0.958 1,816$	


0.750 9 1,896$	


   0.953 1,806$	


0.833 10 1,896$	


   0.947 1,796$	


0.917 11 1,896$	


   0.942 1,787$	


1.000 12 1,896$	


   0.937 1,777$	


29.667 356 1,896$	


   0.146 277$	


29.750 357 1,896$	


   0.145 276$	


29.833 358 1,896$	


   0.145 274$	


29.917 359 1,896$	


   0.144 273$	


30.000 360 1,896$	


   0.143 271$	


Sum 682,633$	
  	
   P 300,000$	
  	
  
∑=
⎟
⎠
⎞
⎜
⎝
⎛
+
=
M
1i
i
i
m
y
1
C
P
$300,000 P
6.500% y	
  nominal
12 m
6.697% y	
  annual	
  effective
0.542% y	
  monthly	
  effective
33
Perpetuity	


34
Now	
  in	
  the	
  case	
  that	
  	
  
M=∞	
  
C	
  is	
  constant	


and	
  of	
  course	
  y	
  <	
  1	


This	
  is	
  a	
  perpetuity	
  
⎟
⎠
⎞
⎜
⎝
⎛
=
m
y
C
P
P=
Ci
(1+y)i
i=1
M
∑
P=C⋅
1
(1+y)i
i=1
∞
∑
P=
C
y
P=
C
y
P=
Ci
(1+y)i
i=1
M
∑
If	
  a	
  nominal	
  annual	
  rate,	
  y,	
  
is	
  used	
  then	
  
P	
  
C	
  
i	
  
Example:	
  	
  How	
  much	
  money	
  do	
  you	
  need	
  to	
  invest,	
  P,	
  to	
  pay	
  out	
  $1	
  per	
  
year	
  forever	
  if	
  the	
  pay	
  out	
  rate	
  is	
  10%	
  (effec-ve)	
  per	
  year?	
  	
  
Annuity	
  	
  
35
Now	
  how	
  much	
  money	
  do	
  you	
  need	
  to	
  invest	
  at	
  
10%	
  to	
  receive	
  a	
  $1	
  /	
  year	
  payout	
  for	
  M	
  years	
  ?	


That’s	
  an	
  annuity	
  (a	
  perpetuity	
  would	
  pay	
  out	
  
forever)	
  	
  P	
  
C	
  
i	


  M	
  	
  	
  M+1	
  
PM+1
=
C
y
P0
M+1
=
C
y
⋅
1
1+y( )
M
=
C
y
⋅ 1+y( )
−M
P = P0
=
C
y
−
C
y
⋅ 1+y( )
−M
=
C
y
⋅ 1− 1+y( )
−M#
$
%
&
'
(
P=
C
y
⋅ 1& 1+y( )
&M"
#
$
%
&
'
C =
P⋅ y
1& 1+y( )
&M
=
P⋅ y⋅ 1+y( )
M
1+y( )
M
−1
P=
C⋅m
y
⋅ 1' 1+
y
m
"
#
$
%
&
'
'M(
)
*
*
+
,
-
-
C=
P⋅
y
m
"
#
$
%
&
'⋅ 1+
y
m
"
#
$
%
&
'
M
1+
y
m
"
#
$
%
&
'
M
'1
M=20	
  years	
  
C=$1	
  
Y=10%	
  
P=$8.51	
  
Annui-es	
  
36
Closed	
  Form	
  Formulas	
  
¨  Annuity	
  	
  
¤  Home	
  mortgage	
  annuity	
  formula	
  example	
  
¨  Bonds	
  
¤  Annuity	
  for	
  coupon	
  payment	
  plus	
  the	
  discounted	
  face	
  
value	


20.1896$
1)%542.0(1
0.542%)(1	
  0.542%$300,000
C 360
360
=⎟⎟
⎠
⎞
⎜⎜
⎝
⎛
−+
+⋅⋅
=
MM
m
y
1
F
m
y
1
m
y
1
m
y
1
CP
⎟
⎠
⎞
⎜
⎝
⎛
+
+
⎟⎟
⎟
⎟
⎟
⎠
⎞
⎜⎜
⎜
⎜
⎜
⎝
⎛
⎟
⎠
⎞
⎜
⎝
⎛
+⎟
⎠
⎞
⎜
⎝
⎛
−
⎟
⎠
⎞
⎜
⎝
⎛
⋅=
37
Closed	
  Form	
  Formulas	
  
¨  Bonds	
  
¤  Example	
  of	
  bond	
  w/	
  F=$1000,	
  c=7%	
  semi-­‐annual,	
  
T=4.5yrs,	
  y	
  annual	
  nominal	
  =	
  13.011%	


¤  Bond	
  with	
  frac-onal	
  ini-al	
  period	


00.800$
2
y
1
$1000
2
13.011%
1
2
13.011%
1
2
13.011%
1
35$P 99
=
⎟
⎠
⎞
⎜
⎝
⎛
+
+
⎟⎟
⎟
⎟
⎟
⎠
⎞
⎜⎜
⎜
⎜
⎜
⎝
⎛
⎟
⎠
⎞
⎜
⎝
⎛
+⎟
⎠
⎞
⎜
⎝
⎛
−
⎟
⎠
⎞
⎜
⎝
⎛
⋅=
⎟
⎟
⎟
⎟
⎟
⎠
⎞
⎜
⎜
⎜
⎜
⎜
⎝
⎛
⎟
⎠
⎞
⎜
⎝
⎛
+⎥
⎥
⎥
⎥
⎦
⎤
⎢
⎢
⎢
⎢
⎣
⎡
⎟
⎠
⎞
⎜
⎝
⎛
+
+
⎟⎟
⎟
⎟
⎟
⎠
⎞
⎜⎜
⎜
⎜
⎜
⎝
⎛
⎟
⎠
⎞
⎜
⎝
⎛
+⋅⎟
⎠
⎞
⎜
⎝
⎛
−
⎟
⎠
⎞
⎜
⎝
⎛
+⋅=
d
eMM
m
y
1
1
m
y
1
F
m
y
1
m
y
1
m
y
1
1CP
38
Closed	
  Form	
  Formulas	
  
.825	


  .175	
  
last	
  coupon	
   next	
  coupon
e=64	
  days	


  d	
  =	
  365	
  days	
  
e/d=.175	
  
8/15/08	


  8/15/09	


  8/15/10	


  8/15/11	


  8/15/12	


  8/15/13	


  8/15/14	


  6/12/09	
  
F=$100	
  
y=4%	
  annual	
  
c=5%	
  annual	
  
y	
  &	
  c	
  	
  are	
  effec-ve	
  &	
  nominal	
  
Clean and Dirty Price example (p. 7.10) using closed form
$100
$101
$102
$103
$104
$105
$106
$107
$108
$109
$110
0.0 0.5 1.0 1.5 2.0 2.5 3.0 3.5 4.0 4.5 5.0 5.5 6.0
Time
Price
39
70.108$
)%4(1
1
)%4(1
$100
)%44%(1
1
4%
1
15$P
365
6455
=
⎟
⎟
⎠
⎞
⎜
⎜
⎝
⎛
+
⎟⎟
⎠
⎞
⎜⎜
⎝
⎛
+
+⎟
⎠
⎞
⎜
⎝
⎛
+
−+⋅=

Bond price and yield pdf

  • 1.
    Bonds  Prices  and  Yields    
  • 2.
    Learning  Objec-ves     ¨  Types  of  bonds  and  bond  parameters     ¨  The  concept  of  yield   ¨  Bond  price  computed  as  discounted  expected  cash  flow   ¤  Applica-ons     n  Compute  bond  yield  from  a  known  price     n  Compute  bond  price  from  a  known  yield   n  Graph  the  price  v.  yield       n  Compute  bond  price  when  yield  is  not  known   n  Graph  price  v.    Time  to  maturity     n  Compute  mortgage  payments     ¨  Bond  price  quotes   2
  • 3.
    Bonds   ¨  Corpora-ons  and  government  en--es  can  raise  capital  by  selling  bonds     ¤  Long  term  liability  (accoun-ng)   ¤  Debt  capital  (finance)     ¨  The  bond  has     ¤  Principal,  par,  or  face  value:  F   ¤  Price:  P   ¤  Yield:  y    (actually  “yield  to  maturity”  and  the  discount  rate)     ¤  Maturity  date,  -me  to  maturity,  term,  or  tenor:  T   n  Date  at  which  the  bond  principal,  F,  is  returned  to  investors   ¤  In  the  case  of  a  coupon  bond    (as  opposed  to  a  zero  coupon  bond)   n  Coupon  rate:  c    (annual,  simple,  nominal  rate)     n  Annual  payment  frequency:  m;  or  period  Δt   n  In  the  U.S.  semiannual  coupons  is  typical:  m  =  2  or  Δt  =  .5   3
  • 4.
    Zero  Coupon  Bonds   ¨  ZCBs  do  not  pay  a  coupon   ¨  The  return  and    ‘yield’  (rate)  is  due  to  the  purchase  price  at   a  discount  to  face  value       ¨  U.S.  Treasury  bills  (T  –  bills)  are  zero  coupon  bonds   ¤  Time-­‐to-­‐maturity  at  issue  is  4,  13,  26,  52  weeks       ¤  Face  value  $100  to  $5,000,000   ¨  A  ZCB  yield  is  the  interest  rate,     and  the  discount  rate  denoted  z     4 F   P   t=0   t=T  
  • 5.
    Zero  Coupon  Bond   ¨  For  T  ≤  1  year:    where  z  is  the  annual  simple  rate  or  yield     ¨  For  T  >  1  year    where  z  is  the  annualized  effec-ve  rate  or  yield     If  a  bond  has  a  term  of  a  year  or  less,  simple  interest  is  used,  otherwise   compound  annual  interest  is  used  by  conven-on     T)z(1 F P ⋅+ = T z)(1 F P + = 5 F   P   t=0   t=T  
  • 6.
    Zero  Coupon  Bond  Example     ¨  The  face  value  is  $1000,  the  market  price  is  $850,  and  the  -me  to   maturity  is  3.5  years.    What  is  the  annualized  yield  ?               ¨  The  face  value  is  $1000,  the  market  price  is  $975,  and  the  -me-­‐to-­‐ maturity  is  0.5  years.  What  is  the  annualized  yield?       $850 = $1000 (1+z)3.5 z = $1000 $850 ! " # $ % & 1 3.5 −1= 4.753% $975= $1000 (1+0.5⋅z) z =2⋅ $1000 $975 −1 # $ % & ' (=5.128% 6 T)z(1 F P ⋅+ = T z)(1 F P + =
  • 7.
    Coupon  Bond     P    =   current   price     C  =  coupon  payment     F  =  face  or   par  value          t=0.0                                t=Δt                                                  t=2·∙Δt                                                                                                                t=M·∙Δt=T              i=0                                        i=1                                                          i=2                                                                                                                        i=M        t0=0.0                              t1=Δt                                                t2=2Δt                                                      tM=  M·∙Δt  =T 7
  • 8.
    Coupon  Payment     ¨  Bond  coupon  cash  flows,  C,  are  defined  by  a  nominal,  simple   coupon  rate,  c,  and  a  compounding  frequency  per  year,  m,  or   coupon  period  measured  in  years,  Δt   ¨  The  total  cash  flow  at  -me  ti,  CFi,  is  defined  as:   CFi $=$C$$$$$$$$for$$i<M CFM $=$C$+$F 8 $8.125    C .5t 1000$F %625.1c example tFc  C = =Δ = = Δ⋅⋅= %y1 2 y 1 %632.11 2 1.625% 1 y  rate,    coupon    Effective 2 2 =−⎟ ⎠ ⎞ ⎜ ⎝ ⎛ + =−⎟ ⎠ ⎞ ⎜ ⎝ ⎛ + T=num  of  years  (floa-ng)   N=num  of  years  (integer)     m=periods  per  year     In  this  course,  generally  M=NŸm     360=  30  Ÿ12  
  • 9.
    Coupon  Bond  Yield   ¨  Yield  to  maturity  is  the  actual  yield  achieved  for  a  coupon   bond  if     ¤  The  bond  is  held  to  maturity,  and     ¤  Each  coupon  payment  is  reinvested  at  a  rate  of  return  of  y  through   -me  T   n  The  risk  that  coupons  cannot  be  reinvented  at  a  rate  greater  than  or   equal  to  y  due  to  market  condi-ons  is  called  “reinvestment  risk”   ¨  The  yield  to  maturity  is  the  investor’s  expected  return  on   investment  and  is  thus  the  issuer’s  rate  cost   ¤  It’s  the  issuer’s  cost  of  debt,  kD,  for  the  bond   ¨  The  yield  reflects  both  the  -me  value  of  money  and  the   credit  worthiness  of  the  borrower   ¤  The  expected  variance  in  the  cash  flow  is  reflected  in  the  yield     9
  • 10.
    Bond  Price   ¨ The  discount  rate  y  is  the  yield  to  maturity  or  simply  the  yield   on  a  coupon  bond   ¨  It’s  an  internal  rate  of  return  that  sets  the  discounted  cash   flow  on  the  right  hand  side  to  the  market  price  of  the  bond,   P,  on  the  lek  hand  side   ∑= + = M 1i t i i )y(1 CF P∑= ⎟ ⎠ ⎞ ⎜ ⎝ ⎛ + = M 1i i i m y 1 FC P 10 y  is  the  nominal  annual  yield   to  maturity    in  this  formula   with  integer  periods     y  is  effec8ve  annual  yield  to   maturity  in  this  formula  with   discrete  real  -me  periods    
  • 11.
    ¨  For  a  frac-onal  ini-al  coupon  period:    t1  <  ∆t   Frac-onal  Ini-al  Time  Period   For  a  bond  with  semi-­‐annual  coupons,  assume  that  the  next  coupon  payment   is  in  3  months.    The  coupon  payments  occur  at       t0=0.0,    t1=0.25,      t2=0.75,    t3=1.25,  t4  =  1.75,    …                    i=0                                  i=1                                                          i=2                                                                                                                    i=M          t0=0.0                                    t1                                                t2=t1+Δt                                                            tM=  T C  =  coupon  payment     F  =  face  or   par  value     11
  • 12.
    Zero  Coupon  Bonds  Again     ¨  A  bond  dealer  can  split  a  coupon  bond  into  ZCBs   ¤  one  for  the  principal  and     ¤  one  for  each  coupon   ¤  This  is  called  ‘stripping’  the  bond   ¨  The  advantage  of  a  ZCB  is  that  there  is  no  reinvestment  risk   ¨  For  a  ZCB,  the  yield,  y,  is  the  zero  coupon  rate  denoted  as  z   12
  • 13.
    Bond  Equa-on  Applica-ons     ¨  Find  the  yield-­‐to-­‐maturity,  y,  from  a  known  market  price,  P   ¤  Solve  for  y  (nominal,  y,  or  effec-ve,  y  ‘bar’)             ¤  Solve  for  the  roots  of  a  nonlinear  equa-on   n  In  this  course  use  Excel    Goal  Seek   ¤  Example:  Compute  both  the  effec8ve  and  nominal  yield  for  a  bond   with  $1000  face  value,  current  market  price  of  $800,  coupon  rate  of   7%  paid  semiannually,  and  4.5  years  to  maturity.       ∑= + = M 1i t i i )y(1 CF P∑= ⎟ ⎠ ⎞ ⎜ ⎝ ⎛ + = M 1i i i m y 1 FC P 13
  • 14.
    Bond  Equa-on  Applica-ons   $1,000 F 7.00% c nominal 13.434% y effective   t CF DF DCF 0 $0 $0.00 0.5 $35 0.939 $32.86 1 $35 0.882 $30.85 1.5 $35 0.828 $28.97 2 $35 0.777 $27.20 2.5 $35 0.730 $25.54 3 $35 0.685 $23.98 3.5 $35 0.643 $22.51 4 $35 0.604 $21.14 4.5 $1,035 0.567 $586.94 Sum $1,315 P $800.00 13.011% y nominal t i   CF DF DCF 0 0 $0 $0.00 0.5 1 $35 0.939 $32.86 1 2 $35 0.882 $30.85 1.5 3 $35 0.828 $28.97 2 4 $35 0.777 $27.20 2.5 5 $35 0.730 $25.54 3 6 $35 0.685 $23.98 3.5 7 $35 0.643 $22.51 4 8 $35 0.604 $21.14 4.5 9 $1,035 0.567 $586.94 Sum $1,315 P $800.00 ∑= + = M 1i t i i )y(1 CF P ∑= ⎟ ⎠ ⎞ ⎜ ⎝ ⎛ + = M 1i i i m y 1 FC P 14
  • 15.
    Bond  Equa-on  Applica-ons   ¤  Convert  the  nominal  yield  to  the  effec-ve  yield           ¨  Find  market  price  from  a  known  yield   ¤  For  the  bond  in  the  last  example,  what  is  the  price?     n  Given  an  effec8ve  annual  yield  of  12%    or     n  A  nominal  annual  yield  of  12%   1 2 y 1y 1 2 %011.13 1%434.13 2 2 −⎟ ⎠ ⎞ ⎜ ⎝ ⎛ += −⎟ ⎠ ⎞ ⎜ ⎝ ⎛ += 15
  • 16.
    Bond  Equa-on  Applica-ons   $1,000 F 7.00% c nominal 12.000% y effective   t CF DF DCF 0 $0 $0.00 0.5 $35 0.945 $33.07 1 $35 0.893 $31.25 1.5 $35 0.844 $29.53 2 $35 0.797 $27.90 2.5 $35 0.753 $26.36 3 $35 0.712 $24.91 3.5 $35 0.673 $23.54 4 $35 0.636 $22.24 4.5 $1,035 0.601 $621.53 Sum $1,315 P $840.34 ∑= + = M 1i t i i )y(1 CF P 12.000% y nominal t i   CF DF DCF 0 0 $0 $0.00 0.5 1 $35 0.943 $33.02 1 2 $35 0.890 $31.15 1.5 3 $35 0.840 $29.39 2 4 $35 0.792 $27.72 2.5 5 $35 0.747 $26.15 3 6 $35 0.705 $24.67 3.5 7 $35 0.665 $23.28 4 8 $35 0.627 $21.96 4.5 9 $1,035 0.592 $612.61 Sum $1,315 P $829.96 ∑= ⎟ ⎠ ⎞ ⎜ ⎝ ⎛ + = M 1i i i m y 1 FC P 16
  • 17.
    Bond  Equa-on  Applica-ons   ¨  For  the  bond  with  a  12%  effec-ve  yield  and  price  $840.34   at  -me  0,  here’s  a  plot  of  price  as  -me  progress  from  0  to   4.5  years  assuming  a  constant  yield  of  12%   $825 $850 $875 $900 $925 $950 $975 $1,000 $1,025 $1,050 0.0 0.5 1.0 1.5 2.0 2.5 3.0 3.5 4.0 4.5 Time Price17
  • 18.
    Yield  Curve   ¨ A  graph  can  be  developed  that  plots  various  (annualized)   yields-­‐to-­‐maturity  against  -mes-­‐to-­‐maturity  for  bonds  from   the  same  issuing  en-ty  or  from  issuing  en--es  with  the  same   risk   y 0                                                                                                    T 18 Bloomberg     Animated  yield  curve  
  • 19.
    Yield  Curve   ¨ The  most  useful  version  of  the  yield  curve  plots  zero  coupon  bond  yields   against  -mes-­‐to-­‐maturity   ¨  A  zero  coupon  yield  curve  depicts  pure  interest  rates  with  no  ambiguity  in   the  risk  associated  with  the  yield   ¨  Thus  we  can  use  ZCB  yield  curve  to  plot  the  interest  rate  with  respect  to   -me-­‐to-­‐maturity,  or  holding  period   ¨  Yields  on  zero  coupon  U.S.  Treasury  debt  are  risk  free   ¨  The  addi-onal  yield  for  non-­‐U.S.  Treasury  debt  is  due  largely  to  credit  risk   and  is  called  a  risk  premium  or  a  credit  spread   ¨  Moody’s  and  Standard  &  Poor’s  evaluate  bond  credit  risk  via  analysis  of   the  issuer’s  financial  posi-on  and  assign  risk  levels  such  as  AA  that   translate  into  credit  risk  premiums   19
  • 20.
    Corporate  Credit  Ra-ng   From Investopedia 20 AAA companies
  • 21.
    Yield  Curve   ¨ A  corporate  bond,  say  a  AA  rated  bond,  might  have   the  following  yield  curve       y   0                                                                                                                                        T   AA  Corporate  Bond  Yield  Curve     U.S.  Treasury  Debt  Yield  Curve     risk  premium  and  credit  spread       21
  • 22.
    Other  Types  of  Risk   ¨  Another  type  of  risk  known  as  liquidity  risk   ¨  Results  from  a  bond  having  few  buyers  and  sellers   ¤  The  issue  is  “illiquid”     ¨  Newer  U.S.  Treasuries  (referred  to  as  “on  the  run”)   can  trade  with  a  liquidity  premium  compared  with   old  U.S.  Treasuries  (referred  to  as  “off  the  run”)     y  =  f(risk  free  -me  value  of  money,  credit  risk,   liquidity  risk)   22
  • 23.
    Reinvestment  Risk   ¨ Consider  a  $1000  bond  with  a  coupon  rate  of  10%  paid  annually  for  10  years.   Ini-ally,  the  yield  is  11%,  the  price  is  $941.11,  and  the  yield  curve  is  flat.  Prior  to   the  payment  of  the  next  coupon,  we  consider  three  scenarios   1.  the  yield  curve  shiks  parallel  down  to  9%   2.  the  yield  curve  remains  flat  at  11%   3.  the  yield  curve  shiks  parallel  up  to  12%   What  are  the  actual  yields?     $1,000 F 10.00% c nominal Year CF DF DCF 9% 11% 12% 11.00% y nominal 1 100$ 0.9009 90.09$ 217.19$ 255.80$ 277.31$ 2 100$ 0.8116 81.16$ 199.26$ 230.45$ 247.60$ 3 100$ 0.7312 73.12$ 182.80$ 207.62$ 221.07$ 4 100$ 0.6587 65.87$ 167.71$ 187.04$ 197.38$ 5 100$ 0.5935 59.35$ 153.86$ 168.51$ 176.23$ 6 100$ 0.5346 53.46$ 141.16$ 151.81$ 157.35$ 7 100$ 0.4817 48.17$ 129.50$ 136.76$ 140.49$ 8 100$ 0.4339 43.39$ 118.81$ 123.21$ 125.44$ 9 100$ 0.3909 39.09$ 109.00$ 111.00$ 112.00$ 10 1,100$ 0.3522 387.40$ 1,100.00$ 1,100.00$ 1,100.00$ Sum 941.11$ 2,519.29$ 2,672.20$ 2,754.87$ Yield To Maturity 10.35% 11.00% 11.34% Bond Price Calculation Future Value of Coupon Reinvestment 23
  • 24.
    Bond  Price  Quotes   ¨  Dirty  and  clean  prices       ¤  Dirty  price   n  Price  from  DCF  formula     n  Transac-on  price   n  When  the  seller  sells  at  this  price  she  gets  the  prorated  share   (accumulated  interest)  of  the  next  coupon   ¤  Clean  price   n  Price  quoted  by  bond  dealer   n  Excludes  accumulated  interest  on  next  coupon  payment   ¤  Clean  price  =  Dirty  price  –  accumulated  interest   n  Accumulated  as  simple  interest  using  applicable  day  count  conven-on     24
  • 25.
    Clean  and  Dirty  Bond  Prices     Bond  purchased  just  aker  its  8/15/2008  coupon       Bond  purchased  6/12/2009       From  8/15/08  to  8/15/09  is  365  days From  8/15/08  to  6/12/09  is  301  days  or  .825  yrs   From  6/12/09  to  8/15/09  is  64  days  or  .175  yrs     Payment   Date   t CF DF DCF 15-­‐Aug-­‐08 0 $0 1.000 $0.00 15-­‐Aug-­‐09 1 $5 0.962 $4.81 15-­‐Aug-­‐10 2 $5 0.925 $4.62 15-­‐Aug-­‐11 3 $5 0.889 $4.44 15-­‐Aug-­‐12 4 $5 0.855 $4.27 15-­‐Aug-­‐13 5 $5 0.822 $4.11 15-­‐Aug-­‐14 6 $105 0.790 $82.98 Sum $130.00 P $105.24 Payment   Date   t CF DF DCF 12-­‐Jun-­‐09 0 $0 1.000 $0.00 15-­‐Aug-­‐09 0.175 $5 0.993 $4.97 15-­‐Aug-­‐10 1.175 $5 0.955 $4.77 15-­‐Aug-­‐11 2.175 $5 0.918 $4.59 15-­‐Aug-­‐12 3.175 $5 0.883 $4.41 15-­‐Aug-­‐13 4.175 $5 0.849 $4.24 15-­‐Aug-­‐14 5.175 $105 0.816 $85.71 Sum $130.00 P $108.70 F=$100,  c=5%,  y=4%,  m=1   25
  • 26.
    $100 $101 $102 $103 $104 $105 $106 $107 $108 $109 $110 0.0 0.5 1.01.5 2.0 2.5 3.0 3.5 4.0 4.5 5.0 5.5 6.0 Time PriceDirty  and  Clean  Prices   15   Aug   2008   Clean  price  @  6/12/09  =  Dirty  price  –  accumulated  interest                  =  $108.70  –  $5  ·∙  301  /  365                        =  $108.70  -­‐  $4.12  =    $104.58   15   Aug   2009   26 12  June  2009  
  • 27.
    Bond  Price  Quotes   ¨  Bid  and  ask  prices     ¤  The  clean  price  is  quoted  for  bid  and  ask  prices   n  The  dealer  will  buy  a  bond  at  the  bid  price     n  The  dealer  will  sell  a  bond  at  the  ask  (offer)  price   ¨  Bond  prices  are  quoted  rela-ve  to  100  regardless  of   actual  par  value   ¤  Price  is  quoted  as  a  percent  of  par       ¨  Example   27
  • 28.
    Plot  price  v.  yields  to  maturity     $700 $800 $900 $1,000 $1,100 $1,200 $1,300 0% 2% 4% 6% 8% 10% 12% 14% 16% Yield Price F=$1000   c=7%  semiannual   T=4.5  yrs     Bond  “price  –  yield”  or  P-­‐y  curve   Illustrates  how  price  changes  as  yield-­‐to-­‐maturity  changes  for  a   par-cular  bond  (  c,  m,  M,  and  F  are  constant)   Each  point   represents  a   DCF  calcula-on   ∑= + = M 1i t i i )y(1 CF P 28
  • 29.
    Determine  the  fair  price  of  a  bond     ¨  In  this  case  c,  m,  T,  and  the  relevant  zero  coupon   yield  curve  are  known   ¨  Compute  the  fair  value,  P   ∑= + = M 1i t i i i )z(1 CF P zt   0                                      T  for  zero  coupon  bonds   ti  for  bond  cash  flows   CFt   Cash  flow  diagram   Zero  coupon  bond  yield  curve   29
  • 30.
    Example  of  pricing  a  bond       Price of the bond F=$1000   c=7%  semiannual   T=4.5  yrs   With  the  following  zero  coupon  yield  curve $1,000 F t CF z DF DCF 7.00% c  nominal 0 $0 4.00% $0.00 0.5 $35 4.85% 0.977 $34.18 1 $35 5.20% 0.951 $33.27 1.5 $35 5.47% 0.923 $32.31 2 $35 5.70% 0.895 $31.33 2.5 $35 5.90% 0.867 $30.33 3 $35 6.08% 0.838 $29.32 3.5 $35 6.24% 0.809 $28.31 4 $35 6.40% 0.780 $27.31 4.5 $1,035 6.55% 0.752 $778.09 Sum $1,315 P $1,024.46 0% 1% 2% 3% 4% 5% 6% 7% 0 0.5 1 1.5 2 2.5 3 3.5 4 4.5 t z 30
  • 31.
    Home  Mortgage  Calcula-on     ¨  Given  the  nominal  interest  rate,  m=12,  P,  and  N,   what  is  the  monthly  payment,  C?     ¨  C  :    monthly  payment   ¤  Includes  principal  repayment  and  interest  –     there  is  no  return  of  principal  “F”   ¨  N  :  number  of  years   ¨  m  :  number  of  compounding  periods  per  year  (12  for  home  loans)   ¨  y  :  nominal  fixed  interest  rate  for  the  loan   ¨  P  :  loan  principal  (the  mortgage  amount)     ¨  Solve  for  C  using  Excel  Goal  Seek     ¤  Find  the  value  of  C  that  equates  the  lek  and  right  hand  sides     ∑= ⎟ ⎠ ⎞ ⎜ ⎝ ⎛ + = M 1i i i m y 1 C P 31
  • 32.
    Mortgage  Example     ¨  You  wish  to  borrow  $300,000  at  6.5%  fixed  for  30  years.       ¨  The  following  excel  table  shows  the  calcula-ons  for  the  first   12  months  and  the  last  5  months.       ¨  The  monthly  payment  of  $1896  is  determined  using  goal  seek   to  force  the  sum  of  the  last  column  to  $300,000.       ¨  Note  that  you  will  pay  out  $682,633  in  principal  and  interest   ¤  $300,000  in  principal     ¤  $382,633  in  interest     32
  • 33.
    Mortgage  Example     t i   CF DF DCF 0.000 0 -­‐$                       -­‐$                       0.083 1 1,896$               0.995 1,886$               0.167 2 1,896$               0.989 1,876$               0.250 3 1,896$               0.984 1,866$               0.333 4 1,896$               0.979 1,856$               0.417 5 1,896$               0.973 1,846$               0.500 6 1,896$               0.968 1,836$               0.583 7 1,896$               0.963 1,826$               0.667 8 1,896$               0.958 1,816$               0.750 9 1,896$               0.953 1,806$               0.833 10 1,896$               0.947 1,796$               0.917 11 1,896$               0.942 1,787$               1.000 12 1,896$               0.937 1,777$               29.667 356 1,896$               0.146 277$                     29.750 357 1,896$               0.145 276$                     29.833 358 1,896$               0.145 274$                     29.917 359 1,896$               0.144 273$                     30.000 360 1,896$               0.143 271$                     Sum 682,633$     P 300,000$     ∑= ⎟ ⎠ ⎞ ⎜ ⎝ ⎛ + = M 1i i i m y 1 C P $300,000 P 6.500% y  nominal 12 m 6.697% y  annual  effective 0.542% y  monthly  effective 33
  • 34.
    Perpetuity       34 Now  in  the  case  that     M=∞   C  is  constant           and  of  course  y  <  1             This  is  a  perpetuity   ⎟ ⎠ ⎞ ⎜ ⎝ ⎛ = m y C P P= Ci (1+y)i i=1 M ∑ P=C⋅ 1 (1+y)i i=1 ∞ ∑ P= C y P= C y P= Ci (1+y)i i=1 M ∑ If  a  nominal  annual  rate,  y,   is  used  then   P   C   i   Example:    How  much  money  do  you  need  to  invest,  P,  to  pay  out  $1  per   year  forever  if  the  pay  out  rate  is  10%  (effec-ve)  per  year?    
  • 35.
    Annuity     35 Now  how  much  money  do  you  need  to  invest  at   10%  to  receive  a  $1  /  year  payout  for  M  years  ?       That’s  an  annuity  (a  perpetuity  would  pay  out   forever)    P   C   i                                                                                    M      M+1   PM+1 = C y P0 M+1 = C y ⋅ 1 1+y( ) M = C y ⋅ 1+y( ) −M P = P0 = C y − C y ⋅ 1+y( ) −M = C y ⋅ 1− 1+y( ) −M# $ % & ' ( P= C y ⋅ 1& 1+y( ) &M" # $ % & ' C = P⋅ y 1& 1+y( ) &M = P⋅ y⋅ 1+y( ) M 1+y( ) M −1 P= C⋅m y ⋅ 1' 1+ y m " # $ % & ' 'M( ) * * + , - - C= P⋅ y m " # $ % & '⋅ 1+ y m " # $ % & ' M 1+ y m " # $ % & ' M '1 M=20  years   C=$1   Y=10%   P=$8.51  
  • 36.
  • 37.
    Closed  Form  Formulas   ¨  Annuity     ¤  Home  mortgage  annuity  formula  example   ¨  Bonds   ¤  Annuity  for  coupon  payment  plus  the  discounted  face   value             20.1896$ 1)%542.0(1 0.542%)(1  0.542%$300,000 C 360 360 =⎟⎟ ⎠ ⎞ ⎜⎜ ⎝ ⎛ −+ +⋅⋅ = MM m y 1 F m y 1 m y 1 m y 1 CP ⎟ ⎠ ⎞ ⎜ ⎝ ⎛ + + ⎟⎟ ⎟ ⎟ ⎟ ⎠ ⎞ ⎜⎜ ⎜ ⎜ ⎜ ⎝ ⎛ ⎟ ⎠ ⎞ ⎜ ⎝ ⎛ +⎟ ⎠ ⎞ ⎜ ⎝ ⎛ − ⎟ ⎠ ⎞ ⎜ ⎝ ⎛ ⋅= 37
  • 38.
    Closed  Form  Formulas   ¨  Bonds   ¤  Example  of  bond  w/  F=$1000,  c=7%  semi-­‐annual,   T=4.5yrs,  y  annual  nominal  =  13.011%                         ¤  Bond  with  frac-onal  ini-al  period             00.800$ 2 y 1 $1000 2 13.011% 1 2 13.011% 1 2 13.011% 1 35$P 99 = ⎟ ⎠ ⎞ ⎜ ⎝ ⎛ + + ⎟⎟ ⎟ ⎟ ⎟ ⎠ ⎞ ⎜⎜ ⎜ ⎜ ⎜ ⎝ ⎛ ⎟ ⎠ ⎞ ⎜ ⎝ ⎛ +⎟ ⎠ ⎞ ⎜ ⎝ ⎛ − ⎟ ⎠ ⎞ ⎜ ⎝ ⎛ ⋅= ⎟ ⎟ ⎟ ⎟ ⎟ ⎠ ⎞ ⎜ ⎜ ⎜ ⎜ ⎜ ⎝ ⎛ ⎟ ⎠ ⎞ ⎜ ⎝ ⎛ +⎥ ⎥ ⎥ ⎥ ⎦ ⎤ ⎢ ⎢ ⎢ ⎢ ⎣ ⎡ ⎟ ⎠ ⎞ ⎜ ⎝ ⎛ + + ⎟⎟ ⎟ ⎟ ⎟ ⎠ ⎞ ⎜⎜ ⎜ ⎜ ⎜ ⎝ ⎛ ⎟ ⎠ ⎞ ⎜ ⎝ ⎛ +⋅⎟ ⎠ ⎞ ⎜ ⎝ ⎛ − ⎟ ⎠ ⎞ ⎜ ⎝ ⎛ +⋅= d eMM m y 1 1 m y 1 F m y 1 m y 1 m y 1 1CP 38
  • 39.
    Closed  Form  Formulas   .825              .175   last  coupon   next  coupon e=64  days        d  =  365  days   e/d=.175   8/15/08                            8/15/09                    8/15/10                    8/15/11                          8/15/12                      8/15/13              8/15/14                                      6/12/09   F=$100   y=4%  annual   c=5%  annual   y  &  c    are  effec-ve  &  nominal   Clean and Dirty Price example (p. 7.10) using closed form $100 $101 $102 $103 $104 $105 $106 $107 $108 $109 $110 0.0 0.5 1.0 1.5 2.0 2.5 3.0 3.5 4.0 4.5 5.0 5.5 6.0 Time Price 39 70.108$ )%4(1 1 )%4(1 $100 )%44%(1 1 4% 1 15$P 365 6455 = ⎟ ⎟ ⎠ ⎞ ⎜ ⎜ ⎝ ⎛ + ⎟⎟ ⎠ ⎞ ⎜⎜ ⎝ ⎛ + +⎟ ⎠ ⎞ ⎜ ⎝ ⎛ + −+⋅=