Download to read offline


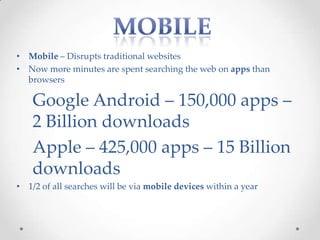
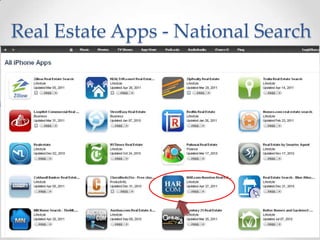
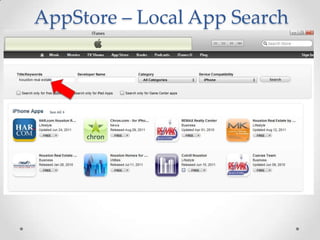


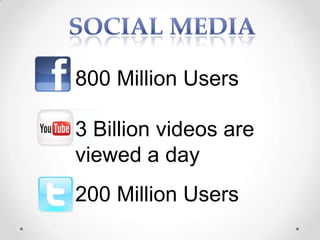


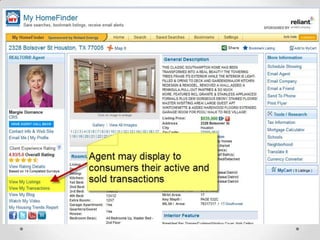

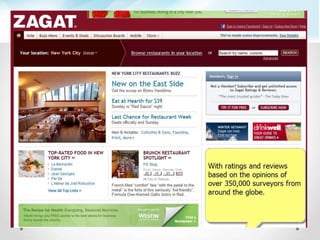

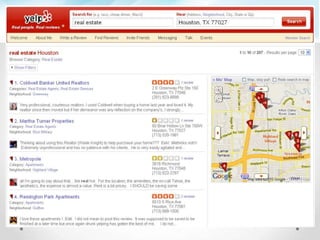


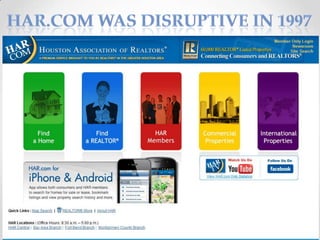


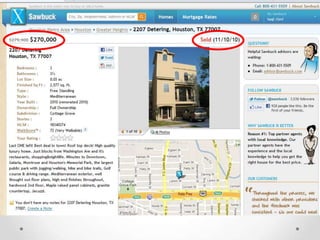


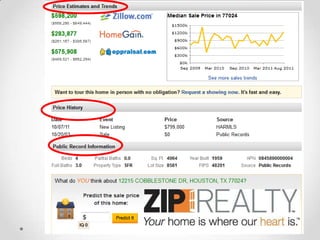
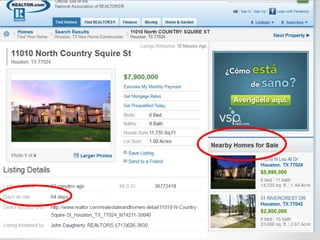

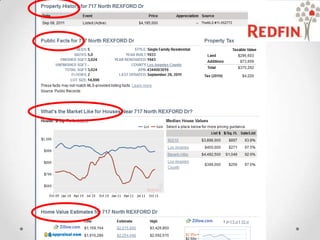
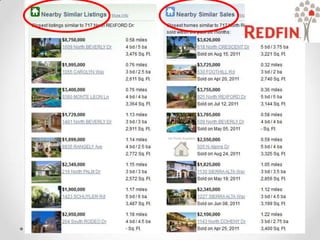
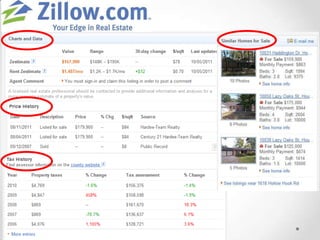
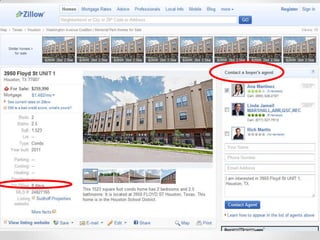
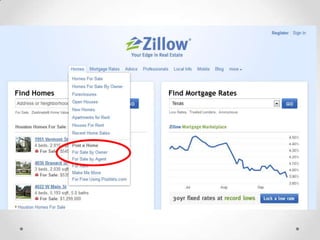
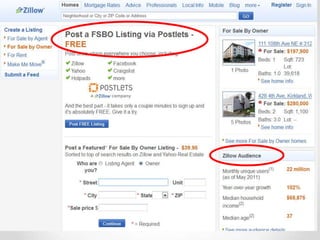


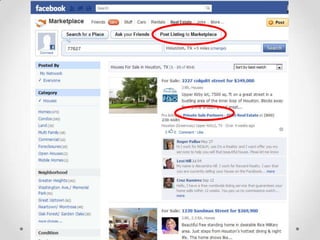
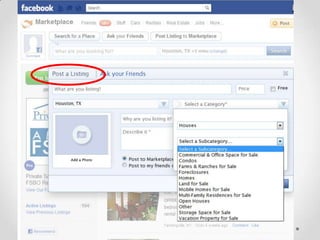
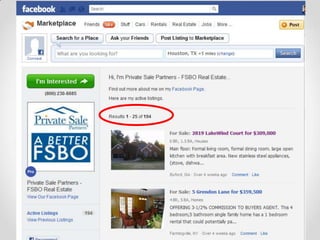


The document discusses disruptive innovation in the real estate market, highlighting how new technologies and platforms, like Airbnb and Zillow, are reshaping consumer access to property information and services. It details the rise of mobile apps and social media in facilitating real estate transactions and the changing dynamics for traditional agents and companies. By providing transparency and consumer-desired information, these disruptors challenge established competitors and redefine market practices.


