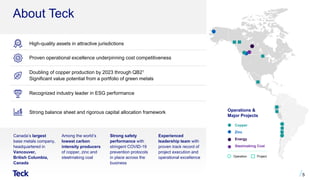
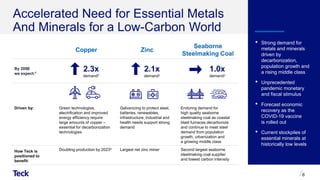
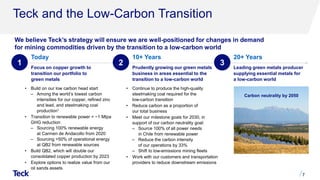
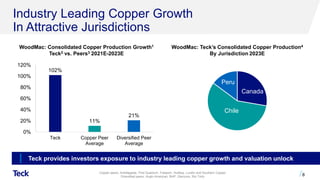
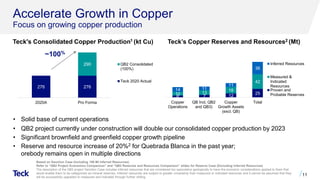
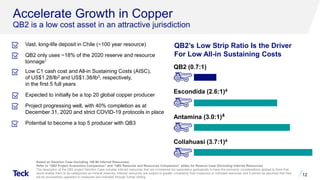
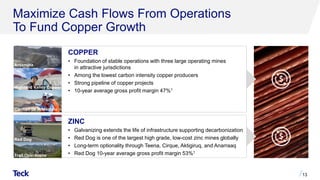
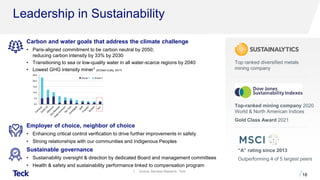
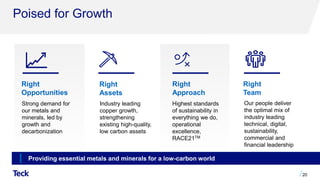
Global Metals & Mining
Conference
March 1, 2021
Don Lindsay
President and Chief Executive Officer
Caution Regarding Forward-Looking Statements
2
Both these slides and the accompanying oral presentations contain certain forward-looking statements within the meaning of the United States Private Securities Litigation Reform Act of 1995 and forward-looking information within the meaning of the
Securities Act (Ontario) and comparable legislation in other provinces (collectively referred to herein as forward-looking statements). Forward-looking statements can be identified by the use of words such as “plans”, “expects” or “does not expect”, “is
expected”, “budget”, “scheduled”, “estimates”, “forecasts”, “intends”, “anticipates” or “does not anticipate”, or “believes”, or variation of such words and phrases or state that certain actions, events or results “may”, “could”, “should”, “would”, “might” or
“will” be taken, occur or be achieved. Forward-looking statements involve known and unknown risks, uncertainties and other factors which may cause the actual results, performance or achievements of Teck to be materially different from any future
results, performance or achievements expressed or implied by the forward-looking statements. These statements speak only as of the original date of this presentation.
These forward-looking statements include, but are not limited to, statements concerning: the potential impact of the COVID-19 on our business and operations, including our ability to continue operations at our sites; our ability to manage challenges
presented by COVID-19; our long-term strategy, including but not limited to copper growth strategy; doubling of copper production by 2023 through QB2; all expectations regarding future copper, zinc and steelmaking coal demand and how Teck is
positioned to benefit; Teck’s strategy ensuring we ae well-positioned for changes in demand for commodities; is well positioned for the low-carbon economy; our goal of carbon neutrality and the steps to achieve that goal; expectations of copper
production growth; our green metals growth strategy and the components of that strategy, including but not limited to accelerating growth in copper, and maximizing cash flow from operations to fund copper growth; all projections and forecasts about
QB2 and QB3 or based on QB2 or QB3, including but not limited to copper growth, C1 cash costs and AISC costs, strip ratio, throughput rate and potential to become a top five global copper producer; reserve and resource estimates; long-term zinc
optionality, and including those set out in the “Quebrada Blanca” Appendix; impact of commodity price change on annualized EBITDA and annualized profit; liquidity and availability of borrowings under our credit facilities and the QB2 project finance
facility; objectives and components of Teck's capital allocation framework, including a base dividend and potential supplemental shareholder distribution and maintenance of solid investment grade metrics; sustainability goals; statement we are
poised for growth; expectation that QB2 will be a long-life, low-cost operation with significant expansion potential, the impact of QB2 on Teck’s portfolio balance and QB; QB2 capital estimate and estimated COVID-19 impacts on costs at QB2; timing
of first production at QB2; growth options and opportunities in copper, zinc and steelmaking coal; all guidance appearing in this document including but not limited to the production, sales, cost, unit cost, capital expenditure, cost reduction and other
guidance; climate action goals and the expectation that we will achieve these goals; water management goals and expectation that we will achieve those goals; Elk Valley water treatment projections; benefits and impact of our RACE21TM program;
long term annual steelmaking coal production of 26 to 27 million tonnes, and expectations of stable long term strip ratio; benefits of the Neptune facility upgrade and cost and timing expectations; expectation of strong long-term cash flows in
steelmaking coal; expectation of restructuring our cost base in our steelmaking coal business unit; projected steelmaking coal sustaining capital; long-term sustaining capital expenditure projection in copper; long-term sustaining capital expenditure
projection in zinc; expectations for Red Dog extension; Fort Hills debottlenecking potential; expectation of sufficient pipeline capacity for our energy business; the benefits of our innovation strategy and initiatives described under the “Technology and
Innovation” Appendix and elsewhere; mine lives and duration of operations at our various mines and operations; expectations and forecasts for our products, business units and individual operations and projects; and forecasts for supply and
demand for copper, zinc, steelmaking coal and oil.
The forward-looking statements are based on and involve numerous assumptions, risks and uncertainties and actual results may vary materially. These statements are based on assumptions, including, but not limited to, general business and
economic conditions, interest rates, the supply and demand for, deliveries of, and the level and volatility of prices of, zinc, copper, coal, blended bitumen, and other primary metals, minerals and products as well as steel, oil, natural gas, petroleum,
and related products, the timing of the receipt of regulatory and governmental approvals for our development projects and other operations and new technologies, our costs of production and production and productivity levels, as well as those of our
competitors, power prices, continuing availability of water and power resources for our operations, market competition, the accuracy of our reserve estimates (including with respect to size, grade and recoverability) and the geological, operational
and price assumptions on which these are based, conditions in financial markets, the future financial performance of the company, our ability to successfully implement our technology and innovation strategy, the performance of new technologies in
accordance with our expectations, our ability to attract and retain skilled staff, our ability to procure equipment and operating supplies, positive results from the studies on our expansion projects, our coal and other product inventories, our ability to
secure adequate transportation for our products, our ability to obtain permits for our operations and expansions, our ongoing relations with our employees and business partners and joint venturers, our expectations with respect to the carbon
intensity of our operations, assumptions regarding returns of cash to shareholders include assumptions regarding our future business and prospects, other uses for cash or retaining cash. Our sustainability goals are based on a number of additional
assumptions, including regarding the availability and effectiveness of technologies needed to achieve our sustainability goals and priorities; the availability of clean energy sources and zero-emissions alternatives for transportation on reasonable
terms; our ability to implement new source control or mine design strategies and transition to seawater or low-quality water on commercially reasonable terms without impacting production objectives; our ability to successfully implement our
technology and innovation strategy; and the performance of new technologies in accordance with our expectations. In addition, assumptions regarding the Elk Valley Water Quality Plan include assumptions that additional treatment will be effective at
scale, and that the technology and facilities operate as expected. Reserve and resource life estimates assume the mine life of longest lived resource in the relevant commodity is achieved, assumes production at planned rates and in some cases
development of as yet undeveloped projects. Assumptions regarding the benefits of the Neptune Bulk Terminals expansion and other projects include assumptions that the project is constructed and operated in accordance with current expectations.
Capital allocation decisions, and decisions regarding the payment of dividends, are in the discretion of the board of directors. Assumptions regarding QB2 include assumption of completion based on current project assumptions and assumptions
regarding the final feasibility study; assumptions regarding QB3 include assumptions regarding the receipt of permits. Assumptions regarding QB2 include current project assumptions and assumptions regarding the final feasibility study, CLP/USD
exchange rate of 775, as well as there being no unexpected material and negative impact to the various contractors, suppliers and subcontractors for the QB2 project relating to COVID-19 or otherwise that would impair their ability to provide goods
and services as anticipated during the suspension period or ramp-up of construction activities. Assumptions regarding the benefits of the Neptune Bulk Terminals expansion include assumptions that the project is constructed and operated in
accordance with current expectations. Statements regarding the availability of our credit facilities and project financing facility are based on assumptions that we will be able to satisfy the conditions for borrowing at the time of a borrowing request and
that the facilities are not otherwise terminated or accelerated due to an event of default. Statements concerning future production costs or volumes are based on numerous assumptions of management regarding operating matters and on
assumptions that demand for products develops as anticipated, that customers and other counterparties perform their contractual obligations, that operating and capital plans will not be disrupted by issues such as mechanical failure,
Caution Regarding Forward-Looking Statements
3
unavailability of parts and supplies, labour disturbances, interruption in transportation or utilities, adverse weather conditions, and that there are no material unanticipated variations in the cost of energy or supplies. Statements regarding anticipated
steelmaking coal sales volumes and average steelmaking coal prices depend on, among other things, timely arrival of vessels and performance of our steelmaking coal-loading facilities, as well as the level of spot pricing sales. The foregoing list of
assumptions is not exhaustive. Events or circumstances could cause actual results to vary materially. Assumptions are also included in the footnotes to the slides.
Factors that may cause actual results to vary materially include, but are not limited to: extended COVID-19 related suspension of activities and negative impacts on our suppliers, contractors, employees and customers; extended delays in return to
normal operations due to COVID-19 related challenges; changes in commodity and power prices, changes in market demand for our products; changes in interest and currency exchange rates; acts of governments and the outcome of legal
proceedings; inaccurate geological and metallurgical assumptions (including with respect to the size, grade and recoverability of mineral reserves and resources); unanticipated operational difficulties (including failure of plant, equipment or
processes to operate in accordance with specifications or expectations, cost escalation, unavailability of materials and equipment, government action or delays in the receipt of government approvals, industrial disturbances or other job action,
adverse weather conditions and unanticipated events related to health, safety and environmental matters); union labour disputes; political risk; social unrest; failure of customers or counterparties (including logistics suppliers) to perform their
contractual obligations; changes in our credit ratings; unanticipated increases in costs to construct our development projects, difficulty in obtaining or retaining permits; inability to address concerns regarding permits or environmental impact
assessments; current and new technologies relating to our Elk Valley water treatment efforts and other sustainability goals and targets may not perform as anticipated or may not be available, and ongoing monitoring may reveal unexpected
environmental conditions requiring additional remedial measures; and changes or further deterioration in general economic conditions. Development of future reserves and resources is dependent on, among other factors, receipt of permits. Current
and new technologies relating to our Elk Valley water treatment efforts may not perform as anticipated, and ongoing monitoring may reveal unexpected environmental conditions requiring additional remedial measures. QB2 costs, construction
progress and timing of first production is dependent on, among other matters, our continued ability to successfully manage through the impacts of COVID-19. QB2 costs may also be affected by claims and other proceedings that might be brought
against us relating to costs and impacts of the COVID-19 pandemic. Red Dog production may also be impacted by water levels at site.
The forward-looking statements in this presentation and actual results will also be impacted by the effects of COVID-19 and related matters. The overall effects of COVID-19 related matters on our business and operations and projects will depend on
how the ability of our sites to maintain normal operations, and on the duration of impacts on our suppliers, customers and markets for our products, all of which are unknown at this time. Continuing operating activities is highly dependent on the
progression of the pandemic and the success of measures taken to prevent transmission, which will influence when health and government authorities remove various restrictions on business activities.
We assume no obligation to update forward-looking statements except as required under securities laws. Further information concerning risks and uncertainties associated with these forward-looking statements and our business can be found in our
Annual Information Form for the year ended December 31, 2020, filed under our profile on SEDAR (www.sedar.com) and on EDGAR (www.sec.gov) under cover of Form 40-F, as well as subsequent filings. Please see our 2020 annual
management’s discussion and analysis dated February 17, 2020 for further information concerning the guidance and other forward looking statements in this presentation.
QB2 Project Disclosure
All economic analysis with respect to the QB2 project based on a development case which includes inferred resources within the life of mine plan, referred to as the Sanction Case, which is the case on which Teck based its development decision for
the QB2 project. Inferred resources are considered too speculative geologically to have the economic considerations applied to them that would enable them to be categorized as mineral reserves. Inferred resources are subject to greater uncertainty
than measured or indicated resources and it cannot be assumed that they will be successfully upgraded to measured and indicated through further drilling. Nonetheless, based on the nature of the mineralization, Teck has used a mine plan including
inferred resources as the development mine plan for the QB2 project.
The economic analysis of the Sanction Case, which includes inferred resources, may be compared to economic analysis regarding a hypothetical mine plan which does not include the use of inferred resources as mill feed, referred to as the Reserve
Case, and which is set out in Appendix slides “QB2 Project Economics Comparison” and “QB2 Reserves and Resources Comparison”.
The scientific and technical information regarding the QB2 project and Teck's other material properties was prepared under the supervision of Rodrigo Marinho, P. Geo, who is an employee of Teck. Mr. Marinho is a qualified person, as defined under
National Instrument 43-101.
Overview
A Focused Strategy
Poised for Growth
High-quality assets in attractive jurisdictions
Proven operational excellence underpinning cost competitiveness
Doubling of copper production by 2023 through QB21
Significant value potential from a portfolio of green metals
Recognized industry leader in ESG performance
Strong balance sheet and rigorous capital allocation framework
5
Strong safety
performance with
stringent COVID-19
prevention protocols
in place across the
business
Among the world’s
lowest carbon
intensity producers
of copper, zinc and
steelmaking coal
Experienced
leadership team with
proven track record of
project execution and
operational excellence
Canada’s largest
base metals company,
headquartered in
Vancouver,
British Columbia,
Canada
Operations &
Major Projects
Copper
Zinc
Energy
Steelmaking Coal
Operation Project
About Teck
Copper Zinc
Seaborne
Steelmaking Coal
By 2050
we expect:1
2.3x
demand2
2.1x
demand2
1.0x
demand3
Driven by: Green technologies,
electrification and improved
energy efficiency require
large amounts of copper –
essential for decarbonization
technologies
Galvanizing to protect steel,
batteries, renewables,
infrastructure, industrial and
health needs support strong
demand
Enduring demand for
high quality seaborne
steelmaking coal as coastal
blast furnaces decarbonize
and continue to meet steel
demand from population
growth, urbanization and
a growing middle class
How Teck is
positioned to
benefit:
Doubling production by 20234 Largest net zinc miner Second largest seaborne
steelmaking coal supplier
and lowest carbon intensity
6
• Strong demand for
metals and minerals
driven by
decarbonization,
population growth and
a rising middle class
• Unprecedented
pandemic monetary
and fiscal stimulus
• Forecast economic
recovery as the
COVID-19 vaccine
is rolled out
• Current stockpiles of
essential minerals at
historically low levels
Accelerated Need for Essential Metals
And Minerals for a Low-Carbon World
Teck and the Low-Carbon Transition
7
We believe Teck’s strategy will ensure we are well-positioned for changes in demand
for mining commodities driven by the transition to a low-carbon world
• Build on our low carbon head start
‒ Among the world’s lowest carbon
intensities for our copper, refined zinc
and lead, and steelmaking coal
production1
• Transition to renewable power = ~1 Mtpa
GHG reduction
‒ Sourcing 100% renewable energy
at Carmen de Andacollo from 2020
‒ Sourcing >50% of operational energy
at QB2 from renewable sources
• Build QB2, which will double our
consolidated copper production by 2023
• Explore options to realize value from our
oil sands assets
• Continue to produce the high-quality
steelmaking coal required for the
low-carbon transition
• Reduce carbon as a proportion of
our total business
• Meet our milestone goals for 2030, in
support of our carbon neutrality goal:
‒ Source 100% of all power needs
in Chile from renewable power
‒ Reduce the carbon intensity
of our operations by 33%
‒ Shift to low-emissions mining fleets
• Work with our customers and transportation
providers to reduce downstream emissions
Carbon neutrality by 2050
1
Today
Focus on copper growth to
transition our portfolio to
green metals
2
10+ Years
Prudently growing our green metals
business in areas essential to the
transition to a low-carbon world
3
20+ Years
Leading green metals producer
supplying essential metals for
a low-carbon world
Industry Leading Copper Growth
In Attractive Jurisdictions
8
WoodMac: Consolidated Copper Production Growth1
Teck2 vs. Peers3 2021E-2023E
WoodMac: Teck’s Consolidated Copper Production4
By Jurisdiction 2023E
Canada
156 kt
Peru
86 kt
Chile
227 kt
Copper peers: Antofagasta, First Quantum, Freeport, Hudbay, Lundin and Southern Copper.
Diversified peers: Anglo American, BHP, Glencore, Rio Tinto.
Teck provides investors exposure to industry leading copper growth and valuation unlock
102%
11%
21%
0%
20%
40%
60%
80%
100%
120%
Teck Copper Peer
Average
Diversified Peer
Average
Canada
Chile
Peru
Overview
A Focused Strategy
Poised for Growth
Prudent Green Metals Growth Strategy
10
Canada
156 kt
Peru
86 kt
Chile
227 kt
Accelerate
growth in copper
Maximize
cash flows from operations to fund copper growth
Strengthen
existing high-quality assets through RACE21TM
Discipline
in capital allocation
Leadership
in sustainability
276 276
290
2020A Pro Forma
QB2 Consolidated
(100%)
Teck 2020 Actual
Teck's Consolidated Copper Production1 (kt Cu)
Accelerate Growth in Copper
Focus on growing copper production
11
• Solid base of current operations
• QB2 project currently under construction will double our consolidated copper production by 2023
• Significant brownfield and greenfield copper growth pipeline
• Reserve and resource increase of 20%2 for Quebrada Blanca in the past year;
orebody remains open in multiple directions
~100%
Teck’s Copper Reserves and Resources2 (Mt)
Based on Sanction Case (Including 199 Mt Inferred Resources)
Refer to “QB2 Project Economics Comparison” and “QB2 Reserves and Resources Comparison” slides for Reserve Case (Excluding Inferred Resources)
The description of the QB2 project Sanction Case includes inferred resources that are considered too speculative geologically to have the economic considerations applied to them that
would enable them to be categorized as mineral reserves. Inferred resources are subject to greater uncertainty than measured or indicated resources and it cannot be assumed that they
will be successfully upgraded to measured and indicated through further drilling.
6 7 12
25
10 13
18
42
14 11
11
36
Copper
Operations
QB Incl, QB2
and QB3)
Copper
Growth Assets
(excl. QB)
Total
Inferred Resources
Measured &
Indicated
Resources
Proven and
Probable Reserves
Accelerate Growth in Copper
QB2 is a low cost asset in an attractive jurisdiction
12
QB2’s Low Strip Ratio Is the Driver
For Low All-in Sustaining Costs
Vast, long-life deposit in Chile (~100 year resource)
QB2 only uses ~18% of the 2020 reserve and resource
tonnage1
Low C1 cash cost and All-in Sustaining Costs (AISC),
of US$1.28/lb2 and US$1.38/lb3, respectively,
in the first 5 full years
Expected to initially be a top 20 global copper producer
Project progressing well, with 40% completion as at
December 31, 2020 and strict COVID-19 protocols in place
Potential to become a top 5 producer with QB3
QB2 (0.7:1)
Antamina (3.0:1)4
Collahuasi (3.7:1)4
Escondida (2.6:1)4
Based on Sanction Case (Including 199 Mt Inferred Resources)
Refer to “QB2 Project Economics Comparison” and “QB2 Reserves and Resources Comparison” slides for Reserve Case (Excluding Inferred Resources)
The description of the QB2 project Sanction Case includes inferred resources that are considered too speculative geologically to have the economic considerations applied to them that
would enable them to be categorized as mineral reserves. Inferred resources are subject to greater uncertainty than measured or indicated resources and it cannot be assumed that they
will be successfully upgraded to measured and indicated through further drilling.
COPPER
• Foundation of stable operations with three large operating mines
in attractive jurisdictions
• Among the lowest carbon intensity copper producers
• Strong pipeline of copper projects
• 10-year average gross profit margin 47%1
Maximize Cash Flows From Operations
To Fund Copper Growth
13
Antamina
Highland Valley Copper
Carmen de Andacollo
ZINC
• Galvanizing extends the life of infrastructure supporting decarbonization
• Red Dog is one of the largest high grade, low-cost zinc mines globally
• Long-term optionality through Teena, Cirque, Aktigiruq, and Anarraaq
• Red Dog 10-year average gross profit margin 53%1
Red Dog
Trail Operations
Maximize Cash Flows From Operations
To Fund Copper Growth
14
STEELMAKING COAL
• Foundation of stable operations with four
operating mines in the Elk Valley, BC
• Growing margins, not volume
• Cost base restructuring is near completion
• Enhanced logistics chain to strengthen
long-term, low-cost and reliable supply chain
• One of the lowest carbon intensity producers
of high quality hard coking coal
• Significant leverage to rising steelmaking coal
prices, with a US$50/tonne increase having a
~C$1.5 billion1 effect on annualized EBITDA
• 10-year average gross profit margin 49%2
Steelmaking Coal Prices3 (US$/t)
Strong coal fundamentals underpinned by global economic recovery
Since January 1, 2011, the FOB Australia price has averaged
~US$170/t, or ~US$180/t on an inflation-adjusted basis
0
50
100
150
200
250
Jan-20
Feb-20
Mar-20
Apr-20
May-20
Jun-20
Jul-20
Aug-20
Sep-20
Oct-20
Nov-20
Dec-20
Jan-21
Feb-21
Chinese Domestic CFR Equivalent
CFR China
FOB Australia
Strengthen Existing High-Quality Assets
Through RACE21TM
15
Transformational
safety impact
Step-change impact to
operational efficiency
Increased productivity
through technology and
innovation
Increased margins
Advanced data analytics
and artificial intelligence to
reduce risk of heavy vehicle
/ light vehicle interactions
Increased copper
throughput by ~7% and
recovery by ~2% at
Highland Valley Copper
Record haul truck
productivities at our coal
sites, up 0.5% versus
same period last year
Improved zinc feed
margins by $5 per tonne
processed at our
Trail Operations
RACE21TM is driving operational improvements and transforming our business
through technology and innovation
Focus
Examples
Discipline in Capital Allocation
QB2 funding secured; long-dated maturity profile provides optionality
No significant note maturities prior to 20304 (C$M)
16
Balance Sheet
• Rated investment grade by all four agencies
Liquidity
• C$6.5 billion of liquidity available1
• US$5.0 billion of committed revolving credit facilities
• No earnings or cash-flow based financial covenant,
no credit rating trigger, no general material adverse
effect borrowing condition
Mid-Point
2021 Production
Guidance6
Change
Estimated Effect on
Annualized EBITDA7
Copper 282.5 kt US$0.50/lb C$400M
Zinc8 902.5 kt US$0.10/lb C$120M
Coal 26.0 Mt US$50/t C$1,500M
Significant leverage to rising commodity prices5
Financial Highlights
$10.9 billion
five-year average
annual revenues2
$4.3 billion
five-year average annual
Adjusted EBITDA2,3
Prudent QB2 Project Funding
~US$1.1 billion4 drawn on US$2.5 billion project finance facility
0
500
1,000
2021
2022
2023
2024
2025
2026
2027
2028
2029
2030
2031
2032
2033
2034
2035
2036
2037
2038
2039
2040
2041
2042
2043
Discipline in Capital Allocation
A transparent framework, rigorously applied
17
BASE
DIVIDEND
COMMITTED
GROWTH
CAPITAL
CAPITAL
STRUCTURE
SUSTAINING
CAPITAL
(including stripping)
SUPPLEMENTAL
SHAREHOLDER
DISTRIBUTIONS
Plus at Least 30%
Available Cash Flow1
Additional cash
returns to shareholders
Build on C$6.8 billion2 of
dividends and share
buybacks since 2003
Further green metals
growth opportunities
No growth in carbon
assets
1. For this purpose, we define available cash flow as cash flow from operating activities after interest and finance charges, lease payments and distributions to non-controlling interests
less: (i) sustaining capital and capitalized stripping; (ii) committed growth capital; (iii) any cash required to adjust the capital structure to maintain solid investment grade credit metrics;
and (iv) our base $0.20 per share annual dividend. Proceeds from any asset sales may also be used to supplement available cash flow. Any additional cash returns will be made
through share repurchases and/or supplemental dividends depending on market conditions at the relevant time.
2. As at December 31, 2020. FCF is free cash flow. Free cash flow is a non-GAAP financial measure. See “Non-GAAP Financial Measures” slides.
C$4.5 billion2
in dividends
(34% of FCF)
C$2.3 billion2
in buybacks
(18% of FCF)
{
Optimizing how we deploy Available Cash Flow1:
Balancing between returning cash to shareholders and investing in green metals growth
AND
Leadership in Sustainability
18
Top ranked diversified metals
mining company
“A” rating since 2013
Outperforming 4 of 5 largest peers
Top-ranked mining company 2020
World & North American Indices
Gold Class Award 2021
Carbon and water goals that address the climate challenge
• Paris-aligned commitment to be carbon neutral by 2050;
reducing carbon intensity by 33% by 2030
• Transitioning to sea or low-quality water in all water-scarce regions by 2040
• Lowest GHG intensity miner1 (tCO2e/t CuEq, 2017)
Employer of choice, neighbor of choice
• Enhancing critical control verification to drive further improvements in safety
• Strong relationships with our communities and Indigenous Peoples
Sustainable governance
• Sustainability oversight & direction by dedicated Board and management committees
• Health & safety and sustainability performance linked to compensation program
1. Source: Barclays Research, Teck.
Overview
A Focused Strategy
Poised for Growth
Industry leading
copper growth,
strengthening
existing high-quality,
low carbon assets
Right
Approach
Highest standards
of sustainability in
everything we do,
operational
excellence,
RACE21TM
Our people deliver
the optimal mix of
industry leading
technical, digital,
sustainability,
commercial and
financial leadership
Right
Opportunities
Strong demand for
our metals and
minerals, led by
growth and
decarbonization
Right
Assets
Poised for Growth
20
Providing essential metals and minerals for a low-carbon world
Right
Team
Appendix
Endnotes
Slide 5: About Teck
1. On a consolidated basis.
Slide 6: Accelerated Need for Essential Metals and Minerals for a Low-Carbon World
1. Modelled forecast under International Energy Agency (IEA) Rapid Transition Sustainable Development Scenario (SDS) for 1.5ºC (1.5oC).
2. Source: Vivid Economics.
3. Source: McKinsey.
4. On a consolidated basis.
Slide 7: Teck and the Low-Carbon Transition
1. Barclays Research; Teck. 2017.
Slide 8: Industry Leading Copper Growth in Attractive Jurisdictions
1. Source: Wood Mackenzie base case (attributable) copper production dataset. Consolidated production estimates were derived based on accounting standards for consolidation for Teck and its peers.
2. Teck growth estimate uses 2020 actual production and Wood Mackenzie data for 2023.
3. Copper peers: Antofagasta, First Quantum, Freeport, Hudbay, Lundin, Southern Copper. Diversified peers: Anglo American, BHP, Glencore, Rio Tinto. Peer production metrics for 2020 and 2023 are from Wood Mackenzie. Peer production
metrics for 2020 and 2023 are from Wood Mackenzie. Peer averages are the simple averages.
Slide 11: Accelerate Growth in Copper - Focus on growing copper production
1. We include 100% of production from our Quebrada Blanca and Carmen de Andacollo mines in our production and sales volumes, even though we do not own 100% of these operations, because we fully consolidate their results in our financial
statements. We include 22.5% of production from Antamina, representing our proportionate ownership interest in the operation. QB2 is on a consolidated basis and is based on the QB2 Sanction Case first five full years of copper production.
2. Contained metal. Based on Teck’s 2020 Annual Information Form.
Slide 12: Accelerate Growth in Copper - QB2 is a low cost asset in an attractive jurisdiction
1. Resources figures are based on Teck’s 2020 Annual Information Form. Resources are reported separately from, and do not include that portion of resources classified as reserves. See “QB2 Reserves and Resources Comparison” slide for
further details.
2. C1 cash costs (also known as net cash unit costs) are presented after by-product credits assuming US$10.00/lb molybdenum and US$18.00/oz silver. C1 cash costs for QB2 include stripping costs during operations. See “QB2 Reserves and
Resources Comparison” slide for further details. Net cash unit costs and C1 cash costs are non-GAAP financial measures. See “Non-GAAP Financial Measures” slides.
3. All-in sustaining costs (AISC) are net cash unit costs (also known as C1 cash costs) plus sustaining capital expenditures. Net cash unit costs are calculated after cash margin by-product credits assuming US$10.00/lb molybdenum and
US$18.00/oz silver. Net cash unit costs for QB2 include stripping costs during operations. See “QB2 Reserves and Resources Comparison” slide for further details. AISC. Net cash unit cost and cash margins for by-products are non-GAAP
financial measures. See “Non-GAAP Financial Measures” slides.
4. Source: Wood Mackenzie. Average 2021-2040.
Slide 13: Maximize Cash Flows from Operations to Fund Copper Growth – Copper and Zinc
1. Gross profit margins before depreciation from January 1, 2011 to December 31, 2020. Gross profit margins before depreciation are a non-GAAP financial measure. See “Non-GAAP Financial Measures” slides.
Slide 14: Maximize Cash Flows from Operations to Fund Copper Growth – Steelmaking Coal
1. As at February 17, 2021. The sensitivity of our EBITDA to changes in the Canadian/U.S. dollar exchange rate and commodity prices, before pricing adjustments, based on our current balance sheet, our 2021 mid-range production estimates,
current commodity prices and a Canadian/U.S. dollar exchange rate of $1.30. The effect on our EBITDA of commodity price movements will vary from quarter to quarter depending on sales volumes. Our estimate of the sensitivity of EBITDA to
changes in the U.S. dollar exchange rate is sensitive to commodity price assumptions. See Teck’s Q4 2020 press release for further details. EBITDA is a non-GAAP financial measure. See “Non-GAAP Financial Measures” slides.
2. Gross profit margins before depreciation from January 1, 2011 to December 31, 2020. Gross profit margins before depreciation are a non-GAAP financial measure. See “Non-GAAP Financial Measures” slides.
3. Ten-year steelmaking coal prices are calculated from January 1, 2011. Inflation-adjusted prices are based on Statistics Canada’s Consumer Price Index. Source: Argus, Teck. As at February 19, 2021.
22
Endnotes
Slide 16: Discipline in Capital Allocation - QB2 funding secured; long-dated maturity profile provides optionality
1. As at February 17, 2021.
2. Average from 2016-2020.
3. Adjusted EBITDA is a non-GAAP financial measure. See “Non-GAAP Financial Measures” slides.
4. As at December 31, 2020.
5. As at February 17, 2021. The sensitivity of our EBITDA to changes in the Canadian/U.S. dollar exchange rate and commodity prices, before pricing adjustments, based on our current balance sheet, our 2021 mid-range production estimates,
current commodity prices and a Canadian/U.S. dollar exchange rate of $1.30. See Teck’s Q4 2020 press release for further details.
6. All production estimates are subject to change based on market and operating conditions.
7. The effect on our EBITDA of commodity price movements will vary from quarter to quarter depending on sales volumes. Our estimate of the sensitivity of EBITDA to changes in the U.S. dollar exchange rate is sensitive to commodity price
assumptions. See Caution Regarding Forward-Looking Statements for a further discussion of factors that may cause actual results to vary from our estimates. EBITDA is a non-GAAP financial measure. See “Non-GAAP Financial Measures”
slides.
8. Zinc includes 305,000 tonnes of refined zinc and 597,500 tonnes of zinc contained in concentrate.
Slide 18: Leadership in Sustainability
1. Source: Barclays Research, Teck.
23
Appendix
Quebrada Blanca
Photo: Concentrator - Aerial view of
grinding lines: line 1 SAG and ball mills
in place, line 2 concrete complete
January 2021
 Vast, long life deposit in favourable jurisdiction
 Very low strip ratio
 Low all in sustaining costs (AISC)1
 Potential to be a top 20 producer
 High grade, clean concentrates
 Significant brownfield development
 Community agreements in place and strong local relationships
 Construction well underway; first production expected H2 2022
 Expansion potential (QB3) with potential to be a top 5 producer
Highlights
Chile
Peru
Bolivia
Tarapacá
Region
Arica y
Parinacota
Region
Antofagasta
Region
Arica
Iquique
QB2
Teck, SMM, SC, ENAMI
Collahuasi
Anglo American,
Glencore, Mitsui
El Abra
Freeport-McMoRan,
Codelco
Radomiro
Tomic
Codelco Chuquicamata
Codelco
Ministro
Hales
Codelco
Cerro
Colorado
BHP
Spence
BHP
Centinela
Antofagasta, Marubeni
Gabriela Mistral
Codelco
Escondida
BHP, Rio Tinto, Mitsubishi Argentina
Sierra Gorda
KGHM, SMM, SC
Location
QB2 Project
Executing on a world class development asset
26
QB2’s Competitive Cost Position
Competitive Operating Cost &
Capital Intensity Low Cash Cost Position
27
Based on Sanction Case (Including 199 Mt Inferred Resources)
Refer to “QB2 Project Economics Comparison” and “QB2 Reserves and Resources Comparison” slides for Reserve Case (Excluding Inferred Resources)
The description of the QB2 project Sanction Case includes inferred resources that are considered too speculative geologically to have the economic considerations applied to them that
would enable them to be categorized as mineral reserves. Inferred resources are subject to greater uncertainty than measured or indicated resources and it cannot be assumed that they
will be successfully upgraded to measured and indicated through further drilling.
C1 Cash Cost2 & AISC3 Curve1 (US$/lb, 2023E)
• Given the exceptionally low strip ratio, consistent grade
profile, compact site layout, and high level of automation,
QB2 is expected to have attractive and relatively stable
operating costs
• Exceptional strip ratio of 0.70 LOM, meaning for every one
tonne of ore mined, only 0.70 tonnes of waste need to be
mined (0.44 over first 5 full years)
− Compares to other world class asset strip ratios of 2.6
for Escondida, 3.0 for Antamina, and 3.7 for Collahuasi1
− Major benefit to sustaining capital since it reduces
mobile fleet size and replacement costs
Antamina
Escondida
Collahuasi
-
0.50
1.00
1.50
2.00
2.50
3.00
3.50
- 25% 50% 75% 100%
US$/lb
Cumulative Paid Metal (%)
AISC C1 Cash Cost
QB2
(first 5 full years)
US$1.38/lb
QB2
(first 5 full years)
US$1.28/lb
Vast, Long Life Deposit at Quebrada Blanca
Significant extension potential
• QB2 uses only ~18% of the 2020 reserve and
resource tonnage1
• Deposit is capable of supporting a very long
mine life based on throughput rate of 143 ktpd2
by utilizing further tailings capacity at already
identified sites
• Actively evaluating potential options to exploit
value of full resource through mill expansion
and / or mine life extension
• Beyond the extensive upside included in the
defined QB deposit, the district geology is highly
prospective for exploration discovery and
resource addition; mineralization is open in
multiple directions
28
.
1,259 1,202 1,401 1,432
1,325 1,472
1,891
3,621
2,141
3,393
3,492
3,119
2017 AIF 2018 Resource
Update
2019 AIF 2020 AIF
Inferred
M&I (Exclusive)
P&P
Resources (excluding reserves)
+94%3
Reserve and Resource Tonnage (Mt)
1
Based on Sanction Case (Including 199 Mt Inferred Resources)
Refer to “QB2 Project Economics Comparison” and “QB2 Reserves and Resources Comparison” slides for Reserve Case (Excluding Inferred Resources)
The description of the QB2 project Sanction Case includes inferred resources that are considered too speculative geologically to have the economic considerations applied to them that
would enable them to be categorized as mineral reserves. Inferred resources are subject to greater uncertainty than measured or indicated resources and it cannot be assumed that they
will be successfully upgraded to measured and indicated through further drilling.
QB2 Project Economics Comparison
29
The description of the QB2 project Sanction Case includes inferred resources that are considered too speculative geologically to have the economic considerations applied to them that
would enable them to be categorized as mineral reserves. Inferred resources are subject to greater uncertainty than measured or indicated resources and it cannot be assumed that they
will be successfully upgraded to measured and indicated through further drilling.
7 8
Reserve
Case1
Sanction
Case2
Mine Life Years 28 28
Strip Ratio
First 5 Full Years 0.16 0.44
LOM3 0.41 0.70
C1 Cash Cost4
First 5 Full Years US$/lb $1.29 $1.28
LOM3 US$/lb $1.47 $1.37
AISC5
First 5 Full Years US$/lb $1.40 $1.38
LOM3 US$/lb $1.53 $1.42
QB2 Reserves and Resources Comparison
Reserve Case (as at Nov. 30, 2018)1,2 Sanction Case (as at Nov. 30, 2018)2,4
30
Reserves Mt Cu
Grade %
Mo
Grade %
Silver
Grade ppm
Proven 409 0.54 0.019 1.47
Probable 793 0.51 0.021 1.34
Reserves 1,202 0.52 0.020 1.38
Resources
(Exclusive of
Reserves)5
Mt Cu
Grade %
Mo
Grade %
Silver
Grade ppm
Measured 36 0.42 0.014 1.23
Indicated 1,436 0.40 0.016 1.13
M&I (Exclusive) 1,472 0.40 0.016 1.14
Inferred 3,194 0.37 0.017 1.13
+ Inferred in SC pit 199 0.53 0.022 1.21
Reserves Mt Cu
Grade %
Mo
Grade %
Silver
Grade ppm
Proven 476 0.51 0.018 1.40
Probable 924 0.47 0.019 1.25
Reserves 1,400 0.48 0.018 1.30
Resources
(Exclusive of
Reserves)3
Mt Cu
Grade %
Mo
Grade %
Silver
Grade ppm
Measured 36 0.42 0.014 1.23
Indicated 1,558 0.40 0.016 1.14
M&I (Exclusive) 1,594 0.40 0.016 1.14
Inferred 3,125 0.38 0.018 1.15
QB2 Project Update
Executing on our copper growth strategy
31
Achieved overall progress target of 40% completion
at year end 2020
• Construction continued to ramp up through Q4 2020,
and work is progressing well across the project
• Strict COVID-19 protocols in place and continuously enhanced
to protect the health and safety of our workers and
communities in which we operate
Unchanged capital estimate before COVID-19 impacts
• US$5.2 billion1 including escalation and ~US$400 million
contingency
• Go-forward capital cost from January 1, 2021 estimated
at US$3.2 billion2
Updated estimate of COVID-19 impacts
• US$450-500 million3, an increase of ~$50 million from previous
guidance, which includes ~US$200 million of expensed costs
First production at QB2
is expected in H2 2022
ENAMI Interest in Quebrada Blanca
Organizational Chart
• The government of Chile owns a 10% non-funding
interest in Compañía Minera Teck Quebrada Blanca
S.A. (CMTQB) through its state-run minerals company,
Empresa Nacional de Minería (ENAMI)
• ENAMI has been a partner at QB since 1989 and is
a 10% shareholder of Carmen de Andacollo
• ENAMI is not required to fund QB2 development costs
• Project equity funding in form of:
‒ 25% Series A Shares
‒ 75% Shareholder Loans
• Until shareholder loans are fully repaid, ENAMI is
entitled to a minimum dividend, based on net income,
that approximates 2.0-2.5% of free cash flow
‒ Thereafter, ENAMI receives 10% of dividends /
free cash flow
32
.
CMTQB
TRCL
ENAMI
Teck
10%
(Series B)
100%
90%
(Series A)
JVCo
SMM
66.67%
100%
33.33%
SC
83.33% 16.67%
Chile HoldCo
QB1 / QB2 / QB3
Quebrada Blanca Accounting Treatment
Balance Sheet Cash Flow
• 100% of project spending included in property, plant and
equipment
• Debt includes 100% of project financing
• Total shareholder funding to be split between loans and
equity approximately 75%/25% over the life of the project
• Sumitomo (SMM/SC)1 contributions will be shown as
advances as a non-current liability and non-controlling
interest as part of equity
• Teck contributions, whether debt or equity eliminated on
consolidation
• 100% of project spending included in capital
expenditures
• Sumitomo1 contribution recorded within financing
activities and split approximately 50%/50% as:
‒ Loans recorded as “Advances from Sumitomo”
‒ Equity recorded as “Sumitomo Share Subscriptions”
• 100% of draws on project financing included in financing
activities
• After start-up of operations
‒ 100% of profit in cash flow from operations
‒ Sumitomo’s1 30% and ENAMI’s 10% share of
distributions included in non-controlling interest
33
Income Statement
• Teck’s income statement will include 100% of QB’s
revenues and expenses
• Sumitomo’s1 30% and ENAMI’s 10% share of profit will
show as profit attributable to non-controlling interests
Endnotes: Quebrada Blanca
Slide 26: QB2 Project
1. All-in sustaining costs (AISC) are net cash unit costs (also known as C1 cash costs) plus sustaining capital expenditures. Net cash unit costs are calculated after cash margin by-product credits assuming US$10.00/lb molybdenum and
US$18.00/oz silver. Net cash unit costs for QB2 include stripping costs during operations. AISC, Net cash unit cost and cash margins for by-products are non-GAAP financial measures which do not have a standardized meanings prescribed by
International Financial Reporting Standards (IFRS) or Generally Accepted Accounting Principles in the United States. These measures may differ from those used by other issuers and may not be comparable to such measures as reported by
others. These measures are meant to provide further information about our financial expectations to investors. These measures should not be considered in isolation or used in substitute for other measures of performance prepared in
accordance with IFRS. For more information on our calculation of non-GAAP financial measures please see our Management’s Discussion and Analysis for the year ended December 31, 2018, which can be found under our profile on SEDAR
at www.sedar.com.
Slide 27: QB2’s Competitive Cost Position
1. Source: Wood Mackenzie. Average 2021-2040.
2. C1 cash costs (also known as net cash unit costs) are presented after by-product credits assuming US$10.00/lb molybdenum and US$18.00/oz silver. C1 cash costs for QB2 include stripping costs during operations. Net cash unit costs and C1
cash costs are non-GAAP financial measures. See “Non-GAAP Financial Measures” slides.
3. All-in sustaining costs (AISC) are net cash unit costs (also known as C1 cash costs) plus sustaining capital expenditures. Net cash unit costs are calculated after cash margin by-product credits assuming US$10.00/lb molybdenum and
US$18.00/oz silver. Net cash unit costs for QB2 include stripping costs during operations. AISC. Net cash unit cost and cash margins for by-products are non-GAAP financial measures. See “Non-GAAP Financial Measures” slides.
Slide 28: Vast, Long Life Deposit at Quebrada Blanca
1. Reserves and resources as at December 31, 2020.
2. Based on Sanction Case mine plan tonnage.
3. Resources are reported separately from, and do not include that portion of resources classified as reserves.
Slide 29: QB2 Project Economics Comparison
1. Based on go-forward cash flow from January 1, 2017. Based on all equity funding structure.
2. Based on go-forward cash flow from January 1, 2019. Based on optimized funding structure.
3. Life of Mine annual average figures exclude the first and last partial years of operations.
4. C1 cash costs are presented after by-product credits assuming US$10.00/lb molybdenum and US$18.00/oz silver. Net cash unit costs are consistent with C1 cash costs. C1 cash costs for QB2 include stripping costs during operations. Net cash
unit costs and C1 cash costs are non-GAAP financial measures. See “Non-GAAP Financial Measures” slides.
5. All-in sustaining costs (AISC) are net cash unit costs (also known as C1 cash costs) plus sustaining capital expenditures. Net cash unit costs are calculated after cash margin by-product credits assuming US$10.00/lb molybdenum and
US$18.00/oz silver. Net cash unit costs for QB2 include stripping costs during operations. AISC, Net cash unit cost and cash margins for by-products are non-GAAP financial measures. See “Non-GAAP Financial Measures” slides.
Slide 30: QB2 Reserves and Resources Comparison
1. Mineral reserves are constrained within an optimized pit shell and scheduled using a variable grade cut-off approach based on NSR cut-off US$13.39/t over the planned life of mine. The life-of-mine strip ratio is 0.41.
2. Both mineral resource and mineral reserve estimates assume long-term commodity prices of US$3.00/lb Cu, US$9.40/lb Mo and US$18.00/oz Ag and other assumptions that include: pit slope angles of 30–44º, variable metallurgical recoveries
that average approximately 91% for Cu and 74% for Mo and operational costs supported by the Feasibility Study as revised and updated.
3. Mineral resources are reported using a NSR cut-off of US$11.00/t and include 23.8 million tonnes of hypogene material grading 0.54% copper that has been mined and stockpiled during existing supergene operations.
4. Mineral reserves are constrained within an optimized pit shell and scheduled using a variable grade cut-off approach based on NSR cut-off US$18.95/t over the planned life of mine. The life-of-mine strip ratio is 0.70.
5. Mineral resources are reported using a NSR cut-off of US$11.00/t outside of the reserves pit. Mineral resources include inferred resources within the reserves pit at a US$ 18.95/t NSR cut-off and also include 23.8 million tonnes of hypogene
material grading 0.54% copper that has been mined and stockpiled during existing supergene operations.
34
Endnotes: Quebrada Blanca
Slide 31: QB2 Project Update
1. On a 100% go forward basis from January 1, 2019 including escalation and excluding working capital or interest during construction using actual realized exchange rates until March 30, 2020 and assuming a CLP/USD exchange rate of 775
from April 1, 2020. Includes approximately US$400 million in contingency.
2. Assumes a CLP/USD rate of 775 over the remainder of the project. A CLP 25 change in the CLP/USD exchange rate would change the capital cost estimate by approximately US$80 million.
3. As at December 31, 2020. Additional COVID-related costs will be incurred depending on the progress of the pandemic and response measures required.
Slide 33: Quebrada Blanca Accounting Treatment
1. Sumitomo Metal Mining Co. Ltd. and Sumitomo Corporation are collectively referred to as Sumitomo.
35
Overview
Global Customer Base
Revenue contribution from diverse markets
37
2020 Revenue by
Business Unit
Copper 27%
Zinc 30%
Steelmaking
coal 38%
Energy 5%
2020 Gross Profit Before
Depreciation and Amortization1
by Business Unit
Copper 44%
Zinc 29%
Steelmaking
coal 35%
Energy -8%
2020 Revenue by
Geography
India 6%
China 21%
Asia
(ex. China/India)
33%
North
America 25%
Latin America 2%
Europe 13%
Diverse Pipeline of Growth Options
38
In Construction Future Options
Medium-Term
Options
Zinc
Red Dog
Satellite Deposits
Cirque
Teena
Steelmaking Coal Elk Valley Brownfield
Neptune Terminals
Expansion
Copper
San Nicolás (Cu-Zn)
QB2
Zafranal
Mesaba
NuevaUnión
HVC Brownfield
Schaft Creek
Antamina Brownfield
Galore Creek
QB3
Disciplined Approach to M&A
39
CdA Gold
Stream1,
$206M Project Corridor
/Nueva Union,
$0
Antamina
Silver Stream2
$795M
Osisko
Royalty
Package,
$28M
Sandstorm
Royalty
Package3
$32M
HVC Minority,
($33M)
Teena
Minority4,
($11M)
AQM
Copper,
($25M)
Wintering Hills,
$59M
San Nic
Minority5,
($65M)
IMSA’s stake
in QB, ($208M)
Waneta Dam,
$1,200M6
QB2 Divestment
(30%)7
$1,072M
($500)
$0
$500
$1,000
$1,500
July
10
Aug
27
Oct
7
Oct
25
Jan
19
July
5
Oct
18
Nov
21
Jan
26
Oct
18
Apr
4
Jul
26
Mar
29
2015 2016 2017 2018 2019
Total net proceeds of C$3.1B:
 Balance sheet strengthened by divestment of non-core assets at high EBITDA8 multiples
 Modest ‘prudent housekeeping’ acquisitions to consolidate control of attractive copper and
zinc development assets
Recent Transaction History
Net
Proceeds
(Cost)
(C$M)
Production Guidance
40
Units in 000’s tonnes
(excluding steelmaking coal, molybdenum, and bitumen)
2020 2021 Guidance1 3-Year Guidance1
(2022-2024)
Copper2,3,4
Highland Valley 119.3 128-133 135-165
Antamina 85.6 91-95 90
Carmen de Andecollo 57.4 46-51 50-60
Quebrada Blanca6
13.4 10-11 -
Total copper 275.7 275-290 275-315
Zinc2,3,5
Red Dog 490.7 490-510 510-550
Antamina 96.3 95-100 80-100
Total zinc 587.0 580-610 590-650
Refined zinc
Trail 305.1 300-310 305-315
Steelmaking coal (Mt) 21.1 25.5-26.5 26.0-27.0
Bitumen3
(Mbbl)
Fort Hills 8.4 8.6-12.1 14
Lead2
Red Dog 97.5 85-95 80-90
Molybdenum2,3
(Mlbs)
Highland Valley 3.8 1.2-1.8 3.0-4.5
Antamina 1.5 1.0-1.4 2.0-3.0
Total molybdenum 5.1 2.2-3.2 5.0-7.5
Sales and Unit Cost Guidance
41
Unit Costs 2020 2021 Guidance1
Copper3
Total cash unit costs7
(US$/lb) $1.57 $1.65-1.75
Net cash unit costs4,7
(US$/lb) 1.28 1.30-1.40
Zinc5
Total cash unit costs7
(US$/lb) 0.53 $0.54-0.59
Net cash unit costs4,7
(US$/lb) 0.36 0.40-0.45
Steelmaking coal6
Adjusted site cash cost of sales7
$64 $59-64
Transportation costs 41 36-39
Inventory write-down 3 -
Unit costs7
(C$/tonne) $108 $95-103
Bitumen
Adjusted operating costs7
(C$/barrel) C$31.96 C$28-32
Sales Q4 2020 Q1 2021 Guidance1
Zinc2
Red Dog 149 90-100
Steelmaking coal (Mt) 6.1 5.9-6.3
Capital Expenditures Guidance
42
(Teck’s share in CAD$ millions)
2020 2021
Guidance1
Sustaining
Copper $ 161 $ 160
Zinc 188 155
Steelmaking coal2 571 430
Energy 91 85
Corporate 12 -
Total sustaining $ 1,023 $ 830
Growth3
Copper4 $ 41 $ 125
Zinc 7 25
Steelmaking coal 411 390
Corporate 4 5
$ 463 $ 545
Total
Copper $ 202 $ 285
Zinc 195 180
Steelmaking coal 982 820
Energy 91 85
Corporate 16 5
$ 1,486 $ 1,375
(Teck’s share in CAD$ millions)
2020 2021
Guidance1
QB2 capital expenditures $ 1,643 $ 2,500
Total before SMM/SC contributions 3,129 3,875
Estimated SMM/SC contributions (660) (440)
Estimated QB2 project financing
draw to capex (983) (1,425)
Total, net of partner contributions
and project financing $ 1,486 $ 2,010
QB2
(Teck’s share in CAD$ millions)
2020 2021
Guidance1
Capitalized Stripping
Copper $ 145 $ 205
Zinc 51 70
Steelmaking coal 303 295
$ 499 $ 570
Capitalized Stripping
Sustaining and Growth Capital
Commodity Price Leverage1
43
2021 Mid-Range
Production
Estimates2,5
Change Estimated Effect
on Annualized
Profit3 ($M)
Estimated Effect
on Annualized
EBITDA3 ($M)
US$ exchange C$0.01 $44 $70
Copper (kt) 282.5 US$0.01/lb $5 $8
Zinc4 (kt) 902.5 US$0.01/lb $9 $12
Steelmaking coal (Mt) 26.0 US$1/tonne $19 $30
WCS5 (Mbbl) 10.4 US$1/bbl $9 $13
WTI6 US$1/bbl $6 $8
Tax-Efficient Earnings in Canada and Chile
44
Canada: ~C$4.5 billion in available tax pools at December 31, 2020
• Includes:
‒ $3.8 billion in Canadian federal net operating loss carryforwards
‒ $0.3 billion in Canadian Development Expenses (30% declining balance p.a.)
‒ $0.4 billion in allowable capital loss carryforwards
• Applies to cash income taxes in Canada
• Does not apply to:
‒ Resource taxes in Canada
‒ Cash taxes in foreign jurisdictions
Chile: ~C$800 million in available tax pools at December 31, 2020
• Chilean net operating loss carryforwards
• Applies to cash income taxes for QB2
Share Structure & Principal Shareholders
45
Shares Held Percent Voting Rights
Class A Shareholdings
Temagami Mining Company Limited 4,300,000 55.4%
SMM Resources Inc (Sumitomo) 1,469,000 18.9%
Other 1,996,503 25.7%
7,765,503 100.0%
Class B Shareholdings
Temagami Mining Company Limited 725,000 0.1%
SMM Resources Inc (Sumitomo) 295,800 0.1%
China Investment Corporation (Fullbloom) 59,304,474 11.3%
Other 463,056,146 88.5%
523,381,420 100.0%
Total Shareholdings
Temagami Mining Company Limited 5,025,000 0.9% 33.1%
SMM Resources Inc (Sumitomo) 1,764,800 0.3% 11.3%
China Investment Corporation (Fullbloom) 59,304,474 11.2% 4.6%
Other 465,052,649 87.6% 51.0%
531,146,923 100.0% 100.0%
Teck Resources Limited at December 31, 2020
Collective Agreements
Operation Expiry Dates
Elkview October 31, 2020
Fording River April 30, 2021
Antamina July 31, 2021
Highland Valley Copper September 30, 2021
Trail Operations May 31, 2022
Cardinal River June 30, 2022
Quebrada Blanca
January 31, 2022
March 31, 2022
November 20, 2022
Carmen de Andacollo
September 30, 2022
December 31, 2022
Line Creek May 31, 2024
46
Endnotes: Overview
Slide 37: Global Customer Base
1. Gross profit before depreciation and amortization is a non-GAAP financial measure. See “Non-GAAP Financial Measures” slides.
Slide 38: Disciplined Approach to M&A
1. Carmen de Andacollo gold stream transaction occurred in USD at US$162 million.
2. Antamina silver stream transaction occurred in USD at US$610 million.
3. Sandstorm royalty transaction occurred in USD at US$22 million.
4. Teena transaction occurred in AUD at A$10.6 million.
5. San Nicolàs transaction occurred in USD at US$50 million.
6. Waneta Dam transaction closed July 26, 2018 for C$1.2 billion.
7. QB2 Partnership (sale of 30% interest of project to Sumitomo; SMM and SC) for total consideration of US$1.2 billion, including US$800 million earn-in and US$400 million matching contribution; converted at FX of 1.34 on March 29, 2019.
8. EBITDA is a non-GAAP financial measure. See “Non-GAAP Financial Measures” slides.
Slide 40: Production Guidance
1. As at February 17, 2021. See Teck’s Q4 2020 press release for further details.
2. Metal contained in concentrate.
3. We include 100% of production and sales from our Quebrada Blanca and Carmen de Andacollo mines in our production and sales volumes, even though we do not own 100% of these operations, because we fully consolidate their results in our
financial statements. We include 22.5% and 21.3% of production and sales from Antamina and Fort Hills, respectively, representing our proportionate ownership interest in these operations.
4. Copper production includes cathode production at Quebrada Blanca and Carmen de Andacollo.
5. Total zinc includes co-product zinc production from our 22.5% proportionate interest in Antamina.
6. Three-year guidance 2022 —2024 excludes production from QB2.
Slide 41: Sales and Unit Cost Guidance
1. As at February 17, 2021. See Teck’s Q4 2020 press release for further details.
2. Metal contained in concentrate.
3. Copper unit costs are reported in U.S. dollars per payable pound of metal contained in concentrate. Copper net cash unit costs include adjusted cash cost of sales and smelter processing charges, less cash margins for by-products including
co-products. Guidance for 2021 assumes a zinc price of US$1.22 per pound, a molybdenum price of US$8.50 per pound, a silver price of US$20 per ounce, a gold price of US$2,000 per ounce and a Canadian/U.S. dollar exchange rate of
$1.30.
4. After co-product and by-product margins.
5. Zinc unit costs are reported in U.S. dollars per payable pound of metal contained in concentrate. Zinc net cash unit costs are mine costs including adjusted cash cost of sales and smelter processing charges, less cash margins for by-products.
Guidance for 2021 assumes a lead price of US$0.85 per pound, a silver price of US$20 per ounce and a Canadian/U.S. dollar exchange rate of $1.30. By-products include both by-products and co-products.
6. Steelmaking coal unit costs are reported in Canadian dollars per tonne.
7. Non-GAAP financial measure. See “Non-GAAP Financial Measures” slides.
47
Endnotes: Overview
Slide 42: Capital Expenditures Guidance
1. As at February 17, 2021. See Teck’s Q4 2020 press release for further details.
2. Steelmaking coal sustaining capital guidance for 2021 includes $255 million of water treatment capital. 2020 includes $267 million of water treatment capital.
3. Growth expenditures include RACE21TM capital expenditures for 2021 of $120 million, of which $80 million relates to steelmaking coal, $30 million relates to copper, $5 million relates to zinc and $5 million relates to corporate projects.
4. Copper growth guidance for 2021 includes studies for HVC 2040, Antamina, QB3, Zafranal, San Nicolás and Galore Creek.
Slide 43: Commodity Price Leverage
1. As at February 17, 2021. The sensitivity of our annual profit attributable to shareholders and EBITDA to changes in the Canadian/U.S. dollar exchange rate and commodity prices, before pricing adjustments, based on our current balance sheet,
our 2021 mid-range production estimates, current commodity prices and a Canadian/U.S. dollar exchange rate of $1.30. See Teck’s Q4 2020 press release for further details.
2. All production estimates are subject to change based on market and operating conditions.
3. The effect on our profit attributable to shareholders and on EBITDA of commodity price and exchange rate movements will vary from quarter to quarter depending on sales volumes. Our estimate of the sensitivity of profit and EBITDA to changes
in the U.S. dollar exchange rate is sensitive to commodity price assumptions.
4. Zinc includes 305,000 tonnes of refined zinc and 597,500 tonnes of zinc contained in concentrate.
5. Bitumen volumes from our energy business unit.
6. Our WTI oil price sensitivity takes into account our interest in Fort Hills for respective change in revenue, partially offset by the effect of the change in diluent purchase costs as well as the effect on the change in operating costs across our
business units, as our operations use a significant amount of diesel fuel.
48
Safety and
Sustainability
Leadership
Sustainability Reporting & Rankings
50
• Top-ranked mining company
World & North American Indices
• Gold Class Award 2021
• “A” rating since 2013
• Outperforming 4 of 5 largest peers
• Top ranked diversified metals mining
company
• Top ranked North American
company
• #1 in the mining subsector
• Ranked among the top 10% of
Metals & Mining companies
Our Reporting Frameworks
GRI Standards
Helps businesses, government and
stakeholders communicate and
understand impact of business on
sustainability issues
SASB Standards
Helps businesses identify, manage
and report on sustainability topics of
greatest interest to investors
Task Force on Climate Related
Financial Disclosures (TCFD)
Helps businesses quantify and
communicate climate change risks
and opportunities
ESG Rankings
Focus on Sustainability Leadership
Ambitious sustainability goals in eight strategic themes
51
Climate Change Responsible Production
Water Tailings Management Biodiversity and
Reclamation
Health and Safety Our People
Communities and
Indigenous Peoples
Sustainability Leadership
Aligned with Leading External Standards and Practices
52
See the full list on our Memberships and Partnerships page:
https://www.teck.com/responsibility/approach-to-responsibility/policies-and-commitments/memberships-&-partnerships/
Health and Safety
Our safest year on record in 2020
• Safety performance in 2020
- 32% reduction in High-Potential
Incident Frequency
- 23% decrease in Lost-Time
Disabling Injury Frequency
53
Teck Operated Incident Frequency
(per 200,000 hours worked)
0.00
0.10
0.20
0.30
0.40
0.50
0.60
0.70
2016 2017 2018 2019 2020
High-Potential Incident Frequency
Serious High-Potential Incident Frequency
Potentially Fatal Occurrence Frequency
High-Potential Incident Frequency rate
reduced by two-thirds over past five years
Climate Action
Positioning for Low-Carbon Economy
Well positioned for a
low-carbon economy
Among lowest GHG
intensity miners globally on
a copper-equivalent basis
GHG intensity for steelmaking
coal and copper production
among lowest in industry
Carbon pricing already built
into majority of business
Scope 1+2 emissions per copper equivalent ranking1
(tCO2e/t CuEq, 2017)
54
1. Source: Barclays Research, Teck.
Climate Action
Key Activities for Short-Term Goals
55
Investing in lower-carbon
means of transportation
such as electric haul trucks,
conveyors and other
approaches
Reduce the carbon
intensity of our
operations by
33% by
2030
Electric bus pilot project represents the
first use of electric passenger buses for
employee transport in the Canadian
mining industry
Accelerate the adoption of
zero-emissions alternatives
for transportation by
displacing the
equivalent of
internal combustion engine
(ICE) vehicles by 2025
1,000
Procure of
our electricity demands
in Chile from clean
energy by 2025 and
In 2020 two power purchase
agreements announced:
- Over 50% of QB2 operating
power requirement from
renewables
- 100% renewable power at
Carmen de Andacollo
100% by 2030
50%
Climate Action
Path to Carbon Neutrality
Mitigation
Hierarchy
Apply
Decarbonization
Framework
Prioritize Opportunities and Deliver Cost Competitive Reductions
Avoid
Eliminate
Minimize
Offset
Emissions
sources
Power
supply
Mobile
equipment
Stationary
combustion
and process
Fugitive
methane
emissions
Renewable
energy
Electrification
and alternative
material handling
Select abatement options
Electrification
and low
carbon fuels
Methane
recovery and
abatement
Time
2020-2030:
Target readily
available, cost
competitive
technologies in
these areas
56
Implement innovative water management
and water treatment solutions to protect
water quality downstream of all our
operations.
Transition to seawater or low-quality water
sources for all operations in water-scarce
regions by 2040.
57
Water Management
Long Term Strategic Priorities and Goals
Water Quality in the Elk Valley
Advancing Innovative Technologies
58
Saturated Rock Fill Nitrate Reduction
Elk Valley Water Quality Plan developed with government, Indigenous Peoples
and communities to address water quality challenges
Elk Valley Water Treatment
Clear Path Forward for Improving Water Quality
59
Millions
of
Litres
per
Day
Tailings Management
Our Approach
• Full implementation of the Global Industry
Standard on Tailings Management
underway with full conformance by 2023
• Management and emergency response
aligned with Towards Sustainable Mining
Protocols
• Enhanced transparency & disclosure
‒ Facilities inventory posted www.teck.com
‒ Detailed response to the tailings facility
enquiry from the Church of England
Pensions Board and Swedish Council on
Ethics for the AP Funds
Teck has comprehensive systems and
procedures in place based on
6 levels of protection:
Surveillance
Technology
1 Internal
Inspections
2 Annual Dam
Safety
Inspections
3
Internal
Governance
Reviews
4 Detailed
Third-Party
Reviews
5 Independent
Tailings
Review Boards
6
60
• Agreements in place at all mining
operations within or adjacent to Indigenous
Peoples’ territories
• $192 million to Indigenous businesses in
2020 through procurement
• 72% of total local employment in 2020
• $19 million in community investment in 2020
• Zero significant incidents that were human
rights related in 2020
• Released updated Human Rights Policy in
April 2020, first established in 2012
Relationships with Communities and Indigenous
Peoples, Respecting Human Rights
61
Related SASB1 Metric: EM-MM-210a.3 | Link to Data
Related SASB1 Metric: EM-MM-210b.1 | Link to Data
Inclusion and Diversity
• Inclusion and Diversity: committed to improve
representation of under-represented groups in
our workforce: women, Indigenous, Asian, Black,
and all people of colour (BIPOC), persons with
disabilities, and members of the LGBTQ+
community
• Gender Diversity: 20% of workforce are women;
25% of Board of Directors, including the Chair;
29% of new hires
• Workplace Flexibility: family-friendly policies
and programs in place, expanding remote
working policy
• Employee engagement and feedback:
24-hour hotline, site-based inclusion and diversity
chairs, leadership development programs
62
Range of projects in place to promote
inclusion and diversity, including STEM
leadership courses at Trail Operations
• Compensation program is linked to
sustainability and health and safety
performance through individual,
department and company-wide objectives.
• Objectives related to climate change,
communities and Indigenous Peoples,
tailings and water management and others
can affect bonuses by at least 10%–20%.
• Incentive compensation of the CEO and
senior officers includes sustainability
performance indicators.
63
Sustainability Performance
and Compensation
Questions and Further Information
ESG Resources for Investors
Please see our Disclosure Portal and Sustainability Information for Investors 64
• Sustainability reporting for 20
years in Core accordance with
the Global Reporting Initiative
(GRI) Standards and G4 Mining
and Metals Sector Disclosures
• Report is aligned with
Sustainability Accounting
Standards Board (SASB)
• Task Force for Climate-
Related Financial Disclosure
(TCFD) aligned report “Portfolio
Resilience in the Face of Climate
Change” published in 2019
• Detailed COVID-19 Response
page
Technology and
Innovation
RACE21TM
Our innovation-driven business transformation program
66
• Unify and modernize Teck’s core systems
• Establish technology foundation that facilitates
deployment of Connect and Automate reliably and at
scale
• For example: Wireless site infrastructure to support
automation, sensing, site communications, information
access, pit-to-port integration and advanced analytics
• Accelerate and scale autonomy program
• Transformational shift in safety
• Reduce per-tonne mining costs with smaller fleets
• Provide innovation platform to enable implementation
of advanced analytics to drive cycle time improvement
& predictive maintenance
Renew Automate
RACE21TM
Our innovation-driven business transformation program
67
• Link disparate systems into a collaborative digital
platform with powerful tools for sensing and analyzing
in real time
• For example: Dynamic and predictive models to
reduce variability, leading to significant improvements
in throughput and recovery
• The natural implication of Renew, Automate, and
Connect is we can re-imagine what it means to work
at Teck and re-design our operating model to attract,
recruit, train and retain the workforce of the future
Connect Empower
Significant Value Has Been Captured
68
COST
Reduced operational
costs
PROFITABILITY
Step-change impact to
profitability
SAFETY
Transformational
safety impact
PRODUCTIVITY
Increased productivity
through technology
and innovation
Advanced data
analytics and artificial
intelligence to reduce
risk of heavy vehicle /
light vehicle
interactions
Increased copper
throughput by ~7%
and recovery by ~2%
at Highland Valley
Copper
Advanced analytical
tools contributed to
record haul truck
productivity across our
major mine sites
Blending optimization
tools used at Trail
Operations to reduce
costs
Steelmaking Coal
Business Unit & Markets
Steelmaking Coal Market
China ban of Australian coal pushing seaborne CFR China price higher
Near term outlook: An eventual end to “China
ban” would increase FOB Australia prices
• China: 2020 are 2nd highest seaborne imports despite
ban of Australian coal effective October 2020
• Ex-China markets: Demand resurgence with >80%
banked blast furnaces restarted or announced to restart
• Supply: Cost curve and supply response (COVID-19,
“China ban”, and mine disruptions) provide price support
Longer term outlook: Fundamentals remain
unchanged
• China: Declining domestic reserves and persistent
demand by coastal steel mills and new projects
• Ex-China markets: Mid-term demand boosted by
government stimulus and long-term growth supported by
Indian government targets, limited scrap supply and
continued urbanization
• Supply: Declining existing capacity and minimal project
pipeline (low investment and permitting challenges)
70
Strong coal fundamentals underpinned
by global economic recovery
Steelmaking Coal Prices1 (US$/t)
10-year average Seaborne FOB price of ~US$170/t,
or ~US$180/t on an inflation-adjusted basis
0
50
100
150
200
250
Jan-20
Feb-20
Mar-20
Apr-20
May-20
Jun-20
Jul-20
Aug-20
Sep-20
Oct-20
Nov-20
Dec-20
Jan-21
Feb-21
Chinese Domestic CFR Equivalent
CFR China
FOB Australia
Steelmaking Coal Facts
Global Coal Production1:
~7.8 billion tonnes
Steelmaking Coal Production2:
~1,130 million tonnes
Export Steelmaking Coal2:
~320 million tonnes
Seaborne Steelmaking Coal2:
~285 million tonnes
71
• ~0.7 tonnes of steelmaking coal is used to
produce each tonne of steel3
• Up to 100 tonnes of steelmaking coal is required
to produce the steel in the average wind turbine4
Our market is seaborne hard coking coal2: ~190 million tonnes
Steelmaking Coal Demand Growth Forecast
Continued recovery with >80% banked blast furnaces restarted/announced restart
Seaborne Steelmaking Coal Imports1 (Mt)
Change 2021 vs. 2020
72
Includes:
• China: Expected recovery of Mongolian exports
• Europe/JKT: Restarting banked furnaces
• India: Growing steel production (unchanged long-term
fundamentals)
• Brazil: Strong domestic demand (residential
construction, automotive) and export market
• SE Asia: Economic recovery (demand growth from
Vietnam
291
310
11
5
4
3 2
6
260
270
280
290
300
310
320
2020 China Europe India JKT Brazil SE Asia 2021E
Indian Steelmaking Coal Imports
Mid- & long-term imports supported by secular demand and government targets
73
Indian Seaborne Coking Coal Imports2 (Mt)
Indian Crude Steel Production1 (Mt)
0
10
20
30
40
50
60
0
20
40
60
80
100
120
India 2021 crude steel production and seaborne coking coal imports return to 2019 levels
Chinese Steelmaking Coal Imports
2020 seaborne imports up by +8 Mt
74
Chinese Coking Coal Imports2 (Mt)
Chinese Crude Steel Production (CSP), Hot Metal
Production (HMP) and Coal Production (Mt)1
Higher China coal production and lower Mongolia imports in 2020.
• +4Mt YoY for domestic coking coal production
• -10Mt YoY for Mongolian coking coal imports
• 2020 record high crude steel production @ 1.05 billion tonnes
0
100
200
300
400
500
600
0
200
400
600
800
1,000
1,200
CSP (LHS) HMP (LHS) Coking Coal Production (RHS)
25
35
60
48
35 36
44
37 41
49 43
20
19
16
15
13
24
26
28
34
24 30
0
10
20
30
40
50
60
70
80
Seaborne Coking Coal Imports Mongolian Coking Coal Imports
Large Users in China Increasing Imports
~2/3 of China crude steel produced on coast; projects support imports
75
HBIS LAOTING PROJECT
• Inland plant relocating to coastal area
• Capacity: crude steel 20 Mt
• Status: Construction started in 2017; 2 of 3 BFs
commissioned; #3 BF to commission in 2021
ZONGHENG FENGNAN PROJECT
• Inland plant relocating to coastal area
• Capacity: crude steel 8 Mt
• Status: Construction started in 2017; all 4 BFs
completed and commissioned in 2019 and 2020.
SHOUGANG JINGTANG PLANT
• Expansion
• Capacity: crude steel 9.4 Mt (phase 2)
• Status: Construction started in 2015; 1 of 2 BFs
completed in Apr 2019
LIUSTEEL FANGCHENG PROJECT
• Greenfield project
• Capacity: Phase 1 crude steel ~10 Mt
• Status: Construction started in 2017; 1 of 3
BFs completed in June 2020; #2 BF to
commission in 2021
BAOWU ZHANJIANG PLANT
• Expansion
• Capacity: crude steel 3.6 Mt (phase 2)
• Status: Construction started in Apr 2019;
completion in 2021
BAOWU YANCHENG PROJECT
• Inland plant relocating to coastal area
• Capacity: crude steel 20 Mt (phase 1: 8-10 Mt)
• Status: Phase 1 construction started in May 2019
Chinese Steel Margins
Margins turn negative
China Hot Rolled Coil (HRC) Margins and Steelmaking Coal (HCC) Prices1 (US$/t)
76
Chinese Scrap Use Remains Low
Scrap supply limits EAF share in steel output
77
China’s Scrap Ratio Lower than Other Countries
(20191)
Crude Steel
Electric Arc Furnace
Hot Metal
China Steel Use By Sector
(2000-2019)2
2025 EAF share forecast to be similar to 2010
83%
69%
55%
42% 40% 34%
22%
0%
20%
40%
60%
80%
100%
Turkey USA EU Russia Korea Japan China
0
200
400
600
800
1000
1200
2010 2012 2014 2016 2018 2020 2022 2024
Construction
50-60%
Machinery
15-20%
Auto
5-10%
Others
15-25%
Steelmaking Coal Supply Growth Forecast
Supply forecasted to recover amid growing demand
Seaborne Steelmaking Coal Exports1 (Mt)
Change 2021 vs. 2020
78
Includes:
• Australia: Growth from existing mines and potential mine
restarts
• (Anglo’s Grosvenor, Peabody’s Metropolitan, Sojitz’s Crinum)
• USA: Recovering demand from Europe and Brazil and
higher exports to China (China’s ban on Australian coal)
• Canada: Growth from existing mines
• Russia: Higher exports to China and potential mine
expansion projects
• (Kolmar’s and Evraz’s existing mines, A-Property’s Elga)
• Mozambique: Growth from Vale’s Moatize
• Indonesia: ramp-up from newly commissioned mines
• (Adaro’s Lampunut or Cokal’s BBM)
283
306
6
6
5
3 1 1 1
260
270
280
290
300
310
2020 Australia USA Russia Canada Mozambique Indonesia Supply
Others
2021E
US Coal Producers are Swing Suppliers
79
US Steelmaking Coal Exports1 (Mt)
Australian Steelmaking Coal Exports1 (Mt)
0
20
40
60
80
100
120
140
160
180
200
0
10
20
30
40
50
60
70
Canadian & Mozambique Steelmaking Coal Exports
80
Mozambique Exports2 (Mt)
Canadian Exports1 (Mt)
0
5
10
15
20
25
30
35
40
0
1
2
3
4
5
6
7
8
9
2nd Largest Seaborne Steelmaking Coal Supplier
Competitively positioned to supply steel producers worldwide
81
CHINA
2013: ~30%
2017: ~15%
2019: ~10%
2020: ~15%
INDIA
2013: ~5%
2017: ~10%
2019: ~15%
2020: ~15%
Sales Distribution
AMERICAS
~5%
EUROPE
2013: ~15%
2017: ~20%
2019: ~15%
2020: ~15%
ASIA EXCL. CHINA & INDIA
2013: ~40%
2017: ~45%
2019: ~55%
2020: ~50%
Targeting increased sales to China to capture current CFR China price premium
82
¯
• 811 million tonnes1 of reserves
support 26 to 27 million tonnes
of long term annual production
• The Neptune Bulk Terminals
upgrade to secure >18.5 Mt
of exclusive port capacity
‒ Lower cost and more
reliable port access for
steelmaking coal
‒ Established infrastructure
and supply chain capacity
with mines and railways
• Geographically concentrated
in the Elk Valley, BC, Canada
• Stable long term strip ratio
High-Quality Steelmaking Coal Business
Steelmaking Coal Business Operating Strategy
83
26 to 27 million tonnes of long term
annual production capacity
• Increase margins not volumes
• Maximize synergies in the
Elk Valley, BC, Canada
• Optimize supply chain
• Productivity focus
• Sustain strong cash flow
on a restructured cost base
Steelmaking Coal Unit Costs
84
Operating Cost1 Breakdown in 2020
Labour 34%
Contractors and Consultants 13%
Operating Supplies 16%
Repairs and Maintenance Parts 19%
Energy 14%
Other 4%
Total 100%
Transportation
29%
Depreciation
and
Amortization
24%
Operating Costs
47%
Unit Costs1 in 2020
Setting Up for Strong Long-Term
Cash Flows in Steelmaking Coal
85
Executing on four pillars to transform cost
structure and optimize margins
1. Decline in strip ratio
2. Strategically replaced high-cost tonnes with
low-cost tonnes
3. RACE21TM transformation
‒ Lowering operating costs and increasing
EBITDA1 potential
4. Neptune capacity increase and third party logistics
contracts
‒ Lowering port costs, increase logistics chain
flexibility and improved reliability
82%
90%
92%
99%
101% 100%
103% 102%
105%
80%
85%
90%
95%
100%
105%
110%
2012 2013 2014 2015 2016 2017 2018 2019 2020
86
Truck Productivity4 (SHM%)
RACE21™ innovation-driven business
transformation
• Record 2020 haul truck productivity improvement
• Advanced plant analytics
• Autonomous haulage strategy
‒ Substantial completion of the autonomous
haulage pilot at Elkview Operations by year end
Mid-Point
2021 Production
Guidance2
Change Estimated Effect
on Annualized
Profit3
Estimated Effect
on Annualized
EBITDA3
Coal 26.0 Mt US$50/t C$950M C$1,500M
Strong cash flow generation1
Steelmaking Coal Continues To Deliver
Strong Returns
Sustain Production Capacity and Productivities
In Steelmaking Coal
Maintaining historical dollar per tonne
sustaining investment levels
2010-2016: Average spend of ~$11 per tonne1
• Swift at Fording River and Line Creek
• Reinvestment in 5 shovels, 50+ haul trucks
2017-2024: Average spend of ~$11-13 per tonne1
• Plant expansion at Elkview, mine life extension
projects and Neptune sustaining investments
• Reinvestment in equipment fleets and
infrastructure to increase mining productivity
and processing efficiencies
87
Sustaining capital is now inclusive of production capacity investments previously called Major Enhancement.
Sustaining Capital, Excluding Water Treatment1 ($/t)
Long term run rate for sustaining capital is ~$11-13 per tonne
SALES MIX
• ~40% quarterly contract price
• ~60% shorter than quarterly pricing mechanisms
(including “spot”)
PRODUCT MIX
• ~75% of production is high-quality HCC
• ~25% is a combination of SHCC, SSCC, PCI
• Varies quarter-to-quarter based on the mine plans
KEY FACTORS IMPACTING TECK’S AVERAGE
REALIZED PRICES
• Variations in our product mix
• Timing of sales
• Direction and underlying volatility of the daily price
assessments
• Spreads between various qualities of steelmaking coal
• Arbitrage between FOB Australia and CFR China pricing
Teck’s Pricing Mechanisms
Coal sales book generally moves with the market
88
Index Linked Sales
• Quarterly contract sales index linked
• Contract sales index linked
• Contract sales with index fallback
• Spot sales index linked
Fixed Price Sales
• Contract sales spot priced
• Contract sales with index fallback
• Spot sales with fixed price
70%
30% Index
Linked
Fixed
Price
Pricing Mechanisms (%)
(100)
(75)
(50)
(25)
0
25
50
75
100
0
50
100
150
200
250
300
350
Jun-16
Oct-16
Feb-17
Jun-17
Oct-17
Feb-18
Jun-18
Oct-18
Feb-19
Jun-19
Oct-19
Feb-20
Jun-20
Oct-20
Feb-21
Seaborne HCC CFR China (LHS)
Domestic HCC CFR China (LHS)
Seaborne / Domestic spread (RHS)
Quality and Basis Spreads
Impact on Teck’s average realized steelmaking coal prices
HCC Seaborne / China Domestic Prices
and Spread2 (US$/t)
HCC / SHCC Prices and Spread1 (US$/t)
89
0
25
50
75
100
0
50
100
150
200
250
300
350
Jun-16
Oct-16
Feb-17
Jun-17
Oct-17
Feb-18
Jun-18
Oct-18
Feb-19
Jun-19
Oct-19
Feb-20
Jun-20
Oct-20
Feb-21
HCC (LHS)
SHCC (LHS)
HCC / SHCC spread (RHS)
West Coast Port Capacity
90
• Current capacity 35 Mtpa
• Teck contracted capacity, following expiry of our
current contract on March 31, 2021:
‒ 2021: 12.55-13.55 Mt, including ~5 Mt in Q1 2021
‒ From 2022: 5-7 Mtpa at fixed loading charges
‒ Total of 33 Mt over agreement term
WESTSHORE TERMINALS
• World class design and equipment for enhanced reliability
• Capacity growth to >18.5 Mtpa
• ~$150M infrastructure investment in upstream
supply chain
• 100% ownership of coal capacity
NEPTUNE COAL TERMINAL
• Current capacity 18 Mtpa
• Teck contract:
‒ January 2021 to December 2027
‒ Ramps up to 6 Mtpa over 2021
RIDLEY TERMINALS
Teck’s Contracted West Coast
Port Capacity (Nominal Mt)
Westshore Terminals
Neptune Coal Terminal
Ridley Terminals
6
5-7
>18.5
• Achieved 90% overall completion at end
of January 2021
• All major equipment has been installed
• Significant new facilities have been placed
into operation and are performing to plan
• First coal through the upgraded facility
is expected in early Q2 2021
Neptune Facility Upgrade Update
Final stage of construction
91
Secures a long-term, low-cost and reliable supply chain for steelmaking coal
Endnotes: Steelmaking Coal
Slide 70: Steelmaking Coal Market
1. Ten-year steelmaking coal prices are calculated from January 1, 2011. Inflation-adjusted prices are based on Statistics Canada’s Consumer Price Index. Source: Argus, Teck. As at February 19, 2021.
Slide 71: Steelmaking Coal Facts
1. Source: IEA.
2. Source: Wood Mackenzie (Long Term Outlook H2 2020).
3. Source: World Coal Association. Assumes all of the steel required is produced by blast furnace-basic oxygen furnace route.
4. Source: The Coal Alliance. Assumes all of the steel required is produced by blast furnace-basic oxygen furnace route.
Slide 72: Steelmaking Coal Demand Growth Forecast
1. Source: Data compiled by Teck based on information from Wood Mackenzie (Short Term Outlook January 2021).
Slide 73: Indian Steelmaking Coal Imports
1. Source: Data compiled by Teck based on information from WSA and CRU (Crude Steel Market Outlook October 2020).
2. Source: Data compiled by Teck based on information from Global Trade Atlas and CRU (Metallurgical Coal Market Outlook November 2020). 2020 and 2021 are based on information from CRU.
Slide 74: Chinese Steelmaking Coal Imports
1. Source: Data compiled by Teck based on information from NBS, Wood Mackenzie (Long Term Outlook H2 2020), and Fenwei. 2021 is based on information from Wood Mackenzie and Fenwei.
2. Source: Data compiled by Teck based on information from China Customs and Wood Mackenzie (Short Term Outlook January 2021). 2021 is based on information from Wood Mackenzie.
Slide 75: Large Users in China Increasing Imports
1. Source: Data compiled by Teck based on information from China Customs, Fenwei and Teck.
Slide 76: Chinese Steel Margins
1. Source: China HRC Gross Margins is estimated by Mysteel. China Domestic HCC Price is Liulin #4 price sourced from Sxcoal and is normalized to CFR China equivalent. Seaborne HCC Price (CFR China) is based on Argus Premium HCC
CFR China. Plotted to February 5, 2021.
Slide 77: Chinese Scrap Use Remains Low
1. Source: Data compiled by Teck based on information from Bureau of International Recycling.
2. Source: Data compiled by Teck based on information from China Metallurgy Industry Planning and Research Institute.
3. Source: Data compiled by Teck based on information from Wood Mackenzie (Long Term Outlook H2 2020) and CRU (Crude Steel Market Outlook October 2020).
Slide 78: Steelmaking Coal Supply Growth Forecast
1. Source: Data compiled by Teck based on information from Wood Mackenzie (Short Term Outlook January 2021).
Slide 79: US Coal Producers are Swing Suppliers
1. Source: Data compiled by Teck based on information from Global Trade Atlas and Wood Mackenzie (Short Term Outlook January 2021).
Slide 80: Canadian & Mozambique Steelmaking Coal Exports
1. Source: Data compiled by Teck based on information from Global Trade Atlas, Wood Mackenzie (Short Term Outlook January 2021).
2. Source: Data complied by Teck based on information from Wood Makenzie. 2010-2020 are based on information from Wood Mackenzie (Long Term Outlook H2 2020). 2021 is based on information from Wood Mackenzie (Short Term Outlook
January 2021).
92
Endnotes: Steelmaking Coal
Slide 82: High-Quality Steelmaking Coal Business
1. As at December 31, 2020, Teck portion, excluding oxide. Based on Teck’s 2020 Annual Information Form.
Slide 84: Steelmaking Coal Unit Costs
1. Steelmaking coal unit costs are reported in Canadian dollars per tonne. Non-GAAP financial measures. See “Non-GAAP Financial Measures” slides.
Slide 85: Setting Up for Strong Long-Term Cash Flows in Steelmaking Coal
1. EBITDA is a non-GAAP financial measure. See “Non-GAAP Financial Measures” slides.
Slide 86: Steelmaking Coal Continues to Deliver Exceptional Returns
1. As at February 17, 2021. The sensitivity of our annual profit attributable to shareholders and EBITDA to changes in the Canadian/U.S. dollar exchange rate and commodity prices, before pricing adjustments, based on our current balance sheet,
our 2021 mid-range production estimates, current commodity prices and a Canadian/U.S. dollar exchange rate of $1.30. See Teck’s Q4 2020 press release for further details.
2. All production estimates are subject to change based on market and operating conditions.
3. The effect on our profit attributable to shareholders and on EBITDA of commodity price and exchange rate movements will vary from quarter to quarter depending on sales volumes. Our estimate of the sensitivity of profit and EBITDA to changes
in the U.S. dollar exchange rate is sensitive to commodity price assumptions. EBITDA is a non-GAAP financial measure. See “Non-GAAP Financial Measures” slides.
4. Productivity reflects performance of Teck’s waste haul truck fleet against an internal baseline standard haulage model (SHM) that anticipates an expected rate of material movement per equipment operating hour taking into account size of truck
fleet, haul distance, grade and other road design elements.
Slide 87: Sustain Production Capacity and Productivities in Steelmaking Coal
1. Historical spend has not been adjusted for inflation or foreign exchange. 2021-2025 average spend assumes annualized average production of 27 million tonnes. All dollars referenced are Teck’s portion net of POSCAN credits for Greenhills
Operations at 80% and excludes the portion of sustaining capital relating to water treatment. Sustaining capital is now inclusive of production capacity investments previous called Major Enhancement. Excludes capital leases and growth capital.
Slide 89: Quality and Basis Spreads
1. HCC price is average of the Argus Premium HCC Low Vol, Platts Premium Low Vol and TSI Premium Coking Coal assessments, all FOB Australia and in US dollars. SHCC price is average of the Platts HCC 64 Mid Vol and TSI HCC
assessments, all FOB Australia and in US dollars. Source: Argus, Platts, TSI. Plotted to February 10, 2021.
2. Seaborne HCC CFR China price is average of the Argus Premium HCC Low Vol, Platts Premium Low Vol and TSI Premium Coking Coal assessments, all CFR China and in US dollars. Domestic HCC CFR China is Liulin #4 normalized to CFR
Jingtang Port in US dollars. Source: Argus, Platts, TSI, Sxcoal. Plotted to February 5, 2021.
93
Copper
Business Unit & Markets
Supply Continues to be at Risk;
Copper Demand Improves
• Demand for imported cathode into China
stronger each quarter YOY in 2020
• Demand outlook ex-China improving
• 2021 mine production remains at risk with
ongoing disruptions
• Concentrate market tightness continues into
2021, COVID-19 restrictions to impact 2021
supply
• Scrap availability improving on higher prices
• Mine growth to resume in 2022 and peak in
2024, with multi year gap for next projects due
to COVID-19 and subject to future copper price
• Global stimulus positive for metals demand,
risk that further lockdowns could affect
short-term consumer demand
95
Copper Market
Raw materials weigh on downstream production
• Demand for raw materials and mine
disruptions kept concentrate demand high
‒ Mine production cuts over 1.4 Mt vs.
smelter cuts of ~400 kt
‒ Chinese smelters and rod mills operate
through Lunar New Year
‒ Spot TC/RC drop to high $20s – low 30s
• Scrap availability improving on higher prices
and change in scrap import classification
‒ Loss of scrap impacts supply and
increases cathode demand
• LME/SHFE stocks fall through 2021,
LME price and Chinese premiums rise
• Chinese cathode premiums US$60-65 per
tonne in Q1 2021
Copper Scrap is 18% of Supply and 20% of Total Demand2
Scrap Demand Increases on Higher Copper Price1
96
Cathode Demand 23.6 Mt Copper Demand 29.6 Mt
Wire Rod
74%
Billet 13%
Cable/Slab
13% Electrical
Network
28%
Construction
28%
Industrial
Machinery
11%
Consumer
& General
21%
Transport
12%
(1,000)
-
1,000
2,000
3,000
Jan-19 Apr-19 Jul-19 Oct-19 Jan-20 Apr-20 Jul-20 Oct-20 Jan-21
RMB/Mt
Price Spread between #1 Bare Bright Copper and Copper Cathode
Rational Price Spread
• Chinese mine production flat to 2024 on lack of resources
• Total probable projects: 900 kmt
Mine kmt
Kamoa – Kakula 535
PT – Freeport (vs 2019) 435
Quebrada Blanca 2 300
Quellaveco to 2024 275
Cobre Panama 252
China to 2024 345
All others (Spence, Chuqui UG, Escondida) 1,090
SXEW Reductions to 2024 (360)
Reductions & Closures (654)
Mine Production Set To Increase 2.2 Mt By 20241
Includes:
97
Global Copper Mine Production Increasing Slowly
12,000
14,000
16,000
18,000
20,000
22,000
2018 2019 2020 2021 2022 2023 2024 2025 2026 2027
Other China
PT Freeport Cobre Panama
Quellaveco Quebrada Blanca
Kamoa-Kakula New Mines
Global Copper Mine Production2 (kt contained)
98
$20
$30
$40
$50
$60
$70
$80
$90
$100
$110
$120
Annual/Mid Year Spot
TC/RCs Spot and Annual Falling1 (US$/lb)
Copper Disruptions Continue To Impact Mines
Disruptions (kt)2;
-1,800
-1,600
-1,400
-1,200
-1,000
-800
-600
-400
-200
0
2005 2007 2009 2011 2013 2015 2017 2019 2021
3.6%
2.7%
4.0%
6.5%
Reported
to Date
7.0%
Run Rate
Rapid Growth in Chinese Copper Smelter Capacity
China added 3.2 Mt since 2019 (2.1 Mt still ramping up)
99
Chinese Copper Mine Growth1
(kt)
0
100
200
300
400
2021
137kt
2022
130 kt
2023
25 kt
0
100
200
300
400
+2.1 Mt of New Smelting Capacity2
(kt blister)
2020
510 kt
2021 – 2023
1,615 kt
Copper Supply
Chinese imports shift to concentrates to feed smelter capacity increases
100
Chinese Imports Shift to Concentrates3
(Copper content, kt)
0
2,000
4,000
6,000
8,000
10,000
12,000
2016 2017 2018 2019 2020 2021e 2022e
Concentrates Blister Scrap Cathode
Chinese Scrap/Blister Imports Fall2
(Copper content, kt)
0
500
1,000
1,500
2,000
2,500
2013 2014 2015 2016 2017 2018 2019 2020 2021e 2022e
Blister Scrap
• Cathode imports could drop in 2021, after tight concentrates
and scrap market in 2020 saw record cathode imports
• Concentrates imports will continue to rise on smelter demand
• Reclassified scrap/blister could now rise off the
lows of 2020
Copper Metal Stocks
Raw material shortages increase cathode demand
• Exchange stocks have fallen 440kt since March
2020, now equivalent to 3.0 days of global
consumption – lowest level in a decade
• SHFE stocks have decreased ~310kt since
Lunar New Year 2020
• Strong arbitrage drew inventories into China,
cathode imports up 36% or 1.2 Mt in 2020
• Over 77% of visible global copper inventories
including bonded, are now in China
• Prices decreased -25% between January 16, 2020
and March 23, 2020; prices ended the year up 19%
and are now up 63% from the March 2020 lows
• Expected increase in Chinese stocks with LNY has
not occurred in 2020 as lockdown allowed wire/rod
mills to continue to operate.
101
Daily Copper Prices (US$/mt) and Stocks1 (kt)
0
200
400
600
800
1,000
1,200
1,400
1,600
1,800
$0
$2,000
$4,000
$6,000
$8,000
$10,000
$12,000
2011
2012
2013
2014
2015
2016
2017
2018
2019
2020
2021
LME Stocks Comex
SHFE Bonded Estimate
Price
Long Life and Stable Assets in Copper
102
Antamina Highland Valley
• Performing well with
workforce returning to
normal levels
• 2021 guidance of 91,000 to
95,000 tonnes copper
• Zinc production guidance
remaining high at 95,000 to
100,000 tonnes in 2021
• Harder ores impacting
throughput
• 2021 guidance of 128,000
to 133,000 tonnes copper
• RACE21TM application of
processing analytics to
optimize throughput and
recovery
Carmen de Andacollo
• Production rates
maintained
• 2021 guidance of 46,000 to
51,000 tonnes copper
• Lower copper grades in
2021
• RACE21TM application of
processing analytics to
optimize throughput and
recovery
Quebrada Blanca
• Performing well with
production extended to end
of 2021
• 2021 guidance of 10,000 to
11,000 tonnes copper
• QB2 first production
expected H2 2022
• QB2 will double Teck’s
copper production
Foundation of stable operations, substantial near-term growth
Operations Improvement and
Cash Flow Focus in Copper
Productivity & Cost Management
• Focus on reliability and maintenance
and cross site sharing
• RACE21TM and continuous
improvement pipeline driving benefits
across sites – a key driver of margins
• Cost reductions embedded in plans
103
Focused Investment Priorities
• Key water, tailings and regulatory projects
drive sustaining capital requirements
• Near-term higher sustaining spending
from tailings facility costs at Antamina
• Long-term sustaining capex (2024+)
in copper expected at $125 million,
excluding QB2 and life extension projects
Copper Unit Costs
104
Operating Cost1 Breakdown in 2020
Labour 30%
Contractors and Consultants 11%
Operating Supplies 16%
Repairs and Maintenance Parts 16%
Energy 20%
Other 6%
Total 100%
Operating Costs
47%
Unit Costs1 in 2020
Royalties
2%
Depreciation
and
Amortization
24%
Transportation
6%
Operating Costs
68%
Endnotes: Copper
Slide 96: Copper Market
1. Source: Shanghai Metal Market.
2. Source: Wood Mackenzie.
Slide 97: Global Copper Mine Production Increasing Slowly
1. Source: Data compiled by Teck based on information from Wood Mackenzie and Company Reports (average production first 10 years).
2. Source: Data compiled by Teck based on information from Wood Mackenzie and Teck’s analysis of publicly available quarterly financial reports and other public disclosures of various entities.
Slide 98: Copper Disruptions Return to Impact Mines
1. Source: Data compiled by Teck based on information from Wood Mackenzie, CRU, and Metal Bulletin.
2. Source: Data compiled by Teck based on information from Wood Mackenzie and Teck’s analysis of publicly available quarterly financial reports and other public disclosures of various entities.
Slide 99: Rapid Growth in Chinese Copper Smelter Capacity
1. Includes mine projects with copper capacity >10 ktpa. Source: BGRIMM.
2. Source: BGRIMM, SMM, Teck.
Slide 100: Copper Supply
1. Source: Wood Mackenzie, GTIS, BGRIMM, SMM.
2. Source: Wood Mackenzie, GTIS, BGRIMM, SMM.
Slide 101: Copper Metal Stocks
1. Source: LME, Comex, SHFE, SMM.
Slide 104: Copper Unit Costs
1. Copper unit costs are reported in US dollars per pound. Non-GAAP financial measures. See “Non-GAAP Financial Measures” slides.
105
Zinc
Business Unit & Markets
Zinc Mines Return
Zinc mine supply still at risk, pressure on smelters continues
• COVID-19 and poor financials resulted in
numerous mine suspensions and closures,
eliminating significant production in 2020
• While mines restarted after COVID shutdowns,
many SA mines are still slow to return, resulting
in tight concentrate market impacting production
at some smelters in China
• Chinese and ROW manufacturing restarted with
consumption driven by infrastructure, construction
and automotive
• Despite roll-out of vaccines, escalating cases of
COVID-19 and the continued economic impact
increase concerns for future supply and demand
of zinc in 2021
107
Zinc Market
Raw materials shortages and improving demand support prices
• Demand for raw materials and mine disruptions
due to COVID-19 kept concentrate demand strong
‒ Mine production in 2020 estimated decline >1Mt,
while smelter cuts were only ~300 kt
‒ Ongoing spread of the virus and COVID-19
protocols is expected to impact production in 2021
‒ Despite return of mine production, concentrate
supply remains tight, TCs down -77% from
February 2020 peak, currently <$70/dmt
‒ Conc market expected to remain tight in 2021;
Gamsberg pit failure likely to further impact supply
• Construction, infrastructure, and automobile demand
driving zinc demand in China
‒ Galvanized utilization rates fell slightly in
December to 91%, well above 78% LT average
‒ China zinc premiums remained above ~US$100
per tonne, for the 4th straight month
Zinc Use Tied to the Protection of Steel 60% of Total Demand2
Steel Demand in China Supporting Zinc Price1
25
50
75
100
Jun-17 Dec-17 Jun-18 Dec-18 Jun-19 Dec-19 Jun-20
Operating
Rates
%
Total Smelter Operating Rates Large Zinc Smelters
Operating Rates at Galvanizers
108
Zinc Demand 13.1 Mt Zinc End Uses 13.1 Mt
Consumer
Products
6%
Construction
51%
Transport
20%
Industrial
Machinery
7%
Infrastructure
16%
Galvanizing
52%
Oxides &
Chemical
7%
Brass &
Semi Cast
16%
Semi-
Manufactured
6%
Die Cast
Alloys
15%
Other
4%
0
1,000
2,000
3,000
4,000
5,000
6,000
7,000
2013
2014
2015
2016
2017
2018
2019
2020
2021
2022
0
1,000
2,000
3,000
4,000
5,000
6,000
7,000
2013
2014
2015
2016
2017
2018
2019
2020
2021
2022
Chinese Mine and Smelter Production
Mine production flat while smelter production increases
109
Chinese Refined Production Up 9% Since 20182
(kt Contained)
Chinese Mine Production Down 1% Since 20181
(kt Contained)
Delayed projects and decreasing ore grades continue to impact Chinese mines
while smelter production increases
3.4
3.6
3.8
4.0
100
350
270
180
300
250 237
392
495
360
200
-630
83
-38
-153
40
-50
85
-800
-600
-400
-200
0
200
400
600
Early-year estimate Adjusted estimate
Global Mine Production Remains Under Pressure
Ongoing risk to supply growth in 2021
110
Estimated Chinese Zinc Mine Growth
Rarely Achieved1 (Kmt Contained)
Zinc Ore Grades Falling at Chinese Mines3
(Ore grade, zinc %)
-4,000
-3,000
-2,000
-1,000
0
1,000
New Mines China Mines ROW Mines Change
Changes in Mine Production Since Q1 20182
0
200
400
600
800
1,000
1,200
1,400
1,600
Jan-12
Aug-12
Mar-13
Oct-13
May-14
Dec-14
Jul-15
Feb-16
Sep-16
Apr-17
Nov-17
Jun-18
Jan-19
Aug-19
Mar-20
Oct-20
Domestic Commercial Stocks Bonded Stocks
Smelter + Consumer Stocks
503
770 788
627 627
1,213 1,179
1,247
0
200
400
600
800
1,000
1,200
1,400
1,600
2016
2017
2018
2019
2020E
2021E
2022E
2023E
Stocks Continue to Decrease
While Refined Production Increases in China
111
Additional Zinc Metal
Required to Fill the Gap3 (kt)
De-stocking Continues
Chinese Stocks at Record Lows1,2 (kt)
• 2020 stocks down despite lower Q1 consumption due to COVID-19
• Seasonal stock increase did not happen during 2021 Lunar New Year
• Additional metal required to meet 2021 demand
• Following the return of Chinese mine production
after COVID-19 shutdowns, increasing smelter
production kept China reliant on imported
concentrate
• Chinese mine production was expected to
increase in 2020; decreasing ore grades and
delayed projects kept production down -2% YoY
• Mine production slowly recovering in Bolivia, Peru,
and Mexico, after losing >1.0Mt of production in
2020; but Peru ongoing 4 week lockdown and
spread of COVID-19 could lead to further cuts
• 2021 mine production expected to grow 7.0%, but
the Gamsberg pit failure could lead to further cuts
Zinc Supply
Mine production expected to grow in 2021, but remains at risk due to COVID-19
112
Zinc Mine Production1 (kt contained)
0
2,000
4,000
6,000
8,000
10,000
12,000
14,000
16,000
2017 2018 2019 WM Q4
2019 F
2020 2021 2022 2023
ROW Others China
Glencore Dugald River
Gamsberg New Century
New Mines WM Pre-Covid 2020 Forecast
Zinc Concentrate Treatment Charges
Treatment Charges1 (USD/dmt)
113
0
50
100
150
200
250
300
350
Spot TC Benchmark TC
Spot TCs
down -77%
vs. Feb 2020 peak
Zinc Metal Stocks
COVID-19 related decrease in demand resulting in minor inventory build
• Deficits over past 5 years drove down stocks,
with total stocks at only 10 days of global
consumption compared to a normal 19 days
• Despite demand returning, overall refined zinc
stocks have increased in 2021
• LME stocks increased while stocks in China fell;
Total stocks down ~20% since mid-March 2020
- LME stock build from excess metal
accumulated during COVID-19 lockdowns
- LME warehouses incentivizing traders to
lock up metal on exchange in rent deals
- Despite Chinese smelter production
increasing, SHFE stocks decreased >80%
since China reopened after Q1 shutdowns
due to stronger demand
114
Daily Zinc Prices1,2 (US$/mt)
and Stocks1,2 (kmt)
0
500
1,000
1,500
2,000
2,500
0
500
1,000
1,500
2,000
2,500
3,000
3,500
4,000
2010
2011
2012
2013
2014
2015
2016
2017
2018
2019
2020
2021
LME Stocks Bonded SHFE Price
Largest Global Net Zinc Mining Companies
Teck is the Largest Net Zinc Miner1(kt)
Provides significant exposure to a rising zinc price
115
0
50
100
150
200
250
300
350
400
Teck
Public Company
Private Company
Integrated Zinc Business
116
Red Dog Trail
• Operations maintained with travel restrictions
and modified schedules
• Temporary water-related restrictions removed
from mine plan
• 2021 guidance of 490,000 to 510,000 tonnes
zinc
• Lower zinc sales in H1 2021, particularly in
Q2 2021 due to lower 2020 production
• VIP2 project is helping to offset lower grades
• Operations performing well
• 2021 guidance of 300,000 to 310,000 tonnes
refined zinc
• Refined lead and silver production similar to
prior years in 2021 but will fluctuate
• Focus on margin improvement including
RACE21TM implementation
Strengthening our zinc business
Operations Improvement and
Cash Flow Focus in Zinc
Productivity
• Focus on asset management and cross
site sharing
• RACE21TM and continuous
improvement pipeline driving benefits
across sites – a key driver of margins
• Cost reductions embedded in plans
117
Focused Investment Priorities
• Key water, tailings and regulatory projects
drive sustaining capital requirements
• Near term higher sustaining spending from
tailings related projects at Red Dog and air
quality and asset renewal at Trail
• Long-term sustaining capex (2024+) in zinc
expected at $150 million, excluding life
extension projects
Red Dog Sales Seasonality
• Operates 12 months
• Ships ~ 4 months
• Shipments to inventory in Canada
and Europe; Direct sales to Asia
• ~65% of zinc sales in second half
of year
• ~100% of lead sales in second half
of year
• Sales seasonality causes net cash
unit cost seasonality
118
Zinc Sales 1 (%)
Lead Sales1 (%)
21%
16%
31% 32%
0%
10%
20%
30%
40%
Q1 Q2 Q3 Q4
0% 1%
66%
33%
0%
20%
40%
60%
80%
Q1 Q2 Q3 Q4
Red Dog Net Cash Unit Cost Seasonality
Five-Year Average Red Dog Net Cash Unit Costs1 (US$/lb)
119
• Seasonality of Red Dog unit costs largely due to lead sales during the shipping season
• Higher net cash unit costs expected in 2021 compared to 2020 due primarily to lower
production volumes in 2020, as well as lower contribution from silver by-products
-
0.20
0.40
0.60
Q1 Q2 Q3 Q4
Zinc Unit Costs
120
Operating Cost1 Breakdown in 2020
Labour 35%
Contractors and Consultants 10%
Operating Supplies 11%
Repairs and Maintenance Parts 9%
Energy 18%
Other 17%
Total 100%
Operating Costs
47%
Unit Costs1 in 2020
Depreciation
and
Amortization
24% Operating Costs
68%
Depreciation and
Amortization
13%
Operating
Costs
38%
Transportation
12%
Concentrate
Purchases
26%
Royalties
11%
Red Dog in Bottom Quartile of Zinc Cost Curves
Higher zinc prices reduce risk of economic closures
Total Cash + Capex Cost Curve 20201 (US¢/lb)
121
0
20
40
60
80
100
120
140
160
180
200
0% 25% 50% 75% 100%
2020 Costs Based on Current Prices Current Spot LME Price
RED DOG
Red Dog Extension Project
Long Life Asset
• Aktigiruq exploration target of 80-150 Mt
@ 16-18% Zn + Pb1
• Anarraaq Inferred Resource2: 19.4 Mt
@14.4% Zn, 4.2% Pb
Quality Project
• Premier zinc district
• Significant mineralized system
• High grade
Stable Jurisdiction
• Operating history
• ~12 km from Red Dog operations
122
Qanaiyaq
Aktigiruq
Anarraaq
Paalaaq
Su-Lik
Aqqaluk
Main
Looking Northwest
Endnotes: Zinc
Slide 108: Zinc Market
1. Source: Shanghai Metal Market.
2. Source: Based on information from the International Zinc Study Group Data.
Slide 109: Chinese Mine and Smelter Production
1. Source: Data compiled by Teck based on information from BGRIMM, CNIA, Antaike.
2. Source: Data compiled by Teck based on information from BGRIMM, CNIA, Antaike.
Slide 110: Global Mine Production Remains Under Pressure
1. Source: Data compiled by Teck based on information from BGRIMM, CNIA, Antaike. Early year estimates from consolidation of several analyst views in the year preceding.
2. Source: Data compiled by Teck based on information from BGRIMM, CNIA, Antaike.
3. Source: Data compiled by Teck based on information from BGRIMM, CNIA, Antaike., NBS.
Slide 111: Stocks Continue to Decrease While Refined Production Increases in China
1. Source: Data compiled by Teck Analysis based on information from SHFE, SMM,
2. Source: ”Smelter + consumer stocks” refers to zinc metal held in the plants of smelters and semi producers and those on the road; ”Bonded stocks” refers to zinc stored in bonded zones and will need to complete Customs clearance before
entering China; ”Domestic commercial stocks” refers to zinc stored in SHFE warehouses and other domestic commercial warehouses not registered in SHFE.
3. Source: Data compiled by Teck Analysis based on historic numbers from China Customs, and forecasts based on data from BGRIMM, Antaike and Teck’s commercial contacts.
Slide 112: Zinc Supply
1. Source: Data compiled by Teck based on information from Wood Mackenzie, BGRIMM, CNIA, Antaike and Teck analysis.
Slide 113: Zinc Concentrate Treatment Charges
1. Source: Wood Mackenzie.
Slide 114: Zinc Metal Stocks
1. Source: Data compiled by Teck from information from LME, SHFE, SMM.
2. Source: Data compiled by Teck from information from LME, Fastmarkets, Argus, Acuity, company reports.
Slide 115: Largest Global Net Zinc Mining Companies
1. Source: Data compiled by Teck from information from Wood Mackenzie – Company smelter production netted against company mine production on an equity basis.
Slide 118: Red Dog Sales Seasonality
1. Average sales from 2016 to 2020.
Slide 119: Red Dog Net Cash Unit Cost Seasonality
1. Average quarterly net cash unit cost in 2016 to 2020, before royalties. Based on Teck ‘s reported financials. Net cash unit cost is a non-GAAP financial measure. See “Non-GAAP Financial Measures” slides.
Slide 120: Zinc Unit Costs
1. Zinc unit costs are reported in US dollars per pound. Non-GAAP financial measures. See “Non-GAAP Financial Measures” slides.
Slide 121: Red Dog in Bottom Quartile of Zinc Cost Curves
1. Source: Data compiled by Teck from information from Wood Mackenzie, LME – Based on WM Forecast information and estimates for 2020 based on current short term average prices.
Slide 122: Red Dog Extension Project
1. Aktigiruq is an exploration target, not a resource. Refer to press release of September 18, 2017, available on SEDAR. Potential quantity and grade of this exploration target is conceptual in nature. There has been insufficient exploration to
define a mineral resource and it is uncertain if further exploration will result in the target being delineated as a mineral resource.
2. Based on Teck’s 2020 Annual Information Form.
123
Energy
Business Unit & Markets
Energy Benchmark Pricing
Calendar NYMEX WTI Price1 , WTI/WCS Basis Differential at Hardisty2
and WTI/WCS Basis Differential at the US Gulf Coast3 (US$/bbl)
125
(10)
-
10
20
30
40
50
60
70
80
(10)
0
10
20
30
40
50
60
70
80
Jan-17 Jun-17 Nov-17 Apr-18 Sep-18 Feb-19 Jul-19 Dec-19 May-20 Oct-20 Mar-21
Calendar NYMEX WTI Price WTI/WCS Basis Differential at Hardisty WTI/WCS Basis Differential at the USGC
0
50
100
150
200
250
Q1 Q2 Q3 Q4 Q1 Q2 Q3 Q4 Q1 Q2 Q3 Q4
2018 2019 2020
Production @ 100%
(kbpd)
Fort Hills is A Modern Oil Sands Mine
126
Curtailed
De-bottleneck potential
Best monthly
production rate
(201 kbpd)
• Higher quality partially de-carbonized Paraffinic
Froth Treatment (PFT) product; lower greenhouse
gas (GHG) emissions
• Partners commenced a phased re-start of the
second train in Q4 2020, earlier than previously
anticipated
• Assessing plans to increase production to capacity
as business environment continues to improve
• Government of Alberta production limits relaxed in
Q4 20201
• Focused on operational excellence to reduce
operating costs and capital efficiency
Start-up
Temporarily reduced
production due to
COVID-19 and low
WCS prices
Fort Hills is a quality asset with significant upside potential
127
0
20
40
60
80
Yale’s Environmental Performance Index
Of Top 10 Oil Reserve Countries
World Oil Producers
Ranked By Corruption and Volume1
Canada is a Leader in ESG
The world benefits from Fort Hills low carbon intensity product during transition to renewables
Canada should be a supplier of choice to reduce global emissions
Best In Class Low Carbon Intensity Production
Our Fort Hills blend can displace carbon intensive crudes
128
• Emissions intensity of Canadian oil sands
has declined by 25% - estimated
reduction of 15% to 20% by 2030
• PFT bitumen emissions from mining
significantly lower than others
• Fort Hills PFT currently the new bar for
low emissions
• Fort Hills will displace barrels of crude
from higher emitters
Source: Bloomberg, BMO Capital Markets
Total Life Cycle Emissions Intensity
(kg CO2e/bbl refined product – gasoline/diesel)
Lower carbon intensity than 50% of the US refined barrels of oil
Continuous Improvement in Emissions Intensity
Fort Hills emissions performance has been outstanding to date
129
• Recent analysis by IHS Markit shows
15% improvement in emissions intensity
of mined dilbit PFT in 2018
- Includes emissions during Fort Hills
ramp-up to full production where
emissions are typically higher
- Fort Hills total life cycle emissions
1.6% lower than the average crude oil
refined in the US
• Fort Hills performance in 2019 was
13% better than 2018 despite Alberta
Government curtailment
Fort Hills emissions are decreasing year-over-year
Fort Hills GHG Emissions
Emissions Boundaries
130
Well to Wheels
Upstream (Direct) Emissions
Image Source: IHS Markit; edited by Teck.
Downstream (Indirect) Emissions
Fort Hills Blend Widely Accepted In Market
A preferred feedstock and supplier of choice
We produce a high quality refinery feedstock
• Low GHG intensity: <50% of US crude supply
• Including in-situ and upgraded synthetic
Our sales mix provides diverse market access
• Pipeline connected with rail loading as needed
• Hardisty and US Gulf Coast core markets
131
8.0
28.5 Hardisty/US Gulf Coast Monthly Sales
Hardisty: Term Contracts
Teck Blend:
36.5 kbpd
Teck’s Expected Commercial Activities In 2021
Bitumen production 28.0 kbpd1
+ Diluent acquisition 8.5 kbpd
= Bitumen blend sales 36.5 kbpd
Teck’s Delivery Location (kbpd)
We are well positioned for future opportunities
Sufficient Pipeline Capacity as of 2022/2023
Differentials to improve on completed export capacity
132
3
4
5
6
2019 2020 2021 2022 2023 2024 2025
Total Available Supply
Current Market
Access
Pipe Optimization
Enbridge Line 3
TransMountain TMX
Rail
Near term:
• Rail shipments reduced in 2020 on
shut-in production, increasing in 2021
Pipeline development progressing:
• Enbridge: 370 kbpd (Q4 2021)
• TMX: 600 kbpd (Late Q4 2022)
Longer term:
• Global heavy refining capacity increase
• US, India and China largest heavy importers
Western Canada Crude Oil
Takeaway Capacity1
Endnotes: Energy
Slide 125: Energy Benchmark Pricing
1. The WTI CMA is an average of the daily settle quoted price for WTI prices for future deliveries for the trading days during a calendar month. Source: CME Group. As at February 22, 2021.
2. WCS at Hardisty: an index value determined during the trading period, which is typically the first 9 to 11 business days of the month prior to the month of delivery and does not include trades done after this trading period or during the month of
delivery. Sources: Net Energy and CalRock. As at February 22, 2021.
3. Source: Link, PVM and Platts. A simple average of Link brokerage, PVM and Platts assessments for the month of delivery during the trading period, which is typically the 25th of two months prior to the month of delivery to the 25th of the month
prior to the month of delivery. As at February 22, 2021.
Slide 126: Fort Hills is a Modern Mine
1. On, October 23, 2020, the Government of Alberta announced that it will not issue monthly production limits effective December 2020 production month. Since December 2020, operators will be able to produce above their previously issued
production limits without having to purchase curtailment credits or apply for Special Production Allowances. The curtailment rules have been extended to December 31, 2021, however, the Government of Alberta, will only issue Ministerial
Orders to limit production when they feel it is needed. If required, Ministerial Orders will be issued with 30-60 days’ notice to allow time for curtailed producers to respond and plan accordingly. The Fort Hills Partners continue to monitor the
business environment and assess plans to maximize cash flow, including the potential to increase production.
Slide 127: Canada is a Leader in ESG
1. Source: Transparency International Corruption Perceptions Index 2017 (y-axis). BP Statistical Review 2017 (x-axis).
Slide 131: Fort Hills Blend Widely Accepted In Market
1. Bitumen production assumes the mid-point of our 2021 production guidance range.
Slide 132: Sufficient Pipeline Capacity as of 2022/2023
1. Source: IHSMarkit, Teck.
133
Non-GAAP
Financial Measures
Non-GAAP Financial Measures
135
Our financial results are prepared in accordance with International Financial Reporting Standards (IFRS) as issued by the International Accounting Standards Board. This document refers to a number of Non-GAAP Financial
Measures which are not measures recognized under IFRS and do not have a standardized meaning prescribed by IFRS or Generally Accepted Accounting Principles (GAAP) in the United States.
The Non-GAAP Measures described below do not have standardized meanings under IFRS, may differ from those used by other issuers, and may not be comparable to such measures as reported by others. These measures
have been derived from our financial statements and applied on a consistent basis as appropriate. We disclose these measures because we believe they assist readers in understanding the results of our operations and
financial position and are meant to provide further information about our financial results to investors. These measures should not be considered in isolation or used in substitute for other measures of performance prepared in
accordance with IFRS.
We have changed our calculations of adjusted profit attributable to shareholders and adjusted EBITDA to include additional items that we have not previously included in our adjustments and have also changed our debt ratios to
compare debt and net debt to adjusted EBITDA rather than EBITDA. These changes were made from January 1, 2020 onwards and comparative figures have been restated to conform to the current period presentation. In
addition to items previously adjusted, our adjusted profit attributable to shareholders and adjusted EBITDA now include adjustments for environmental costs, including changes relating to the remeasurement of decommissioning
and restoration costs for our closed operations due to changes in discount rates, share-based compensation costs, inventory write-downs and reversals and commodity derivatives. We believe that by including these items,
which reflect measurement changes on our balance sheet, in our adjustments, our adjusted profit attributable to shareholders and adjusted EBITDA will reflect the recurring results of our core operating activities. This revised
presentation will help us and readers to analyze the rest of our results more clearly and to understand the ongoing cash generating potential of our business. With respect to our debt ratios, we believe that using adjusted
EBITDA, will present a more meaningful basis for us and the reader to understand the debt service capacity of our core operating activities.
Adjusted profit attributable to shareholders – For adjusted profit, we adjust profit attributable to shareholders as reported to remove the after-tax effect of certain types of transactions that reflect measurement changes on our
balance sheet or are not indicative of our normal operating activities. We believe adjusted profit helps us and readers better understand the results of our core operating activities and the ongoing cash generating potential of our
business.
Adjusted basic earnings per share – Adjusted basic earnings per share is adjusted profit divided by average number of shares outstanding in the period.
Adjusted diluted earnings per share – Adjusted diluted earnings per share is adjusted profit divided by average number of fully diluted shares in a period.
EBITDA – EBITDA is profit before net finance expense, provision for income taxes, and depreciation and amortization.
Adjusted EBITDA – Adjusted EBITDA is EBITDA before the pre-tax effect of the adjustments that we make to adjusted profit attributable to shareholders as described above.
The adjustments described above to profit attributable to shareholders and EBITDA highlight items and allow us and readers to analyze the rest of our results more clearly. We believe that disclosing these measures assists
readers in understanding the ongoing cash generating potential of our business in order to provide liquidity to fund working capital needs, service outstanding debt, fund future capital expenditures and investment opportunities,
and pay dividends.
Gross profit before depreciation and amortization – Gross profit before depreciation and amortization is gross profit with the depreciation and amortization expense added back. We believe this measure assists us and
readers to assess our ability to generate cash flow from our business units or operations.
Gross profit margins before depreciation – Gross profit margins before depreciation are gross profit before depreciation and amortization, divided by revenue for each respective business unit. We believe this measure
assists us and readers to compare margins on a percentage basis among our business units.
Unit costs – Unit costs for our steelmaking coal operations are total cost of goods sold, divided by tonnes sold in the period, excluding depreciation and amortization charges. We include this information as it is frequently
requested by investors and investment analysts who use it to assess our cost structure and margins and compare it to similar information provided by many companies in the industry.
Adjusted site cash cost of sales – Adjusted site cash cost of sales for our steelmaking coal operations is defined as the cost of the product as it leaves the mine excluding depreciation and amortization charges, out-bound
transportation costs and any one-time collective agreement charges and inventory write-down provisions.
Total cash unit costs – Total cash unit costs for our copper and zinc operations includes adjusted cash costs of sales, as described above, plus the smelter and refining charges added back in determining adjusted revenue.
This presentation allows a comparison of total cash unit costs, including smelter charges, to the underlying price of copper or zinc in order to assess the margin for the mine on a per unit basis.
Non-GAAP Financial Measures
136
Net cash unit costs – Net cash unit costs of principal product, after deducting co-product and by-product margins, are also a common industry measure. By deducting the co- and by-product margin per unit of the principal
product, the margin for the mine on a per unit basis may be presented in a single metric for comparison to other operations. Readers should be aware that this metric, by excluding certain items and reclassifying cost and
revenue items, distorts our actual production costs as determined under IFRS.
Adjusted cash cost of sales – Adjusted cash cost of sales for our copper and zinc operations is defined as the cost of the product delivered to the port of shipment, excluding depreciation and amortization charges, any
one-time collective agreement charges or inventory write-down provisions and by-product cost of sales. It is common practice in the industry to exclude depreciation and amortization as these costs are non-cash and discounted
cash flow valuation models used in the industry substitute expectations of future capital spending for these amounts.
Adjusted operating costs – Adjusted operating costs for our energy business unit is defined as the costs of product as it leaves the mine, excluding depreciation and amortization charges, cost of diluent for blending to
transport our bitumen by pipeline, cost of non-proprietary product purchased and transportation costs of our product and non-proprietary product and any one-time collective agreement charges or inventory write-down
provisions.
Cash margins for by-products – Cash margins for by-products is revenue from by- and co-products, less any associated cost of sales of the by and co-product. In addition, for our copper operations, by-product cost of sales
also includes cost recoveries associated with our streaming transactions.
Adjusted revenue – Adjusted revenue for our copper and zinc operations excludes the revenue from co-products and by-products, but adds back the processing and refining charges to arrive at the value of the underlying
payable pounds of copper and zinc. Readers may compare this on a per unit basis with the price of copper and zinc on the LME.
Adjusted revenue for our energy business unit excludes the cost of diluent for blending and non-proprietary product revenues, but adds back crown royalties to arrive at the value of the underlying bitumen.
Blended bitumen revenue – Blended bitumen revenue is revenue as reported for our energy business unit, but excludes non-proprietary product revenue, and adds back crown royalties that are deducted from revenue.
Blended bitumen price realized – Blended bitumen price realized is blended bitumen revenue divided by blended bitumen barrels sold in the period.
Operating netback – Operating netbacks per barrel in our energy business unit are calculated as blended bitumen sales revenue net of diluent expenses (also referred to as bitumen price realized), less crown royalties,
transportation and operating expenses divided by barrels of bitumen sold. We include this information as investors and investment analysts use it to measure our profitability on a per barrel basis and compare it to similar
information provided by other companies in the oil sands industry.
The debt-related measures outlined below are disclosed as we believe they provide readers with information that allows them to assess our credit capacity and the ability to meet our short and long-term financial obligations.
Net debt – Net debt is total debt, less cash and cash equivalents.
Debt to debt-plus-equity ratio – debt to debt-plus-equity ratio takes total debt as reported and divides that by the sum of total debt plus total equity, expressed as a percentage.
Net debt to net debt-plus-equity ratio – net debt to net debt-plus-equity ratio is net debt divided by the sum of net debt plus total equity, expressed as a percentage.
Debt to Adjusted EBITDA ratio – debt to adjusted EBITDA ratio takes total debt as reported and divides that by adjusted EBITDA for the twelve months ended at the reporting period, expressed as the number of times adjusted
EBITDA needs to be earned to repay all of the outstanding debt.
Net debt to Adjusted EBITDA ratio – net debt to adjusted EBITDA ratio is the same calculation as the debt to adjusted EBITDA ratio, but using net debt as the numerator.
Net debt to capitalization ratio – net debt to capitalization ratio is net debt divided by the sum of total debt plus equity attributable to shareholders. The ratio is a financial covenant under our revolving credit facility.
Non-GAAP Financial Measures
137
Reconciliation of Profit (Loss) and Adjusted Profit
(C$ in millions)
Three months ended
December 31, 2020
Three months ended
December 31, 2019
Year ended
December 31, 2020
Year ended
December 31, 2019
Profit (loss) attributable to shareholders $ (464) $ (1,835) $ (864) $ (605)
Add (deduct) on an after-tax basis:
Asset impairments 438 1,943 912 2,052
COVID-19 costs - - 233 -
Environmental costs 201 62 210 142
Inventory write-downs 15 34 91 41
Share-based compensation 21 4 34 3
Commodity derivative losses (gains) (15) 1 (46) (13)
Debt prepayment option gain - - - (77)
Loss on debt redemption or purchase - - 8 166
Taxes and other 52 14 (17) (12)
Adjusted profit attributable to shareholders $ 248 $ 223 $ 561 $ 1,697
Adjusted basic earnings per share $ 0.47 $ 0.40 $ 1.05 $ 3.03
Adjusted diluted earnings per share $ 0.46 $ 0.40 $ 1.04 $ 3.00
Non-GAAP Financial Measures
138
(Per share amounts)
Three months ended
December 31, 2020
Three months ended
December 31, 2019
Year ended
December 31, 2020
Year ended
December 31, 2019
Basic earnings (loss) per share $ (0.87) $ (3.33) $ (1.62) $ (1.08)
Add (deduct):
Asset impairments 0.82 3.52 1.71 3.67
COVID-19 costs - - 0.44 -
Environmental costs 0.37 0.11 0.39 0.25
Inventory write-downs 0.03 0.06 0.17 0.07
Share-based compensation 0.04 0.01 0.06 0.01
Commodity derivative losses (gains) (0.03) - (0.09) (0.02)
Debt prepayment option gain - - - (0.13)
Loss on debt redemption or purchase - - 0.01 0.29
Taxes and other 0.11 0.03 (0.02) (0.03)
Adjusted basic earnings per share $ 0.47 $ 0.40 $ 1.05 $ 3.03
Reconciliation of Basic Earnings (Loss) Per Share to Adjusted Basic Earnings (Loss) Per Share
Non-GAAP Financial Measures
139
(Per share amounts)
Three months ended
December 31, 2020
Three months ended
December 31, 2019
Year ended
December 31, 2020
Year ended
December 31, 2019
Diluted earnings (loss) per share $ (0.87) $ (3.33) $ (1.62) $ (1.08)
Add (deduct):
Asset impairments 0.82 3.49 1.70 3.63
COVID-19 costs - - 0.43 -
Environmental costs 0.37 0.11 0.39 0.25
Inventory write-downs (reversals) 0.03 0.06 0.17 0.07
Share-based compensation 0.04 0.01 0.07 0.01
Commodity derivative losses (gains) (0.03) - (0.09) (0.02)
Debt prepayment option gain - - - (0.13)
Loss on debt redemption or purchase - - 0.01 0.29
Taxes and other 0.10 0.06 (0.02) (0.02)
Adjusted diluted earnings per share $ 0.46 $ 0.40 $ 1.04 $ 3.00
Reconciliation of Diluted Earnings (Loss) Per Share to Adjusted Diluted Earnings Per Share
(C$ in millions)
Twelve months ended
December 31, 2019
Twelve months ended
December 31, 2020
Profit (loss) $ (588) $ (944)
Finance expense net of finance income 218 268
Provision for (recovery of) income taxes 120 (192)
Depreciation and amortization 1,619 1,510
EBITDA $ 1,369 $ 642
Add (deduct):
Asset impairments 2,690 1,244
COVID-19 costs - 336
Environmental costs 197 270
Inventory write-downs 60 134
Share-based compensation 4 47
Commodity derivative gains (17) (62)
Debt prepayment option gain (105) -
Loss on debt redemption or purchase 224 11
Taxes and other 51 (52)
Adjusted EBITDA (B) $ 4,473 (A) $ 2,570
Non-GAAP Financial Measures
140
Reconciliation of Net Debt to Adjusted EBITDA Ratio
(C$ in millions)
Twelve months ended
December 31, 2019
Twelve months ended
December 31, 2020
Total debt at period end (D) $ 4,834 (C) $ 6,947
Less: cash and cash equivalents at period end (1,026) (450)
Net debt (F) $ 3,808 (E) $ 6,497
Debt to adjusted EBITDA ratio (D/B) 1.1 (C/A) 2.7
Net debt to adjusted EBITDA ratio (F/B) 0.9 (E/A) 2.5
Equity attributable to shareholders of the company (H) 21,304 (G) 20,039
Obligation to Neptune Bulk Terminals (J) - (I) 138
Adjusted net debt to capitalization ratio (F+J)/(D+J+H) 0.15 (E+I)/(C+I+G) 0.24
Non-GAAP Financial Measures
We include net debt measures as we believe they provide readers with information that allows them to assess our credit capacity and the ability to meet
our short and long-term financial obligations, as well as providing a comparison to our peers. 141
Reconciliation of Net Debt to Adjusted EBITDA Ratio - Continued
Non-GAAP Financial Measures
142
(C$ in millions)
Three months ended
December 31, 2020
Three months ended
December 31, 2019
Year ended
December 31, 2020
Year ended
December 31, 2019
Profit (loss) $ (473) $ (1,855) $ (944) $ (588)
Finance expense net of finance income 44 46 268 218
Provision for (recovery of) income taxes (76) (510) (192) 120
Depreciation and amortization 406 415 1,510 1,619
EBITDA $ (99) $ (1,904) $ 642 $ 1,369
Add (deduct):
Asset impairments 597 2,519 1,244 2,690
COVID-19 costs - - 336 -
Environmental costs 258 85 270 197
Inventory write-downs 23 51 134 60
Share-based compensation 29 6 47 4
Commodity derivative losses (gains) (20) 2 (62) (17)
Debt prepayment option gain - - - (105)
Loss on debt redemption or purchase - - 11 224
Taxes and other 51 26 (52) 51
Adjusted EBITDA $ 839 $ 785 $ 2,570 $ 4,473
Reconciliation of EBITDA and Adjusted EBITDA
Non-GAAP Financial Measures
143
Reconciliation of Gross Profit Before Depreciation and Amortization
(C$ in millions)
Three months ended
December 31, 2020
Three months ended
December 31, 2019
Year ended
December 31, 2020
Year ended
December 31, 2019
Gross profit $ 505 $ 460 $ 1,333 $ 3,340
Depreciation and amortization 406 415 1,510 1,619
Gross profit before depreciation and amortization $ 911 $ 875 $ 2,843 $ 4,959
Reported as:
Copper
Highland Valley Copper $ 185 $ 117 $ 476 $ 395
Antamina 210 164 566 614
Carmen de Andacollo 63 (14) 170 89
Quebrada Blanca 12 (28) 30 (18)
470 239 1,242 1,080
Zinc
Trail Operations 27 (10) 65 -
Red Dog 188 210 717 837
Pend Oreille - - - (4)
Other 2 (15) 33 (2)
217 185 815 831
Steelmaking coal 248 448 1,009 2,904
Energy (34) 3 (223) 144
Gross profit before depreciation and amortization $ 911 $ 875 $ 2,843 $ 4,959
Non-GAAP Financial Measures
144
(C$ in millions)
Three months ended
December 31, 2020
Three months ended
December 31, 2019
Year ended
December 31, 2020
Year ended
December 31, 2019
Revenues
Copper (A) $ 820 $ 592 $ 2,419 $ 2,469
Zinc (B) 739 745 2,700 2,968
Steelmaking coal (C) 861 1,105 3,375 5,522
Energy (D) 140 213 454 975
Total $ 2,560 $ 2,655 $ 8,948 $ 11,934
Gross profit (loss) before depreciation and amortization
Copper (E) $ 470 $ 239 $ 1,242 $ 1,080
Zinc (F) 217 185 815 831
Steelmaking coal (G) 248 448 1,009 2,904
Energy (H) (24) 3 (223) 144
Total $ 911 $ 875 $ 2,843 $ 4,959
Gross profit margins before depreciation
Copper (A/E) 57% 40% 51% 44%
Zinc (B/F) 29% 25% 30% 28%
Steelmaking coal (C/G) 29% 41% 30% 53%
Energy (D/H) (17)% 1% (49)% 15%
Reconciliation of Gross Profit (Loss) Margins Before Depreciation
Non-GAAP Financial Measures
1. Average period exchange rates are used to convert to US$ per pound equivalent.
We include unit cost information as it is frequently requested by investors and investment analysts who use it to assess our cost structure and margins
and compare it to similar information provided by many companies in our industry. 145
(C$ in millions, except where noted)
Three months ended
December 31, 2020
Three months ended
December 31, 2019
Year ended
December 31, 2020
Year ended
December 31, 2019
Revenue as reported $ 820 $ 592 $ 2,419 $ 2,469
By-product revenue (A) (104) (68) (300) (311)
Smelter processing charges (B) 40 38 140 164
Adjusted revenue $ 756 $ 562 $ 2,259 $ 2,322
Cost of sales as reported $ 452 $ 462 $ 1,560 $ 1,852
Less:
Depreciation and amortization (102) (109) (383) (463)
Inventory (write-downs) provision reversal - (20) - (24)
Labour settlement and strike costs - (22) - (35)
By-product cost of sales (C) (29) (19) (71) (58)
Adjusted cash cost of sales (D) $ 321 $ 292 $ 1,106 $ 1,272
Payable pounds sold (millions) (E) 172.7 158.5 591.7 641.7
Per unit amounts (C$/lb)
Adjusted cash cost of sales (D/E) $ 1.86 $ 1.84 $ 1.87 $ 1.98
Smelter processing charges (B/E) 0.23 0.24 0.23 0.26
Total cash unit costs (C$/lb) $ 2.09 $ 2.08 $ 2.10 $ 2.24
Cash margin for by-products (C$/lb) ((A-C)/E) (0.43) (0.31) (0.39) (0.39)
Net cash unit costs (C$/lb) $ 1.66 $ 1.77 $ 1.71 $ 1.85
US$ AMOUNTS1
Average exchange rate (C$/US$) $ 1.30 $ 1.32 $ 1.34 $ 1.33
Per unit amounts (US$/lb)
Adjusted cash cost of sales $ 1.42 $ 1.40 $ 1.39 $ 1.49
Smelter processing charges 0.18 0.18 0.18 0.19
Total cash unit costs (US$/lb) $ 1.60 $ 1.58 $ 1.57 $ 1.68
Cash margin for by-products (US$/lb) (0.33) (0.24) (0.29) (0.29)
Net cash unit costs (US$/lb) $ 1.27 $ 1.34 $ 1.28 $ 1.39
Copper Unit Cost Reconciliation
Non-GAAP Financial Measures
1. Red Dog and Pend Oreille (closed in July 2019).
We include unit cost information as it is frequently requested by investors and investment analysts who use it to assess our cost structure and margins
and compare it to similar information provided by many companies in our industry. 146
(C$ in millions, except where noted)
Three months ended
December 31, 2020
Three months ended
December 31, 2019
Year ended
December 31, 2020
Year ended
December 31, 2019
Revenue as reported $ 739 $ 745 $ 2,700 $ 2,968
Less:
Trail Operations revenues as reported (473) (406) (1,761) (1,829)
Other revenues as reported (2) (2) (9) (8)
Add back: Intra-segment revenues as reported 140 111 464 519
$ 404 $ 448 $ 1,394 $ 1,650
By-product revenue (A) (74) (86) (316) (317)
Smelter processing charges (B) 111 99 370 308
Adjusted revenue $ 441 $ 461 $ 1,448 $ 1,641
Cost of sales as reported $ 592 $ 625 $ 2,177 $ 2,367
Less:
Trail Operations cost of sales as reported (468) (439) (1,784) (1,915)
Other costs of sales as reported - (17) 24 (10)
Add back: Intra-segment as reported 140 111 464 519
$ 264 $ 280 $ 881 $ 961
Less:
Depreciation and amortization (48) (42) (204) (144)
Severance charge - - - (4)
Royalty costs (93) (96) (231) (307)
By-product cost of sales (C) (17) (24) (78) (75)
Adjusted cash cost of sales (D) $ 106 $ 118 $ 368 $ 431
Zinc Unit Cost Reconciliation (Mining Operations)1
Non-GAAP Financial Measures
147
1. Red Dog and Pend Oreille (closed in July 2019).
2. Average period exchange rates are used to convert to US$ per pound equivalent.
We include unit cost information as it is frequently requested by investors and investment analysts who use it to assess our cost structure and margins
and compare it to similar information provided by many companies in our industry.
Zinc Unit Cost Reconciliation (Mining Operations)1 - Continued
(C$ in millions, except where noted)
Three months ended
December 31, 2020
Three months ended
December 31, 2019
Year ended
December 31, 2020
Year ended
December 31, 2019
Payable pounds sold (millions) (E) 281.7 325.0 1,040.3 1,094.2
Per unit amounts (C$/lb)
Adjusted cash cost of sales (D/E) $ 0.38 $ 0.36 $ 0.35 $ 0.40
Smelter processing charges (B/E) 0.39 0.31 0.36 0.28
Total cash unit costs (C$/lb) $ 0.77 $ 0.67 $ 0.71 $ 0.68
Cash margin for by-products (C$/lb) ((A-C)/B) (0.20) (0.19) (0.23) (0.22)
Net cash unit costs (C$/lb) $ 0.57 $ 0.48 $ 0.48 $ 0.46
US$ AMOUNTS2
Average exchange rate (C$/US$) $ 1.30 $ 1.32 $ 1.34 $ 1.33
Per unit amounts (US$/lb)
Adjusted cash cost of sales $ 0.29 $ 0.27 $ 0.26 $ 0.30
Smelter processing charges 0.30 0.23 0.27 0.21
Total cash unit costs (US$/lb) $ 0.59 $ 0.50 $ 0.53 $ 0.51
Cash margin for by-products (US$/lb) (0.15) (0.14) (0.17) (0.17)
Net cash unit costs (US$/lb) $ 0.44 $ 0.36 $ 0.36 $ 0.34
Non-GAAP Financial Measures
1. Average period exchange rates are used to convert to US$ per tonne equivalent.
We include unit cost information as it is frequently requested by investors and investment analysts who use it to assess our cost structure and margins
and compare it to similar information provided by many companies in our industry. 148
(C$ in millions, except where noted)
Three months ended
December 31, 2020
Three months ended
December 31, 2019
Year ended
December 31, 2020
Year ended
December 31, 2019
Cost of sales as reported $ 825 $ 864 $ 3,098 $ 3,410
Less:
Transportation costs (245) (249) (905) (976)
Depreciation and amortization (212) (207) (732) (792)
Inventory (write-down) reversal (14) (28) (59) (32)
Labour settlement - - (4) -
Adjusted site cash cost of sales $ 354 $ 380 $ 1,398 $ 1,610
Tonnes sold (millions) 6.1 6.3 21.9 25.0
Per unit amounts (C$/t)
Adjusted site cash cost of sales $ 58 $ 60 $ 64 $ 65
Transportation costs 40 40 41 39
Inventory write-downs 2 4 3 1
Unit costs (C$/t) $ 100 $ 104 $ 108 $ 105
US$ AMOUNTS1
Average exchange rate (C$/US$) $ 1.30 $ 1.32 $ 1.34 $ 1.33
Per unit amounts (US$/t)
Adjusted site cash cost of sales $ 44 $ 46 $ 47 $ 49
Transportation costs 31 30 31 29
Inventory write-downs 2 3 2 1
Unit costs (US$/t) $ 77 $ 79 $ 80 $ 79
Steelmaking Coal Unit Cost Reconciliation
Non-GAAP Financial Measures
1. Reflects adjustments for costs not directly attributed to the production of Fort Hills bitumen, including transportation for non-proprietary product
purchased. 149
(C$ in millions, except where noted)
Three months ended
December 31, 2020
Three months ended
December 31, 2019
Year ended
December 31, 2020
Year ended
December 31, 2019
Revenue as reported $ 140 $ 213 $ 454 $ 975
Less:
Cost of diluent for blending (54) (80) (217) (322)
Non-proprietary product revenue (4) (8) (21) (32)
Add back: Crown royalties (D) 1 3 4 18
Adjusted revenue (A) $ 83 $ 128 $ 220 $ 639
Cost of sales as reported $ 186 $ 244 $ 780 $ 965
Less:
Depreciation and amortization (22) (34) (103) (134)
Bitumen and diluent inventory write-downs (8) - (54) -
Cash cost of sales $ 156 $ 210 $ 623 $ 831
Less:
Cost of diluent for blending (54) (80) (217) (322)
Cost of non-proprietary product purchased (4) (6) (17) (31)
Transportation costs for non-proprietary product
purchased1 (1) - (8) (2)
Transportation costs for FRB (C) (25) (29) (103) (118)
Adjusted operating costs (E) $ 72 $ 95 $ 278 $ 358
Blended bitumen barrels sold (000’s) 3,056 3,837 11,641 16,023
Less: diluent barrels included in blended bitumen (000’s) (762) (924) (2,949) (3,788)
Bitumen barrels sold (000’s) (B) 2,294 2,913 8,692 12,235
Energy Operating Netback, Bitumen & Blended Bitumen Price Realized Reconciliations
Non-GAAP Financial Measures
1. Bitumen price realized represents the realized petroleum revenue (blended bitumen sales revenue) net of diluent expense, expressed on a per barrel
basis. Blended bitumen sales revenue represents revenue from our share of the heavy crude oil blend known as Fort Hills Reduced Carbon Life Cycle
Dilbit Blend (FRB), sold at the Hardisty and U.S. Gulf Coast market hubs. FRB is comprised of bitumen produced from Fort Hills blended with purchased
diluent. The cost of blending is affected by the amount of diluent required and the cost of purchasing, transporting and blending the diluent. A portion of
diluent expense is effectively recovered in the sales price of the blended product. Diluent expense is also affected by Canadian and U.S. benchmark
pricing and changes in the value of the Canadian dollar relative to the U.S. dollar.
We include unit cost information as it is frequently requested by investors and investment analysts who use it to assess our cost structure and margins and
compare it to similar information provided by many companies in our industry. 150
Energy Operating Netback, Bitumen & Blended Bitumen Price Realized Reconciliations - Continued
(C$ in millions, except where noted)
Three months ended
December 31, 2020
Three months ended
December 31, 2019
Year ended
December 31, 2020
Year ended
December 31, 2019
Per barrel amounts (C$)
Bitumen price realized1 (A/B) $ 35.92 $ 44.29 $ 25.27 $ 52.21
Crown royalties (D/B) (0.33) (1.27) (0.49) (1.50)
Transportation costs for FRB (C/B) (10.69) (9.71) (11.84) (9.62)
Adjusted operating costs (E/B) (31.13) (32.55) (31.96) (29.24)
Operating netback (C$/barrel) $ (6.23) $ 0.76 $ (19.02) $ 11.85
Revenue as reported $ 140 $ 213 $ 454 $ 975
Less: Non-proprietary product revenue (4) (8) (21) (32)
Add back: Crown royalties 1 3 4 18
Blended bitumen revenue (A) $ 137 $ 208 $ 437 $ 961
Blended bitumen barrels sold (000s) (B) 3,056 3,837 11,641 16,023
Blended bitumen price realized1 (C$) (A/B)=D $ 44.77 $ 54.38 $ 37.55 $ 59.97
Average exchange rate (C$ per US$1) (C) 1.30 1.32 1.34 1.33
Blended bitumen price realized (US$/barrel) (D/C) $ 34.36 $ 41.20 $ 27.99 $ 45.20
Non-GAAP Financial Measures
151
Reconciliation of Free Cash Flow
(C$ in millions) 2003 to Q4 2020
Cash Flow from Operations $48,150
Debt interest and finance charges paid (5,820)
Capital expenditures, including capitalized stripping costs (28,602)
Payments to non-controlling interests (NCI) (649)
Free Cash Flow $13,079
Dividends paid $4,487
Payout ratio 34%
Global Metals & Mining
Conference
March 1, 2021
Don Lindsay
President and Chief Executive Officer

BMO Global Metals & Mining Conference

  • 1.
    Global Metals &Mining Conference March 1, 2021 Don Lindsay President and Chief Executive Officer
  • 2.
    Caution Regarding Forward-LookingStatements 2 Both these slides and the accompanying oral presentations contain certain forward-looking statements within the meaning of the United States Private Securities Litigation Reform Act of 1995 and forward-looking information within the meaning of the Securities Act (Ontario) and comparable legislation in other provinces (collectively referred to herein as forward-looking statements). Forward-looking statements can be identified by the use of words such as “plans”, “expects” or “does not expect”, “is expected”, “budget”, “scheduled”, “estimates”, “forecasts”, “intends”, “anticipates” or “does not anticipate”, or “believes”, or variation of such words and phrases or state that certain actions, events or results “may”, “could”, “should”, “would”, “might” or “will” be taken, occur or be achieved. Forward-looking statements involve known and unknown risks, uncertainties and other factors which may cause the actual results, performance or achievements of Teck to be materially different from any future results, performance or achievements expressed or implied by the forward-looking statements. These statements speak only as of the original date of this presentation. These forward-looking statements include, but are not limited to, statements concerning: the potential impact of the COVID-19 on our business and operations, including our ability to continue operations at our sites; our ability to manage challenges presented by COVID-19; our long-term strategy, including but not limited to copper growth strategy; doubling of copper production by 2023 through QB2; all expectations regarding future copper, zinc and steelmaking coal demand and how Teck is positioned to benefit; Teck’s strategy ensuring we ae well-positioned for changes in demand for commodities; is well positioned for the low-carbon economy; our goal of carbon neutrality and the steps to achieve that goal; expectations of copper production growth; our green metals growth strategy and the components of that strategy, including but not limited to accelerating growth in copper, and maximizing cash flow from operations to fund copper growth; all projections and forecasts about QB2 and QB3 or based on QB2 or QB3, including but not limited to copper growth, C1 cash costs and AISC costs, strip ratio, throughput rate and potential to become a top five global copper producer; reserve and resource estimates; long-term zinc optionality, and including those set out in the “Quebrada Blanca” Appendix; impact of commodity price change on annualized EBITDA and annualized profit; liquidity and availability of borrowings under our credit facilities and the QB2 project finance facility; objectives and components of Teck's capital allocation framework, including a base dividend and potential supplemental shareholder distribution and maintenance of solid investment grade metrics; sustainability goals; statement we are poised for growth; expectation that QB2 will be a long-life, low-cost operation with significant expansion potential, the impact of QB2 on Teck’s portfolio balance and QB; QB2 capital estimate and estimated COVID-19 impacts on costs at QB2; timing of first production at QB2; growth options and opportunities in copper, zinc and steelmaking coal; all guidance appearing in this document including but not limited to the production, sales, cost, unit cost, capital expenditure, cost reduction and other guidance; climate action goals and the expectation that we will achieve these goals; water management goals and expectation that we will achieve those goals; Elk Valley water treatment projections; benefits and impact of our RACE21TM program; long term annual steelmaking coal production of 26 to 27 million tonnes, and expectations of stable long term strip ratio; benefits of the Neptune facility upgrade and cost and timing expectations; expectation of strong long-term cash flows in steelmaking coal; expectation of restructuring our cost base in our steelmaking coal business unit; projected steelmaking coal sustaining capital; long-term sustaining capital expenditure projection in copper; long-term sustaining capital expenditure projection in zinc; expectations for Red Dog extension; Fort Hills debottlenecking potential; expectation of sufficient pipeline capacity for our energy business; the benefits of our innovation strategy and initiatives described under the “Technology and Innovation” Appendix and elsewhere; mine lives and duration of operations at our various mines and operations; expectations and forecasts for our products, business units and individual operations and projects; and forecasts for supply and demand for copper, zinc, steelmaking coal and oil. The forward-looking statements are based on and involve numerous assumptions, risks and uncertainties and actual results may vary materially. These statements are based on assumptions, including, but not limited to, general business and economic conditions, interest rates, the supply and demand for, deliveries of, and the level and volatility of prices of, zinc, copper, coal, blended bitumen, and other primary metals, minerals and products as well as steel, oil, natural gas, petroleum, and related products, the timing of the receipt of regulatory and governmental approvals for our development projects and other operations and new technologies, our costs of production and production and productivity levels, as well as those of our competitors, power prices, continuing availability of water and power resources for our operations, market competition, the accuracy of our reserve estimates (including with respect to size, grade and recoverability) and the geological, operational and price assumptions on which these are based, conditions in financial markets, the future financial performance of the company, our ability to successfully implement our technology and innovation strategy, the performance of new technologies in accordance with our expectations, our ability to attract and retain skilled staff, our ability to procure equipment and operating supplies, positive results from the studies on our expansion projects, our coal and other product inventories, our ability to secure adequate transportation for our products, our ability to obtain permits for our operations and expansions, our ongoing relations with our employees and business partners and joint venturers, our expectations with respect to the carbon intensity of our operations, assumptions regarding returns of cash to shareholders include assumptions regarding our future business and prospects, other uses for cash or retaining cash. Our sustainability goals are based on a number of additional assumptions, including regarding the availability and effectiveness of technologies needed to achieve our sustainability goals and priorities; the availability of clean energy sources and zero-emissions alternatives for transportation on reasonable terms; our ability to implement new source control or mine design strategies and transition to seawater or low-quality water on commercially reasonable terms without impacting production objectives; our ability to successfully implement our technology and innovation strategy; and the performance of new technologies in accordance with our expectations. In addition, assumptions regarding the Elk Valley Water Quality Plan include assumptions that additional treatment will be effective at scale, and that the technology and facilities operate as expected. Reserve and resource life estimates assume the mine life of longest lived resource in the relevant commodity is achieved, assumes production at planned rates and in some cases development of as yet undeveloped projects. Assumptions regarding the benefits of the Neptune Bulk Terminals expansion and other projects include assumptions that the project is constructed and operated in accordance with current expectations. Capital allocation decisions, and decisions regarding the payment of dividends, are in the discretion of the board of directors. Assumptions regarding QB2 include assumption of completion based on current project assumptions and assumptions regarding the final feasibility study; assumptions regarding QB3 include assumptions regarding the receipt of permits. Assumptions regarding QB2 include current project assumptions and assumptions regarding the final feasibility study, CLP/USD exchange rate of 775, as well as there being no unexpected material and negative impact to the various contractors, suppliers and subcontractors for the QB2 project relating to COVID-19 or otherwise that would impair their ability to provide goods and services as anticipated during the suspension period or ramp-up of construction activities. Assumptions regarding the benefits of the Neptune Bulk Terminals expansion include assumptions that the project is constructed and operated in accordance with current expectations. Statements regarding the availability of our credit facilities and project financing facility are based on assumptions that we will be able to satisfy the conditions for borrowing at the time of a borrowing request and that the facilities are not otherwise terminated or accelerated due to an event of default. Statements concerning future production costs or volumes are based on numerous assumptions of management regarding operating matters and on assumptions that demand for products develops as anticipated, that customers and other counterparties perform their contractual obligations, that operating and capital plans will not be disrupted by issues such as mechanical failure,
  • 3.
    Caution Regarding Forward-LookingStatements 3 unavailability of parts and supplies, labour disturbances, interruption in transportation or utilities, adverse weather conditions, and that there are no material unanticipated variations in the cost of energy or supplies. Statements regarding anticipated steelmaking coal sales volumes and average steelmaking coal prices depend on, among other things, timely arrival of vessels and performance of our steelmaking coal-loading facilities, as well as the level of spot pricing sales. The foregoing list of assumptions is not exhaustive. Events or circumstances could cause actual results to vary materially. Assumptions are also included in the footnotes to the slides. Factors that may cause actual results to vary materially include, but are not limited to: extended COVID-19 related suspension of activities and negative impacts on our suppliers, contractors, employees and customers; extended delays in return to normal operations due to COVID-19 related challenges; changes in commodity and power prices, changes in market demand for our products; changes in interest and currency exchange rates; acts of governments and the outcome of legal proceedings; inaccurate geological and metallurgical assumptions (including with respect to the size, grade and recoverability of mineral reserves and resources); unanticipated operational difficulties (including failure of plant, equipment or processes to operate in accordance with specifications or expectations, cost escalation, unavailability of materials and equipment, government action or delays in the receipt of government approvals, industrial disturbances or other job action, adverse weather conditions and unanticipated events related to health, safety and environmental matters); union labour disputes; political risk; social unrest; failure of customers or counterparties (including logistics suppliers) to perform their contractual obligations; changes in our credit ratings; unanticipated increases in costs to construct our development projects, difficulty in obtaining or retaining permits; inability to address concerns regarding permits or environmental impact assessments; current and new technologies relating to our Elk Valley water treatment efforts and other sustainability goals and targets may not perform as anticipated or may not be available, and ongoing monitoring may reveal unexpected environmental conditions requiring additional remedial measures; and changes or further deterioration in general economic conditions. Development of future reserves and resources is dependent on, among other factors, receipt of permits. Current and new technologies relating to our Elk Valley water treatment efforts may not perform as anticipated, and ongoing monitoring may reveal unexpected environmental conditions requiring additional remedial measures. QB2 costs, construction progress and timing of first production is dependent on, among other matters, our continued ability to successfully manage through the impacts of COVID-19. QB2 costs may also be affected by claims and other proceedings that might be brought against us relating to costs and impacts of the COVID-19 pandemic. Red Dog production may also be impacted by water levels at site. The forward-looking statements in this presentation and actual results will also be impacted by the effects of COVID-19 and related matters. The overall effects of COVID-19 related matters on our business and operations and projects will depend on how the ability of our sites to maintain normal operations, and on the duration of impacts on our suppliers, customers and markets for our products, all of which are unknown at this time. Continuing operating activities is highly dependent on the progression of the pandemic and the success of measures taken to prevent transmission, which will influence when health and government authorities remove various restrictions on business activities. We assume no obligation to update forward-looking statements except as required under securities laws. Further information concerning risks and uncertainties associated with these forward-looking statements and our business can be found in our Annual Information Form for the year ended December 31, 2020, filed under our profile on SEDAR (www.sedar.com) and on EDGAR (www.sec.gov) under cover of Form 40-F, as well as subsequent filings. Please see our 2020 annual management’s discussion and analysis dated February 17, 2020 for further information concerning the guidance and other forward looking statements in this presentation. QB2 Project Disclosure All economic analysis with respect to the QB2 project based on a development case which includes inferred resources within the life of mine plan, referred to as the Sanction Case, which is the case on which Teck based its development decision for the QB2 project. Inferred resources are considered too speculative geologically to have the economic considerations applied to them that would enable them to be categorized as mineral reserves. Inferred resources are subject to greater uncertainty than measured or indicated resources and it cannot be assumed that they will be successfully upgraded to measured and indicated through further drilling. Nonetheless, based on the nature of the mineralization, Teck has used a mine plan including inferred resources as the development mine plan for the QB2 project. The economic analysis of the Sanction Case, which includes inferred resources, may be compared to economic analysis regarding a hypothetical mine plan which does not include the use of inferred resources as mill feed, referred to as the Reserve Case, and which is set out in Appendix slides “QB2 Project Economics Comparison” and “QB2 Reserves and Resources Comparison”. The scientific and technical information regarding the QB2 project and Teck's other material properties was prepared under the supervision of Rodrigo Marinho, P. Geo, who is an employee of Teck. Mr. Marinho is a qualified person, as defined under National Instrument 43-101.
  • 4.
  • 5.
    High-quality assets inattractive jurisdictions Proven operational excellence underpinning cost competitiveness Doubling of copper production by 2023 through QB21 Significant value potential from a portfolio of green metals Recognized industry leader in ESG performance Strong balance sheet and rigorous capital allocation framework 5 Strong safety performance with stringent COVID-19 prevention protocols in place across the business Among the world’s lowest carbon intensity producers of copper, zinc and steelmaking coal Experienced leadership team with proven track record of project execution and operational excellence Canada’s largest base metals company, headquartered in Vancouver, British Columbia, Canada Operations & Major Projects Copper Zinc Energy Steelmaking Coal Operation Project About Teck
  • 6.
    Copper Zinc Seaborne Steelmaking Coal By2050 we expect:1 2.3x demand2 2.1x demand2 1.0x demand3 Driven by: Green technologies, electrification and improved energy efficiency require large amounts of copper – essential for decarbonization technologies Galvanizing to protect steel, batteries, renewables, infrastructure, industrial and health needs support strong demand Enduring demand for high quality seaborne steelmaking coal as coastal blast furnaces decarbonize and continue to meet steel demand from population growth, urbanization and a growing middle class How Teck is positioned to benefit: Doubling production by 20234 Largest net zinc miner Second largest seaborne steelmaking coal supplier and lowest carbon intensity 6 • Strong demand for metals and minerals driven by decarbonization, population growth and a rising middle class • Unprecedented pandemic monetary and fiscal stimulus • Forecast economic recovery as the COVID-19 vaccine is rolled out • Current stockpiles of essential minerals at historically low levels Accelerated Need for Essential Metals And Minerals for a Low-Carbon World
  • 7.
    Teck and theLow-Carbon Transition 7 We believe Teck’s strategy will ensure we are well-positioned for changes in demand for mining commodities driven by the transition to a low-carbon world • Build on our low carbon head start ‒ Among the world’s lowest carbon intensities for our copper, refined zinc and lead, and steelmaking coal production1 • Transition to renewable power = ~1 Mtpa GHG reduction ‒ Sourcing 100% renewable energy at Carmen de Andacollo from 2020 ‒ Sourcing >50% of operational energy at QB2 from renewable sources • Build QB2, which will double our consolidated copper production by 2023 • Explore options to realize value from our oil sands assets • Continue to produce the high-quality steelmaking coal required for the low-carbon transition • Reduce carbon as a proportion of our total business • Meet our milestone goals for 2030, in support of our carbon neutrality goal: ‒ Source 100% of all power needs in Chile from renewable power ‒ Reduce the carbon intensity of our operations by 33% ‒ Shift to low-emissions mining fleets • Work with our customers and transportation providers to reduce downstream emissions Carbon neutrality by 2050 1 Today Focus on copper growth to transition our portfolio to green metals 2 10+ Years Prudently growing our green metals business in areas essential to the transition to a low-carbon world 3 20+ Years Leading green metals producer supplying essential metals for a low-carbon world
  • 8.
    Industry Leading CopperGrowth In Attractive Jurisdictions 8 WoodMac: Consolidated Copper Production Growth1 Teck2 vs. Peers3 2021E-2023E WoodMac: Teck’s Consolidated Copper Production4 By Jurisdiction 2023E Canada 156 kt Peru 86 kt Chile 227 kt Copper peers: Antofagasta, First Quantum, Freeport, Hudbay, Lundin and Southern Copper. Diversified peers: Anglo American, BHP, Glencore, Rio Tinto. Teck provides investors exposure to industry leading copper growth and valuation unlock 102% 11% 21% 0% 20% 40% 60% 80% 100% 120% Teck Copper Peer Average Diversified Peer Average Canada Chile Peru
  • 9.
  • 10.
    Prudent Green MetalsGrowth Strategy 10 Canada 156 kt Peru 86 kt Chile 227 kt Accelerate growth in copper Maximize cash flows from operations to fund copper growth Strengthen existing high-quality assets through RACE21TM Discipline in capital allocation Leadership in sustainability
  • 11.
    276 276 290 2020A ProForma QB2 Consolidated (100%) Teck 2020 Actual Teck's Consolidated Copper Production1 (kt Cu) Accelerate Growth in Copper Focus on growing copper production 11 • Solid base of current operations • QB2 project currently under construction will double our consolidated copper production by 2023 • Significant brownfield and greenfield copper growth pipeline • Reserve and resource increase of 20%2 for Quebrada Blanca in the past year; orebody remains open in multiple directions ~100% Teck’s Copper Reserves and Resources2 (Mt) Based on Sanction Case (Including 199 Mt Inferred Resources) Refer to “QB2 Project Economics Comparison” and “QB2 Reserves and Resources Comparison” slides for Reserve Case (Excluding Inferred Resources) The description of the QB2 project Sanction Case includes inferred resources that are considered too speculative geologically to have the economic considerations applied to them that would enable them to be categorized as mineral reserves. Inferred resources are subject to greater uncertainty than measured or indicated resources and it cannot be assumed that they will be successfully upgraded to measured and indicated through further drilling. 6 7 12 25 10 13 18 42 14 11 11 36 Copper Operations QB Incl, QB2 and QB3) Copper Growth Assets (excl. QB) Total Inferred Resources Measured & Indicated Resources Proven and Probable Reserves
  • 12.
    Accelerate Growth inCopper QB2 is a low cost asset in an attractive jurisdiction 12 QB2’s Low Strip Ratio Is the Driver For Low All-in Sustaining Costs Vast, long-life deposit in Chile (~100 year resource) QB2 only uses ~18% of the 2020 reserve and resource tonnage1 Low C1 cash cost and All-in Sustaining Costs (AISC), of US$1.28/lb2 and US$1.38/lb3, respectively, in the first 5 full years Expected to initially be a top 20 global copper producer Project progressing well, with 40% completion as at December 31, 2020 and strict COVID-19 protocols in place Potential to become a top 5 producer with QB3 QB2 (0.7:1) Antamina (3.0:1)4 Collahuasi (3.7:1)4 Escondida (2.6:1)4 Based on Sanction Case (Including 199 Mt Inferred Resources) Refer to “QB2 Project Economics Comparison” and “QB2 Reserves and Resources Comparison” slides for Reserve Case (Excluding Inferred Resources) The description of the QB2 project Sanction Case includes inferred resources that are considered too speculative geologically to have the economic considerations applied to them that would enable them to be categorized as mineral reserves. Inferred resources are subject to greater uncertainty than measured or indicated resources and it cannot be assumed that they will be successfully upgraded to measured and indicated through further drilling.
  • 13.
    COPPER • Foundation ofstable operations with three large operating mines in attractive jurisdictions • Among the lowest carbon intensity copper producers • Strong pipeline of copper projects • 10-year average gross profit margin 47%1 Maximize Cash Flows From Operations To Fund Copper Growth 13 Antamina Highland Valley Copper Carmen de Andacollo ZINC • Galvanizing extends the life of infrastructure supporting decarbonization • Red Dog is one of the largest high grade, low-cost zinc mines globally • Long-term optionality through Teena, Cirque, Aktigiruq, and Anarraaq • Red Dog 10-year average gross profit margin 53%1 Red Dog Trail Operations
  • 14.
    Maximize Cash FlowsFrom Operations To Fund Copper Growth 14 STEELMAKING COAL • Foundation of stable operations with four operating mines in the Elk Valley, BC • Growing margins, not volume • Cost base restructuring is near completion • Enhanced logistics chain to strengthen long-term, low-cost and reliable supply chain • One of the lowest carbon intensity producers of high quality hard coking coal • Significant leverage to rising steelmaking coal prices, with a US$50/tonne increase having a ~C$1.5 billion1 effect on annualized EBITDA • 10-year average gross profit margin 49%2 Steelmaking Coal Prices3 (US$/t) Strong coal fundamentals underpinned by global economic recovery Since January 1, 2011, the FOB Australia price has averaged ~US$170/t, or ~US$180/t on an inflation-adjusted basis 0 50 100 150 200 250 Jan-20 Feb-20 Mar-20 Apr-20 May-20 Jun-20 Jul-20 Aug-20 Sep-20 Oct-20 Nov-20 Dec-20 Jan-21 Feb-21 Chinese Domestic CFR Equivalent CFR China FOB Australia
  • 15.
    Strengthen Existing High-QualityAssets Through RACE21TM 15 Transformational safety impact Step-change impact to operational efficiency Increased productivity through technology and innovation Increased margins Advanced data analytics and artificial intelligence to reduce risk of heavy vehicle / light vehicle interactions Increased copper throughput by ~7% and recovery by ~2% at Highland Valley Copper Record haul truck productivities at our coal sites, up 0.5% versus same period last year Improved zinc feed margins by $5 per tonne processed at our Trail Operations RACE21TM is driving operational improvements and transforming our business through technology and innovation Focus Examples
  • 16.
    Discipline in CapitalAllocation QB2 funding secured; long-dated maturity profile provides optionality No significant note maturities prior to 20304 (C$M) 16 Balance Sheet • Rated investment grade by all four agencies Liquidity • C$6.5 billion of liquidity available1 • US$5.0 billion of committed revolving credit facilities • No earnings or cash-flow based financial covenant, no credit rating trigger, no general material adverse effect borrowing condition Mid-Point 2021 Production Guidance6 Change Estimated Effect on Annualized EBITDA7 Copper 282.5 kt US$0.50/lb C$400M Zinc8 902.5 kt US$0.10/lb C$120M Coal 26.0 Mt US$50/t C$1,500M Significant leverage to rising commodity prices5 Financial Highlights $10.9 billion five-year average annual revenues2 $4.3 billion five-year average annual Adjusted EBITDA2,3 Prudent QB2 Project Funding ~US$1.1 billion4 drawn on US$2.5 billion project finance facility 0 500 1,000 2021 2022 2023 2024 2025 2026 2027 2028 2029 2030 2031 2032 2033 2034 2035 2036 2037 2038 2039 2040 2041 2042 2043
  • 17.
    Discipline in CapitalAllocation A transparent framework, rigorously applied 17 BASE DIVIDEND COMMITTED GROWTH CAPITAL CAPITAL STRUCTURE SUSTAINING CAPITAL (including stripping) SUPPLEMENTAL SHAREHOLDER DISTRIBUTIONS Plus at Least 30% Available Cash Flow1 Additional cash returns to shareholders Build on C$6.8 billion2 of dividends and share buybacks since 2003 Further green metals growth opportunities No growth in carbon assets 1. For this purpose, we define available cash flow as cash flow from operating activities after interest and finance charges, lease payments and distributions to non-controlling interests less: (i) sustaining capital and capitalized stripping; (ii) committed growth capital; (iii) any cash required to adjust the capital structure to maintain solid investment grade credit metrics; and (iv) our base $0.20 per share annual dividend. Proceeds from any asset sales may also be used to supplement available cash flow. Any additional cash returns will be made through share repurchases and/or supplemental dividends depending on market conditions at the relevant time. 2. As at December 31, 2020. FCF is free cash flow. Free cash flow is a non-GAAP financial measure. See “Non-GAAP Financial Measures” slides. C$4.5 billion2 in dividends (34% of FCF) C$2.3 billion2 in buybacks (18% of FCF) { Optimizing how we deploy Available Cash Flow1: Balancing between returning cash to shareholders and investing in green metals growth AND
  • 18.
    Leadership in Sustainability 18 Topranked diversified metals mining company “A” rating since 2013 Outperforming 4 of 5 largest peers Top-ranked mining company 2020 World & North American Indices Gold Class Award 2021 Carbon and water goals that address the climate challenge • Paris-aligned commitment to be carbon neutral by 2050; reducing carbon intensity by 33% by 2030 • Transitioning to sea or low-quality water in all water-scarce regions by 2040 • Lowest GHG intensity miner1 (tCO2e/t CuEq, 2017) Employer of choice, neighbor of choice • Enhancing critical control verification to drive further improvements in safety • Strong relationships with our communities and Indigenous Peoples Sustainable governance • Sustainability oversight & direction by dedicated Board and management committees • Health & safety and sustainability performance linked to compensation program 1. Source: Barclays Research, Teck.
  • 19.
  • 20.
    Industry leading copper growth, strengthening existinghigh-quality, low carbon assets Right Approach Highest standards of sustainability in everything we do, operational excellence, RACE21TM Our people deliver the optimal mix of industry leading technical, digital, sustainability, commercial and financial leadership Right Opportunities Strong demand for our metals and minerals, led by growth and decarbonization Right Assets Poised for Growth 20 Providing essential metals and minerals for a low-carbon world Right Team
  • 21.
  • 22.
    Endnotes Slide 5: AboutTeck 1. On a consolidated basis. Slide 6: Accelerated Need for Essential Metals and Minerals for a Low-Carbon World 1. Modelled forecast under International Energy Agency (IEA) Rapid Transition Sustainable Development Scenario (SDS) for 1.5ºC (1.5oC). 2. Source: Vivid Economics. 3. Source: McKinsey. 4. On a consolidated basis. Slide 7: Teck and the Low-Carbon Transition 1. Barclays Research; Teck. 2017. Slide 8: Industry Leading Copper Growth in Attractive Jurisdictions 1. Source: Wood Mackenzie base case (attributable) copper production dataset. Consolidated production estimates were derived based on accounting standards for consolidation for Teck and its peers. 2. Teck growth estimate uses 2020 actual production and Wood Mackenzie data for 2023. 3. Copper peers: Antofagasta, First Quantum, Freeport, Hudbay, Lundin, Southern Copper. Diversified peers: Anglo American, BHP, Glencore, Rio Tinto. Peer production metrics for 2020 and 2023 are from Wood Mackenzie. Peer production metrics for 2020 and 2023 are from Wood Mackenzie. Peer averages are the simple averages. Slide 11: Accelerate Growth in Copper - Focus on growing copper production 1. We include 100% of production from our Quebrada Blanca and Carmen de Andacollo mines in our production and sales volumes, even though we do not own 100% of these operations, because we fully consolidate their results in our financial statements. We include 22.5% of production from Antamina, representing our proportionate ownership interest in the operation. QB2 is on a consolidated basis and is based on the QB2 Sanction Case first five full years of copper production. 2. Contained metal. Based on Teck’s 2020 Annual Information Form. Slide 12: Accelerate Growth in Copper - QB2 is a low cost asset in an attractive jurisdiction 1. Resources figures are based on Teck’s 2020 Annual Information Form. Resources are reported separately from, and do not include that portion of resources classified as reserves. See “QB2 Reserves and Resources Comparison” slide for further details. 2. C1 cash costs (also known as net cash unit costs) are presented after by-product credits assuming US$10.00/lb molybdenum and US$18.00/oz silver. C1 cash costs for QB2 include stripping costs during operations. See “QB2 Reserves and Resources Comparison” slide for further details. Net cash unit costs and C1 cash costs are non-GAAP financial measures. See “Non-GAAP Financial Measures” slides. 3. All-in sustaining costs (AISC) are net cash unit costs (also known as C1 cash costs) plus sustaining capital expenditures. Net cash unit costs are calculated after cash margin by-product credits assuming US$10.00/lb molybdenum and US$18.00/oz silver. Net cash unit costs for QB2 include stripping costs during operations. See “QB2 Reserves and Resources Comparison” slide for further details. AISC. Net cash unit cost and cash margins for by-products are non-GAAP financial measures. See “Non-GAAP Financial Measures” slides. 4. Source: Wood Mackenzie. Average 2021-2040. Slide 13: Maximize Cash Flows from Operations to Fund Copper Growth – Copper and Zinc 1. Gross profit margins before depreciation from January 1, 2011 to December 31, 2020. Gross profit margins before depreciation are a non-GAAP financial measure. See “Non-GAAP Financial Measures” slides. Slide 14: Maximize Cash Flows from Operations to Fund Copper Growth – Steelmaking Coal 1. As at February 17, 2021. The sensitivity of our EBITDA to changes in the Canadian/U.S. dollar exchange rate and commodity prices, before pricing adjustments, based on our current balance sheet, our 2021 mid-range production estimates, current commodity prices and a Canadian/U.S. dollar exchange rate of $1.30. The effect on our EBITDA of commodity price movements will vary from quarter to quarter depending on sales volumes. Our estimate of the sensitivity of EBITDA to changes in the U.S. dollar exchange rate is sensitive to commodity price assumptions. See Teck’s Q4 2020 press release for further details. EBITDA is a non-GAAP financial measure. See “Non-GAAP Financial Measures” slides. 2. Gross profit margins before depreciation from January 1, 2011 to December 31, 2020. Gross profit margins before depreciation are a non-GAAP financial measure. See “Non-GAAP Financial Measures” slides. 3. Ten-year steelmaking coal prices are calculated from January 1, 2011. Inflation-adjusted prices are based on Statistics Canada’s Consumer Price Index. Source: Argus, Teck. As at February 19, 2021. 22
  • 23.
    Endnotes Slide 16: Disciplinein Capital Allocation - QB2 funding secured; long-dated maturity profile provides optionality 1. As at February 17, 2021. 2. Average from 2016-2020. 3. Adjusted EBITDA is a non-GAAP financial measure. See “Non-GAAP Financial Measures” slides. 4. As at December 31, 2020. 5. As at February 17, 2021. The sensitivity of our EBITDA to changes in the Canadian/U.S. dollar exchange rate and commodity prices, before pricing adjustments, based on our current balance sheet, our 2021 mid-range production estimates, current commodity prices and a Canadian/U.S. dollar exchange rate of $1.30. See Teck’s Q4 2020 press release for further details. 6. All production estimates are subject to change based on market and operating conditions. 7. The effect on our EBITDA of commodity price movements will vary from quarter to quarter depending on sales volumes. Our estimate of the sensitivity of EBITDA to changes in the U.S. dollar exchange rate is sensitive to commodity price assumptions. See Caution Regarding Forward-Looking Statements for a further discussion of factors that may cause actual results to vary from our estimates. EBITDA is a non-GAAP financial measure. See “Non-GAAP Financial Measures” slides. 8. Zinc includes 305,000 tonnes of refined zinc and 597,500 tonnes of zinc contained in concentrate. Slide 18: Leadership in Sustainability 1. Source: Barclays Research, Teck. 23
  • 24.
  • 25.
    Quebrada Blanca Photo: Concentrator- Aerial view of grinding lines: line 1 SAG and ball mills in place, line 2 concrete complete January 2021
  • 26.
     Vast, longlife deposit in favourable jurisdiction  Very low strip ratio  Low all in sustaining costs (AISC)1  Potential to be a top 20 producer  High grade, clean concentrates  Significant brownfield development  Community agreements in place and strong local relationships  Construction well underway; first production expected H2 2022  Expansion potential (QB3) with potential to be a top 5 producer Highlights Chile Peru Bolivia Tarapacá Region Arica y Parinacota Region Antofagasta Region Arica Iquique QB2 Teck, SMM, SC, ENAMI Collahuasi Anglo American, Glencore, Mitsui El Abra Freeport-McMoRan, Codelco Radomiro Tomic Codelco Chuquicamata Codelco Ministro Hales Codelco Cerro Colorado BHP Spence BHP Centinela Antofagasta, Marubeni Gabriela Mistral Codelco Escondida BHP, Rio Tinto, Mitsubishi Argentina Sierra Gorda KGHM, SMM, SC Location QB2 Project Executing on a world class development asset 26
  • 27.
    QB2’s Competitive CostPosition Competitive Operating Cost & Capital Intensity Low Cash Cost Position 27 Based on Sanction Case (Including 199 Mt Inferred Resources) Refer to “QB2 Project Economics Comparison” and “QB2 Reserves and Resources Comparison” slides for Reserve Case (Excluding Inferred Resources) The description of the QB2 project Sanction Case includes inferred resources that are considered too speculative geologically to have the economic considerations applied to them that would enable them to be categorized as mineral reserves. Inferred resources are subject to greater uncertainty than measured or indicated resources and it cannot be assumed that they will be successfully upgraded to measured and indicated through further drilling. C1 Cash Cost2 & AISC3 Curve1 (US$/lb, 2023E) • Given the exceptionally low strip ratio, consistent grade profile, compact site layout, and high level of automation, QB2 is expected to have attractive and relatively stable operating costs • Exceptional strip ratio of 0.70 LOM, meaning for every one tonne of ore mined, only 0.70 tonnes of waste need to be mined (0.44 over first 5 full years) − Compares to other world class asset strip ratios of 2.6 for Escondida, 3.0 for Antamina, and 3.7 for Collahuasi1 − Major benefit to sustaining capital since it reduces mobile fleet size and replacement costs Antamina Escondida Collahuasi - 0.50 1.00 1.50 2.00 2.50 3.00 3.50 - 25% 50% 75% 100% US$/lb Cumulative Paid Metal (%) AISC C1 Cash Cost QB2 (first 5 full years) US$1.38/lb QB2 (first 5 full years) US$1.28/lb
  • 28.
    Vast, Long LifeDeposit at Quebrada Blanca Significant extension potential • QB2 uses only ~18% of the 2020 reserve and resource tonnage1 • Deposit is capable of supporting a very long mine life based on throughput rate of 143 ktpd2 by utilizing further tailings capacity at already identified sites • Actively evaluating potential options to exploit value of full resource through mill expansion and / or mine life extension • Beyond the extensive upside included in the defined QB deposit, the district geology is highly prospective for exploration discovery and resource addition; mineralization is open in multiple directions 28 . 1,259 1,202 1,401 1,432 1,325 1,472 1,891 3,621 2,141 3,393 3,492 3,119 2017 AIF 2018 Resource Update 2019 AIF 2020 AIF Inferred M&I (Exclusive) P&P Resources (excluding reserves) +94%3 Reserve and Resource Tonnage (Mt) 1 Based on Sanction Case (Including 199 Mt Inferred Resources) Refer to “QB2 Project Economics Comparison” and “QB2 Reserves and Resources Comparison” slides for Reserve Case (Excluding Inferred Resources) The description of the QB2 project Sanction Case includes inferred resources that are considered too speculative geologically to have the economic considerations applied to them that would enable them to be categorized as mineral reserves. Inferred resources are subject to greater uncertainty than measured or indicated resources and it cannot be assumed that they will be successfully upgraded to measured and indicated through further drilling.
  • 29.
    QB2 Project EconomicsComparison 29 The description of the QB2 project Sanction Case includes inferred resources that are considered too speculative geologically to have the economic considerations applied to them that would enable them to be categorized as mineral reserves. Inferred resources are subject to greater uncertainty than measured or indicated resources and it cannot be assumed that they will be successfully upgraded to measured and indicated through further drilling. 7 8 Reserve Case1 Sanction Case2 Mine Life Years 28 28 Strip Ratio First 5 Full Years 0.16 0.44 LOM3 0.41 0.70 C1 Cash Cost4 First 5 Full Years US$/lb $1.29 $1.28 LOM3 US$/lb $1.47 $1.37 AISC5 First 5 Full Years US$/lb $1.40 $1.38 LOM3 US$/lb $1.53 $1.42
  • 30.
    QB2 Reserves andResources Comparison Reserve Case (as at Nov. 30, 2018)1,2 Sanction Case (as at Nov. 30, 2018)2,4 30 Reserves Mt Cu Grade % Mo Grade % Silver Grade ppm Proven 409 0.54 0.019 1.47 Probable 793 0.51 0.021 1.34 Reserves 1,202 0.52 0.020 1.38 Resources (Exclusive of Reserves)5 Mt Cu Grade % Mo Grade % Silver Grade ppm Measured 36 0.42 0.014 1.23 Indicated 1,436 0.40 0.016 1.13 M&I (Exclusive) 1,472 0.40 0.016 1.14 Inferred 3,194 0.37 0.017 1.13 + Inferred in SC pit 199 0.53 0.022 1.21 Reserves Mt Cu Grade % Mo Grade % Silver Grade ppm Proven 476 0.51 0.018 1.40 Probable 924 0.47 0.019 1.25 Reserves 1,400 0.48 0.018 1.30 Resources (Exclusive of Reserves)3 Mt Cu Grade % Mo Grade % Silver Grade ppm Measured 36 0.42 0.014 1.23 Indicated 1,558 0.40 0.016 1.14 M&I (Exclusive) 1,594 0.40 0.016 1.14 Inferred 3,125 0.38 0.018 1.15
  • 31.
    QB2 Project Update Executingon our copper growth strategy 31 Achieved overall progress target of 40% completion at year end 2020 • Construction continued to ramp up through Q4 2020, and work is progressing well across the project • Strict COVID-19 protocols in place and continuously enhanced to protect the health and safety of our workers and communities in which we operate Unchanged capital estimate before COVID-19 impacts • US$5.2 billion1 including escalation and ~US$400 million contingency • Go-forward capital cost from January 1, 2021 estimated at US$3.2 billion2 Updated estimate of COVID-19 impacts • US$450-500 million3, an increase of ~$50 million from previous guidance, which includes ~US$200 million of expensed costs First production at QB2 is expected in H2 2022
  • 32.
    ENAMI Interest inQuebrada Blanca Organizational Chart • The government of Chile owns a 10% non-funding interest in Compañía Minera Teck Quebrada Blanca S.A. (CMTQB) through its state-run minerals company, Empresa Nacional de Minería (ENAMI) • ENAMI has been a partner at QB since 1989 and is a 10% shareholder of Carmen de Andacollo • ENAMI is not required to fund QB2 development costs • Project equity funding in form of: ‒ 25% Series A Shares ‒ 75% Shareholder Loans • Until shareholder loans are fully repaid, ENAMI is entitled to a minimum dividend, based on net income, that approximates 2.0-2.5% of free cash flow ‒ Thereafter, ENAMI receives 10% of dividends / free cash flow 32 . CMTQB TRCL ENAMI Teck 10% (Series B) 100% 90% (Series A) JVCo SMM 66.67% 100% 33.33% SC 83.33% 16.67% Chile HoldCo QB1 / QB2 / QB3
  • 33.
    Quebrada Blanca AccountingTreatment Balance Sheet Cash Flow • 100% of project spending included in property, plant and equipment • Debt includes 100% of project financing • Total shareholder funding to be split between loans and equity approximately 75%/25% over the life of the project • Sumitomo (SMM/SC)1 contributions will be shown as advances as a non-current liability and non-controlling interest as part of equity • Teck contributions, whether debt or equity eliminated on consolidation • 100% of project spending included in capital expenditures • Sumitomo1 contribution recorded within financing activities and split approximately 50%/50% as: ‒ Loans recorded as “Advances from Sumitomo” ‒ Equity recorded as “Sumitomo Share Subscriptions” • 100% of draws on project financing included in financing activities • After start-up of operations ‒ 100% of profit in cash flow from operations ‒ Sumitomo’s1 30% and ENAMI’s 10% share of distributions included in non-controlling interest 33 Income Statement • Teck’s income statement will include 100% of QB’s revenues and expenses • Sumitomo’s1 30% and ENAMI’s 10% share of profit will show as profit attributable to non-controlling interests
  • 34.
    Endnotes: Quebrada Blanca Slide26: QB2 Project 1. All-in sustaining costs (AISC) are net cash unit costs (also known as C1 cash costs) plus sustaining capital expenditures. Net cash unit costs are calculated after cash margin by-product credits assuming US$10.00/lb molybdenum and US$18.00/oz silver. Net cash unit costs for QB2 include stripping costs during operations. AISC, Net cash unit cost and cash margins for by-products are non-GAAP financial measures which do not have a standardized meanings prescribed by International Financial Reporting Standards (IFRS) or Generally Accepted Accounting Principles in the United States. These measures may differ from those used by other issuers and may not be comparable to such measures as reported by others. These measures are meant to provide further information about our financial expectations to investors. These measures should not be considered in isolation or used in substitute for other measures of performance prepared in accordance with IFRS. For more information on our calculation of non-GAAP financial measures please see our Management’s Discussion and Analysis for the year ended December 31, 2018, which can be found under our profile on SEDAR at www.sedar.com. Slide 27: QB2’s Competitive Cost Position 1. Source: Wood Mackenzie. Average 2021-2040. 2. C1 cash costs (also known as net cash unit costs) are presented after by-product credits assuming US$10.00/lb molybdenum and US$18.00/oz silver. C1 cash costs for QB2 include stripping costs during operations. Net cash unit costs and C1 cash costs are non-GAAP financial measures. See “Non-GAAP Financial Measures” slides. 3. All-in sustaining costs (AISC) are net cash unit costs (also known as C1 cash costs) plus sustaining capital expenditures. Net cash unit costs are calculated after cash margin by-product credits assuming US$10.00/lb molybdenum and US$18.00/oz silver. Net cash unit costs for QB2 include stripping costs during operations. AISC. Net cash unit cost and cash margins for by-products are non-GAAP financial measures. See “Non-GAAP Financial Measures” slides. Slide 28: Vast, Long Life Deposit at Quebrada Blanca 1. Reserves and resources as at December 31, 2020. 2. Based on Sanction Case mine plan tonnage. 3. Resources are reported separately from, and do not include that portion of resources classified as reserves. Slide 29: QB2 Project Economics Comparison 1. Based on go-forward cash flow from January 1, 2017. Based on all equity funding structure. 2. Based on go-forward cash flow from January 1, 2019. Based on optimized funding structure. 3. Life of Mine annual average figures exclude the first and last partial years of operations. 4. C1 cash costs are presented after by-product credits assuming US$10.00/lb molybdenum and US$18.00/oz silver. Net cash unit costs are consistent with C1 cash costs. C1 cash costs for QB2 include stripping costs during operations. Net cash unit costs and C1 cash costs are non-GAAP financial measures. See “Non-GAAP Financial Measures” slides. 5. All-in sustaining costs (AISC) are net cash unit costs (also known as C1 cash costs) plus sustaining capital expenditures. Net cash unit costs are calculated after cash margin by-product credits assuming US$10.00/lb molybdenum and US$18.00/oz silver. Net cash unit costs for QB2 include stripping costs during operations. AISC, Net cash unit cost and cash margins for by-products are non-GAAP financial measures. See “Non-GAAP Financial Measures” slides. Slide 30: QB2 Reserves and Resources Comparison 1. Mineral reserves are constrained within an optimized pit shell and scheduled using a variable grade cut-off approach based on NSR cut-off US$13.39/t over the planned life of mine. The life-of-mine strip ratio is 0.41. 2. Both mineral resource and mineral reserve estimates assume long-term commodity prices of US$3.00/lb Cu, US$9.40/lb Mo and US$18.00/oz Ag and other assumptions that include: pit slope angles of 30–44º, variable metallurgical recoveries that average approximately 91% for Cu and 74% for Mo and operational costs supported by the Feasibility Study as revised and updated. 3. Mineral resources are reported using a NSR cut-off of US$11.00/t and include 23.8 million tonnes of hypogene material grading 0.54% copper that has been mined and stockpiled during existing supergene operations. 4. Mineral reserves are constrained within an optimized pit shell and scheduled using a variable grade cut-off approach based on NSR cut-off US$18.95/t over the planned life of mine. The life-of-mine strip ratio is 0.70. 5. Mineral resources are reported using a NSR cut-off of US$11.00/t outside of the reserves pit. Mineral resources include inferred resources within the reserves pit at a US$ 18.95/t NSR cut-off and also include 23.8 million tonnes of hypogene material grading 0.54% copper that has been mined and stockpiled during existing supergene operations. 34
  • 35.
    Endnotes: Quebrada Blanca Slide31: QB2 Project Update 1. On a 100% go forward basis from January 1, 2019 including escalation and excluding working capital or interest during construction using actual realized exchange rates until March 30, 2020 and assuming a CLP/USD exchange rate of 775 from April 1, 2020. Includes approximately US$400 million in contingency. 2. Assumes a CLP/USD rate of 775 over the remainder of the project. A CLP 25 change in the CLP/USD exchange rate would change the capital cost estimate by approximately US$80 million. 3. As at December 31, 2020. Additional COVID-related costs will be incurred depending on the progress of the pandemic and response measures required. Slide 33: Quebrada Blanca Accounting Treatment 1. Sumitomo Metal Mining Co. Ltd. and Sumitomo Corporation are collectively referred to as Sumitomo. 35
  • 36.
  • 37.
    Global Customer Base Revenuecontribution from diverse markets 37 2020 Revenue by Business Unit Copper 27% Zinc 30% Steelmaking coal 38% Energy 5% 2020 Gross Profit Before Depreciation and Amortization1 by Business Unit Copper 44% Zinc 29% Steelmaking coal 35% Energy -8% 2020 Revenue by Geography India 6% China 21% Asia (ex. China/India) 33% North America 25% Latin America 2% Europe 13%
  • 38.
    Diverse Pipeline ofGrowth Options 38 In Construction Future Options Medium-Term Options Zinc Red Dog Satellite Deposits Cirque Teena Steelmaking Coal Elk Valley Brownfield Neptune Terminals Expansion Copper San Nicolás (Cu-Zn) QB2 Zafranal Mesaba NuevaUnión HVC Brownfield Schaft Creek Antamina Brownfield Galore Creek QB3
  • 39.
    Disciplined Approach toM&A 39 CdA Gold Stream1, $206M Project Corridor /Nueva Union, $0 Antamina Silver Stream2 $795M Osisko Royalty Package, $28M Sandstorm Royalty Package3 $32M HVC Minority, ($33M) Teena Minority4, ($11M) AQM Copper, ($25M) Wintering Hills, $59M San Nic Minority5, ($65M) IMSA’s stake in QB, ($208M) Waneta Dam, $1,200M6 QB2 Divestment (30%)7 $1,072M ($500) $0 $500 $1,000 $1,500 July 10 Aug 27 Oct 7 Oct 25 Jan 19 July 5 Oct 18 Nov 21 Jan 26 Oct 18 Apr 4 Jul 26 Mar 29 2015 2016 2017 2018 2019 Total net proceeds of C$3.1B:  Balance sheet strengthened by divestment of non-core assets at high EBITDA8 multiples  Modest ‘prudent housekeeping’ acquisitions to consolidate control of attractive copper and zinc development assets Recent Transaction History Net Proceeds (Cost) (C$M)
  • 40.
    Production Guidance 40 Units in000’s tonnes (excluding steelmaking coal, molybdenum, and bitumen) 2020 2021 Guidance1 3-Year Guidance1 (2022-2024) Copper2,3,4 Highland Valley 119.3 128-133 135-165 Antamina 85.6 91-95 90 Carmen de Andecollo 57.4 46-51 50-60 Quebrada Blanca6 13.4 10-11 - Total copper 275.7 275-290 275-315 Zinc2,3,5 Red Dog 490.7 490-510 510-550 Antamina 96.3 95-100 80-100 Total zinc 587.0 580-610 590-650 Refined zinc Trail 305.1 300-310 305-315 Steelmaking coal (Mt) 21.1 25.5-26.5 26.0-27.0 Bitumen3 (Mbbl) Fort Hills 8.4 8.6-12.1 14 Lead2 Red Dog 97.5 85-95 80-90 Molybdenum2,3 (Mlbs) Highland Valley 3.8 1.2-1.8 3.0-4.5 Antamina 1.5 1.0-1.4 2.0-3.0 Total molybdenum 5.1 2.2-3.2 5.0-7.5
  • 41.
    Sales and UnitCost Guidance 41 Unit Costs 2020 2021 Guidance1 Copper3 Total cash unit costs7 (US$/lb) $1.57 $1.65-1.75 Net cash unit costs4,7 (US$/lb) 1.28 1.30-1.40 Zinc5 Total cash unit costs7 (US$/lb) 0.53 $0.54-0.59 Net cash unit costs4,7 (US$/lb) 0.36 0.40-0.45 Steelmaking coal6 Adjusted site cash cost of sales7 $64 $59-64 Transportation costs 41 36-39 Inventory write-down 3 - Unit costs7 (C$/tonne) $108 $95-103 Bitumen Adjusted operating costs7 (C$/barrel) C$31.96 C$28-32 Sales Q4 2020 Q1 2021 Guidance1 Zinc2 Red Dog 149 90-100 Steelmaking coal (Mt) 6.1 5.9-6.3
  • 42.
    Capital Expenditures Guidance 42 (Teck’sshare in CAD$ millions) 2020 2021 Guidance1 Sustaining Copper $ 161 $ 160 Zinc 188 155 Steelmaking coal2 571 430 Energy 91 85 Corporate 12 - Total sustaining $ 1,023 $ 830 Growth3 Copper4 $ 41 $ 125 Zinc 7 25 Steelmaking coal 411 390 Corporate 4 5 $ 463 $ 545 Total Copper $ 202 $ 285 Zinc 195 180 Steelmaking coal 982 820 Energy 91 85 Corporate 16 5 $ 1,486 $ 1,375 (Teck’s share in CAD$ millions) 2020 2021 Guidance1 QB2 capital expenditures $ 1,643 $ 2,500 Total before SMM/SC contributions 3,129 3,875 Estimated SMM/SC contributions (660) (440) Estimated QB2 project financing draw to capex (983) (1,425) Total, net of partner contributions and project financing $ 1,486 $ 2,010 QB2 (Teck’s share in CAD$ millions) 2020 2021 Guidance1 Capitalized Stripping Copper $ 145 $ 205 Zinc 51 70 Steelmaking coal 303 295 $ 499 $ 570 Capitalized Stripping Sustaining and Growth Capital
  • 43.
    Commodity Price Leverage1 43 2021Mid-Range Production Estimates2,5 Change Estimated Effect on Annualized Profit3 ($M) Estimated Effect on Annualized EBITDA3 ($M) US$ exchange C$0.01 $44 $70 Copper (kt) 282.5 US$0.01/lb $5 $8 Zinc4 (kt) 902.5 US$0.01/lb $9 $12 Steelmaking coal (Mt) 26.0 US$1/tonne $19 $30 WCS5 (Mbbl) 10.4 US$1/bbl $9 $13 WTI6 US$1/bbl $6 $8
  • 44.
    Tax-Efficient Earnings inCanada and Chile 44 Canada: ~C$4.5 billion in available tax pools at December 31, 2020 • Includes: ‒ $3.8 billion in Canadian federal net operating loss carryforwards ‒ $0.3 billion in Canadian Development Expenses (30% declining balance p.a.) ‒ $0.4 billion in allowable capital loss carryforwards • Applies to cash income taxes in Canada • Does not apply to: ‒ Resource taxes in Canada ‒ Cash taxes in foreign jurisdictions Chile: ~C$800 million in available tax pools at December 31, 2020 • Chilean net operating loss carryforwards • Applies to cash income taxes for QB2
  • 45.
    Share Structure &Principal Shareholders 45 Shares Held Percent Voting Rights Class A Shareholdings Temagami Mining Company Limited 4,300,000 55.4% SMM Resources Inc (Sumitomo) 1,469,000 18.9% Other 1,996,503 25.7% 7,765,503 100.0% Class B Shareholdings Temagami Mining Company Limited 725,000 0.1% SMM Resources Inc (Sumitomo) 295,800 0.1% China Investment Corporation (Fullbloom) 59,304,474 11.3% Other 463,056,146 88.5% 523,381,420 100.0% Total Shareholdings Temagami Mining Company Limited 5,025,000 0.9% 33.1% SMM Resources Inc (Sumitomo) 1,764,800 0.3% 11.3% China Investment Corporation (Fullbloom) 59,304,474 11.2% 4.6% Other 465,052,649 87.6% 51.0% 531,146,923 100.0% 100.0% Teck Resources Limited at December 31, 2020
  • 46.
    Collective Agreements Operation ExpiryDates Elkview October 31, 2020 Fording River April 30, 2021 Antamina July 31, 2021 Highland Valley Copper September 30, 2021 Trail Operations May 31, 2022 Cardinal River June 30, 2022 Quebrada Blanca January 31, 2022 March 31, 2022 November 20, 2022 Carmen de Andacollo September 30, 2022 December 31, 2022 Line Creek May 31, 2024 46
  • 47.
    Endnotes: Overview Slide 37:Global Customer Base 1. Gross profit before depreciation and amortization is a non-GAAP financial measure. See “Non-GAAP Financial Measures” slides. Slide 38: Disciplined Approach to M&A 1. Carmen de Andacollo gold stream transaction occurred in USD at US$162 million. 2. Antamina silver stream transaction occurred in USD at US$610 million. 3. Sandstorm royalty transaction occurred in USD at US$22 million. 4. Teena transaction occurred in AUD at A$10.6 million. 5. San Nicolàs transaction occurred in USD at US$50 million. 6. Waneta Dam transaction closed July 26, 2018 for C$1.2 billion. 7. QB2 Partnership (sale of 30% interest of project to Sumitomo; SMM and SC) for total consideration of US$1.2 billion, including US$800 million earn-in and US$400 million matching contribution; converted at FX of 1.34 on March 29, 2019. 8. EBITDA is a non-GAAP financial measure. See “Non-GAAP Financial Measures” slides. Slide 40: Production Guidance 1. As at February 17, 2021. See Teck’s Q4 2020 press release for further details. 2. Metal contained in concentrate. 3. We include 100% of production and sales from our Quebrada Blanca and Carmen de Andacollo mines in our production and sales volumes, even though we do not own 100% of these operations, because we fully consolidate their results in our financial statements. We include 22.5% and 21.3% of production and sales from Antamina and Fort Hills, respectively, representing our proportionate ownership interest in these operations. 4. Copper production includes cathode production at Quebrada Blanca and Carmen de Andacollo. 5. Total zinc includes co-product zinc production from our 22.5% proportionate interest in Antamina. 6. Three-year guidance 2022 —2024 excludes production from QB2. Slide 41: Sales and Unit Cost Guidance 1. As at February 17, 2021. See Teck’s Q4 2020 press release for further details. 2. Metal contained in concentrate. 3. Copper unit costs are reported in U.S. dollars per payable pound of metal contained in concentrate. Copper net cash unit costs include adjusted cash cost of sales and smelter processing charges, less cash margins for by-products including co-products. Guidance for 2021 assumes a zinc price of US$1.22 per pound, a molybdenum price of US$8.50 per pound, a silver price of US$20 per ounce, a gold price of US$2,000 per ounce and a Canadian/U.S. dollar exchange rate of $1.30. 4. After co-product and by-product margins. 5. Zinc unit costs are reported in U.S. dollars per payable pound of metal contained in concentrate. Zinc net cash unit costs are mine costs including adjusted cash cost of sales and smelter processing charges, less cash margins for by-products. Guidance for 2021 assumes a lead price of US$0.85 per pound, a silver price of US$20 per ounce and a Canadian/U.S. dollar exchange rate of $1.30. By-products include both by-products and co-products. 6. Steelmaking coal unit costs are reported in Canadian dollars per tonne. 7. Non-GAAP financial measure. See “Non-GAAP Financial Measures” slides. 47
  • 48.
    Endnotes: Overview Slide 42:Capital Expenditures Guidance 1. As at February 17, 2021. See Teck’s Q4 2020 press release for further details. 2. Steelmaking coal sustaining capital guidance for 2021 includes $255 million of water treatment capital. 2020 includes $267 million of water treatment capital. 3. Growth expenditures include RACE21TM capital expenditures for 2021 of $120 million, of which $80 million relates to steelmaking coal, $30 million relates to copper, $5 million relates to zinc and $5 million relates to corporate projects. 4. Copper growth guidance for 2021 includes studies for HVC 2040, Antamina, QB3, Zafranal, San Nicolás and Galore Creek. Slide 43: Commodity Price Leverage 1. As at February 17, 2021. The sensitivity of our annual profit attributable to shareholders and EBITDA to changes in the Canadian/U.S. dollar exchange rate and commodity prices, before pricing adjustments, based on our current balance sheet, our 2021 mid-range production estimates, current commodity prices and a Canadian/U.S. dollar exchange rate of $1.30. See Teck’s Q4 2020 press release for further details. 2. All production estimates are subject to change based on market and operating conditions. 3. The effect on our profit attributable to shareholders and on EBITDA of commodity price and exchange rate movements will vary from quarter to quarter depending on sales volumes. Our estimate of the sensitivity of profit and EBITDA to changes in the U.S. dollar exchange rate is sensitive to commodity price assumptions. 4. Zinc includes 305,000 tonnes of refined zinc and 597,500 tonnes of zinc contained in concentrate. 5. Bitumen volumes from our energy business unit. 6. Our WTI oil price sensitivity takes into account our interest in Fort Hills for respective change in revenue, partially offset by the effect of the change in diluent purchase costs as well as the effect on the change in operating costs across our business units, as our operations use a significant amount of diesel fuel. 48
  • 49.
  • 50.
    Sustainability Reporting &Rankings 50 • Top-ranked mining company World & North American Indices • Gold Class Award 2021 • “A” rating since 2013 • Outperforming 4 of 5 largest peers • Top ranked diversified metals mining company • Top ranked North American company • #1 in the mining subsector • Ranked among the top 10% of Metals & Mining companies Our Reporting Frameworks GRI Standards Helps businesses, government and stakeholders communicate and understand impact of business on sustainability issues SASB Standards Helps businesses identify, manage and report on sustainability topics of greatest interest to investors Task Force on Climate Related Financial Disclosures (TCFD) Helps businesses quantify and communicate climate change risks and opportunities ESG Rankings
  • 51.
    Focus on SustainabilityLeadership Ambitious sustainability goals in eight strategic themes 51 Climate Change Responsible Production Water Tailings Management Biodiversity and Reclamation Health and Safety Our People Communities and Indigenous Peoples
  • 52.
    Sustainability Leadership Aligned withLeading External Standards and Practices 52 See the full list on our Memberships and Partnerships page: https://www.teck.com/responsibility/approach-to-responsibility/policies-and-commitments/memberships-&-partnerships/
  • 53.
    Health and Safety Oursafest year on record in 2020 • Safety performance in 2020 - 32% reduction in High-Potential Incident Frequency - 23% decrease in Lost-Time Disabling Injury Frequency 53 Teck Operated Incident Frequency (per 200,000 hours worked) 0.00 0.10 0.20 0.30 0.40 0.50 0.60 0.70 2016 2017 2018 2019 2020 High-Potential Incident Frequency Serious High-Potential Incident Frequency Potentially Fatal Occurrence Frequency High-Potential Incident Frequency rate reduced by two-thirds over past five years
  • 54.
    Climate Action Positioning forLow-Carbon Economy Well positioned for a low-carbon economy Among lowest GHG intensity miners globally on a copper-equivalent basis GHG intensity for steelmaking coal and copper production among lowest in industry Carbon pricing already built into majority of business Scope 1+2 emissions per copper equivalent ranking1 (tCO2e/t CuEq, 2017) 54 1. Source: Barclays Research, Teck.
  • 55.
    Climate Action Key Activitiesfor Short-Term Goals 55 Investing in lower-carbon means of transportation such as electric haul trucks, conveyors and other approaches Reduce the carbon intensity of our operations by 33% by 2030 Electric bus pilot project represents the first use of electric passenger buses for employee transport in the Canadian mining industry Accelerate the adoption of zero-emissions alternatives for transportation by displacing the equivalent of internal combustion engine (ICE) vehicles by 2025 1,000 Procure of our electricity demands in Chile from clean energy by 2025 and In 2020 two power purchase agreements announced: - Over 50% of QB2 operating power requirement from renewables - 100% renewable power at Carmen de Andacollo 100% by 2030 50%
  • 56.
    Climate Action Path toCarbon Neutrality Mitigation Hierarchy Apply Decarbonization Framework Prioritize Opportunities and Deliver Cost Competitive Reductions Avoid Eliminate Minimize Offset Emissions sources Power supply Mobile equipment Stationary combustion and process Fugitive methane emissions Renewable energy Electrification and alternative material handling Select abatement options Electrification and low carbon fuels Methane recovery and abatement Time 2020-2030: Target readily available, cost competitive technologies in these areas 56
  • 57.
    Implement innovative watermanagement and water treatment solutions to protect water quality downstream of all our operations. Transition to seawater or low-quality water sources for all operations in water-scarce regions by 2040. 57 Water Management Long Term Strategic Priorities and Goals
  • 58.
    Water Quality inthe Elk Valley Advancing Innovative Technologies 58 Saturated Rock Fill Nitrate Reduction Elk Valley Water Quality Plan developed with government, Indigenous Peoples and communities to address water quality challenges
  • 59.
    Elk Valley WaterTreatment Clear Path Forward for Improving Water Quality 59 Millions of Litres per Day
  • 60.
    Tailings Management Our Approach •Full implementation of the Global Industry Standard on Tailings Management underway with full conformance by 2023 • Management and emergency response aligned with Towards Sustainable Mining Protocols • Enhanced transparency & disclosure ‒ Facilities inventory posted www.teck.com ‒ Detailed response to the tailings facility enquiry from the Church of England Pensions Board and Swedish Council on Ethics for the AP Funds Teck has comprehensive systems and procedures in place based on 6 levels of protection: Surveillance Technology 1 Internal Inspections 2 Annual Dam Safety Inspections 3 Internal Governance Reviews 4 Detailed Third-Party Reviews 5 Independent Tailings Review Boards 6 60
  • 61.
    • Agreements inplace at all mining operations within or adjacent to Indigenous Peoples’ territories • $192 million to Indigenous businesses in 2020 through procurement • 72% of total local employment in 2020 • $19 million in community investment in 2020 • Zero significant incidents that were human rights related in 2020 • Released updated Human Rights Policy in April 2020, first established in 2012 Relationships with Communities and Indigenous Peoples, Respecting Human Rights 61 Related SASB1 Metric: EM-MM-210a.3 | Link to Data Related SASB1 Metric: EM-MM-210b.1 | Link to Data
  • 62.
    Inclusion and Diversity •Inclusion and Diversity: committed to improve representation of under-represented groups in our workforce: women, Indigenous, Asian, Black, and all people of colour (BIPOC), persons with disabilities, and members of the LGBTQ+ community • Gender Diversity: 20% of workforce are women; 25% of Board of Directors, including the Chair; 29% of new hires • Workplace Flexibility: family-friendly policies and programs in place, expanding remote working policy • Employee engagement and feedback: 24-hour hotline, site-based inclusion and diversity chairs, leadership development programs 62 Range of projects in place to promote inclusion and diversity, including STEM leadership courses at Trail Operations
  • 63.
    • Compensation programis linked to sustainability and health and safety performance through individual, department and company-wide objectives. • Objectives related to climate change, communities and Indigenous Peoples, tailings and water management and others can affect bonuses by at least 10%–20%. • Incentive compensation of the CEO and senior officers includes sustainability performance indicators. 63 Sustainability Performance and Compensation
  • 64.
    Questions and FurtherInformation ESG Resources for Investors Please see our Disclosure Portal and Sustainability Information for Investors 64 • Sustainability reporting for 20 years in Core accordance with the Global Reporting Initiative (GRI) Standards and G4 Mining and Metals Sector Disclosures • Report is aligned with Sustainability Accounting Standards Board (SASB) • Task Force for Climate- Related Financial Disclosure (TCFD) aligned report “Portfolio Resilience in the Face of Climate Change” published in 2019 • Detailed COVID-19 Response page
  • 65.
  • 66.
    RACE21TM Our innovation-driven businesstransformation program 66 • Unify and modernize Teck’s core systems • Establish technology foundation that facilitates deployment of Connect and Automate reliably and at scale • For example: Wireless site infrastructure to support automation, sensing, site communications, information access, pit-to-port integration and advanced analytics • Accelerate and scale autonomy program • Transformational shift in safety • Reduce per-tonne mining costs with smaller fleets • Provide innovation platform to enable implementation of advanced analytics to drive cycle time improvement & predictive maintenance Renew Automate
  • 67.
    RACE21TM Our innovation-driven businesstransformation program 67 • Link disparate systems into a collaborative digital platform with powerful tools for sensing and analyzing in real time • For example: Dynamic and predictive models to reduce variability, leading to significant improvements in throughput and recovery • The natural implication of Renew, Automate, and Connect is we can re-imagine what it means to work at Teck and re-design our operating model to attract, recruit, train and retain the workforce of the future Connect Empower
  • 68.
    Significant Value HasBeen Captured 68 COST Reduced operational costs PROFITABILITY Step-change impact to profitability SAFETY Transformational safety impact PRODUCTIVITY Increased productivity through technology and innovation Advanced data analytics and artificial intelligence to reduce risk of heavy vehicle / light vehicle interactions Increased copper throughput by ~7% and recovery by ~2% at Highland Valley Copper Advanced analytical tools contributed to record haul truck productivity across our major mine sites Blending optimization tools used at Trail Operations to reduce costs
  • 69.
  • 70.
    Steelmaking Coal Market Chinaban of Australian coal pushing seaborne CFR China price higher Near term outlook: An eventual end to “China ban” would increase FOB Australia prices • China: 2020 are 2nd highest seaborne imports despite ban of Australian coal effective October 2020 • Ex-China markets: Demand resurgence with >80% banked blast furnaces restarted or announced to restart • Supply: Cost curve and supply response (COVID-19, “China ban”, and mine disruptions) provide price support Longer term outlook: Fundamentals remain unchanged • China: Declining domestic reserves and persistent demand by coastal steel mills and new projects • Ex-China markets: Mid-term demand boosted by government stimulus and long-term growth supported by Indian government targets, limited scrap supply and continued urbanization • Supply: Declining existing capacity and minimal project pipeline (low investment and permitting challenges) 70 Strong coal fundamentals underpinned by global economic recovery Steelmaking Coal Prices1 (US$/t) 10-year average Seaborne FOB price of ~US$170/t, or ~US$180/t on an inflation-adjusted basis 0 50 100 150 200 250 Jan-20 Feb-20 Mar-20 Apr-20 May-20 Jun-20 Jul-20 Aug-20 Sep-20 Oct-20 Nov-20 Dec-20 Jan-21 Feb-21 Chinese Domestic CFR Equivalent CFR China FOB Australia
  • 71.
    Steelmaking Coal Facts GlobalCoal Production1: ~7.8 billion tonnes Steelmaking Coal Production2: ~1,130 million tonnes Export Steelmaking Coal2: ~320 million tonnes Seaborne Steelmaking Coal2: ~285 million tonnes 71 • ~0.7 tonnes of steelmaking coal is used to produce each tonne of steel3 • Up to 100 tonnes of steelmaking coal is required to produce the steel in the average wind turbine4 Our market is seaborne hard coking coal2: ~190 million tonnes
  • 72.
    Steelmaking Coal DemandGrowth Forecast Continued recovery with >80% banked blast furnaces restarted/announced restart Seaborne Steelmaking Coal Imports1 (Mt) Change 2021 vs. 2020 72 Includes: • China: Expected recovery of Mongolian exports • Europe/JKT: Restarting banked furnaces • India: Growing steel production (unchanged long-term fundamentals) • Brazil: Strong domestic demand (residential construction, automotive) and export market • SE Asia: Economic recovery (demand growth from Vietnam 291 310 11 5 4 3 2 6 260 270 280 290 300 310 320 2020 China Europe India JKT Brazil SE Asia 2021E
  • 73.
    Indian Steelmaking CoalImports Mid- & long-term imports supported by secular demand and government targets 73 Indian Seaborne Coking Coal Imports2 (Mt) Indian Crude Steel Production1 (Mt) 0 10 20 30 40 50 60 0 20 40 60 80 100 120 India 2021 crude steel production and seaborne coking coal imports return to 2019 levels
  • 74.
    Chinese Steelmaking CoalImports 2020 seaborne imports up by +8 Mt 74 Chinese Coking Coal Imports2 (Mt) Chinese Crude Steel Production (CSP), Hot Metal Production (HMP) and Coal Production (Mt)1 Higher China coal production and lower Mongolia imports in 2020. • +4Mt YoY for domestic coking coal production • -10Mt YoY for Mongolian coking coal imports • 2020 record high crude steel production @ 1.05 billion tonnes 0 100 200 300 400 500 600 0 200 400 600 800 1,000 1,200 CSP (LHS) HMP (LHS) Coking Coal Production (RHS) 25 35 60 48 35 36 44 37 41 49 43 20 19 16 15 13 24 26 28 34 24 30 0 10 20 30 40 50 60 70 80 Seaborne Coking Coal Imports Mongolian Coking Coal Imports
  • 75.
    Large Users inChina Increasing Imports ~2/3 of China crude steel produced on coast; projects support imports 75 HBIS LAOTING PROJECT • Inland plant relocating to coastal area • Capacity: crude steel 20 Mt • Status: Construction started in 2017; 2 of 3 BFs commissioned; #3 BF to commission in 2021 ZONGHENG FENGNAN PROJECT • Inland plant relocating to coastal area • Capacity: crude steel 8 Mt • Status: Construction started in 2017; all 4 BFs completed and commissioned in 2019 and 2020. SHOUGANG JINGTANG PLANT • Expansion • Capacity: crude steel 9.4 Mt (phase 2) • Status: Construction started in 2015; 1 of 2 BFs completed in Apr 2019 LIUSTEEL FANGCHENG PROJECT • Greenfield project • Capacity: Phase 1 crude steel ~10 Mt • Status: Construction started in 2017; 1 of 3 BFs completed in June 2020; #2 BF to commission in 2021 BAOWU ZHANJIANG PLANT • Expansion • Capacity: crude steel 3.6 Mt (phase 2) • Status: Construction started in Apr 2019; completion in 2021 BAOWU YANCHENG PROJECT • Inland plant relocating to coastal area • Capacity: crude steel 20 Mt (phase 1: 8-10 Mt) • Status: Phase 1 construction started in May 2019
  • 76.
    Chinese Steel Margins Marginsturn negative China Hot Rolled Coil (HRC) Margins and Steelmaking Coal (HCC) Prices1 (US$/t) 76
  • 77.
    Chinese Scrap UseRemains Low Scrap supply limits EAF share in steel output 77 China’s Scrap Ratio Lower than Other Countries (20191) Crude Steel Electric Arc Furnace Hot Metal China Steel Use By Sector (2000-2019)2 2025 EAF share forecast to be similar to 2010 83% 69% 55% 42% 40% 34% 22% 0% 20% 40% 60% 80% 100% Turkey USA EU Russia Korea Japan China 0 200 400 600 800 1000 1200 2010 2012 2014 2016 2018 2020 2022 2024 Construction 50-60% Machinery 15-20% Auto 5-10% Others 15-25%
  • 78.
    Steelmaking Coal SupplyGrowth Forecast Supply forecasted to recover amid growing demand Seaborne Steelmaking Coal Exports1 (Mt) Change 2021 vs. 2020 78 Includes: • Australia: Growth from existing mines and potential mine restarts • (Anglo’s Grosvenor, Peabody’s Metropolitan, Sojitz’s Crinum) • USA: Recovering demand from Europe and Brazil and higher exports to China (China’s ban on Australian coal) • Canada: Growth from existing mines • Russia: Higher exports to China and potential mine expansion projects • (Kolmar’s and Evraz’s existing mines, A-Property’s Elga) • Mozambique: Growth from Vale’s Moatize • Indonesia: ramp-up from newly commissioned mines • (Adaro’s Lampunut or Cokal’s BBM) 283 306 6 6 5 3 1 1 1 260 270 280 290 300 310 2020 Australia USA Russia Canada Mozambique Indonesia Supply Others 2021E
  • 79.
    US Coal Producersare Swing Suppliers 79 US Steelmaking Coal Exports1 (Mt) Australian Steelmaking Coal Exports1 (Mt) 0 20 40 60 80 100 120 140 160 180 200 0 10 20 30 40 50 60 70
  • 80.
    Canadian & MozambiqueSteelmaking Coal Exports 80 Mozambique Exports2 (Mt) Canadian Exports1 (Mt) 0 5 10 15 20 25 30 35 40 0 1 2 3 4 5 6 7 8 9
  • 81.
    2nd Largest SeaborneSteelmaking Coal Supplier Competitively positioned to supply steel producers worldwide 81 CHINA 2013: ~30% 2017: ~15% 2019: ~10% 2020: ~15% INDIA 2013: ~5% 2017: ~10% 2019: ~15% 2020: ~15% Sales Distribution AMERICAS ~5% EUROPE 2013: ~15% 2017: ~20% 2019: ~15% 2020: ~15% ASIA EXCL. CHINA & INDIA 2013: ~40% 2017: ~45% 2019: ~55% 2020: ~50% Targeting increased sales to China to capture current CFR China price premium
  • 82.
    82 ¯ • 811 milliontonnes1 of reserves support 26 to 27 million tonnes of long term annual production • The Neptune Bulk Terminals upgrade to secure >18.5 Mt of exclusive port capacity ‒ Lower cost and more reliable port access for steelmaking coal ‒ Established infrastructure and supply chain capacity with mines and railways • Geographically concentrated in the Elk Valley, BC, Canada • Stable long term strip ratio High-Quality Steelmaking Coal Business
  • 83.
    Steelmaking Coal BusinessOperating Strategy 83 26 to 27 million tonnes of long term annual production capacity • Increase margins not volumes • Maximize synergies in the Elk Valley, BC, Canada • Optimize supply chain • Productivity focus • Sustain strong cash flow on a restructured cost base
  • 84.
    Steelmaking Coal UnitCosts 84 Operating Cost1 Breakdown in 2020 Labour 34% Contractors and Consultants 13% Operating Supplies 16% Repairs and Maintenance Parts 19% Energy 14% Other 4% Total 100% Transportation 29% Depreciation and Amortization 24% Operating Costs 47% Unit Costs1 in 2020
  • 85.
    Setting Up forStrong Long-Term Cash Flows in Steelmaking Coal 85 Executing on four pillars to transform cost structure and optimize margins 1. Decline in strip ratio 2. Strategically replaced high-cost tonnes with low-cost tonnes 3. RACE21TM transformation ‒ Lowering operating costs and increasing EBITDA1 potential 4. Neptune capacity increase and third party logistics contracts ‒ Lowering port costs, increase logistics chain flexibility and improved reliability
  • 86.
    82% 90% 92% 99% 101% 100% 103% 102% 105% 80% 85% 90% 95% 100% 105% 110% 20122013 2014 2015 2016 2017 2018 2019 2020 86 Truck Productivity4 (SHM%) RACE21™ innovation-driven business transformation • Record 2020 haul truck productivity improvement • Advanced plant analytics • Autonomous haulage strategy ‒ Substantial completion of the autonomous haulage pilot at Elkview Operations by year end Mid-Point 2021 Production Guidance2 Change Estimated Effect on Annualized Profit3 Estimated Effect on Annualized EBITDA3 Coal 26.0 Mt US$50/t C$950M C$1,500M Strong cash flow generation1 Steelmaking Coal Continues To Deliver Strong Returns
  • 87.
    Sustain Production Capacityand Productivities In Steelmaking Coal Maintaining historical dollar per tonne sustaining investment levels 2010-2016: Average spend of ~$11 per tonne1 • Swift at Fording River and Line Creek • Reinvestment in 5 shovels, 50+ haul trucks 2017-2024: Average spend of ~$11-13 per tonne1 • Plant expansion at Elkview, mine life extension projects and Neptune sustaining investments • Reinvestment in equipment fleets and infrastructure to increase mining productivity and processing efficiencies 87 Sustaining capital is now inclusive of production capacity investments previously called Major Enhancement. Sustaining Capital, Excluding Water Treatment1 ($/t) Long term run rate for sustaining capital is ~$11-13 per tonne
  • 88.
    SALES MIX • ~40%quarterly contract price • ~60% shorter than quarterly pricing mechanisms (including “spot”) PRODUCT MIX • ~75% of production is high-quality HCC • ~25% is a combination of SHCC, SSCC, PCI • Varies quarter-to-quarter based on the mine plans KEY FACTORS IMPACTING TECK’S AVERAGE REALIZED PRICES • Variations in our product mix • Timing of sales • Direction and underlying volatility of the daily price assessments • Spreads between various qualities of steelmaking coal • Arbitrage between FOB Australia and CFR China pricing Teck’s Pricing Mechanisms Coal sales book generally moves with the market 88 Index Linked Sales • Quarterly contract sales index linked • Contract sales index linked • Contract sales with index fallback • Spot sales index linked Fixed Price Sales • Contract sales spot priced • Contract sales with index fallback • Spot sales with fixed price 70% 30% Index Linked Fixed Price Pricing Mechanisms (%)
  • 89.
    (100) (75) (50) (25) 0 25 50 75 100 0 50 100 150 200 250 300 350 Jun-16 Oct-16 Feb-17 Jun-17 Oct-17 Feb-18 Jun-18 Oct-18 Feb-19 Jun-19 Oct-19 Feb-20 Jun-20 Oct-20 Feb-21 Seaborne HCC CFRChina (LHS) Domestic HCC CFR China (LHS) Seaborne / Domestic spread (RHS) Quality and Basis Spreads Impact on Teck’s average realized steelmaking coal prices HCC Seaborne / China Domestic Prices and Spread2 (US$/t) HCC / SHCC Prices and Spread1 (US$/t) 89 0 25 50 75 100 0 50 100 150 200 250 300 350 Jun-16 Oct-16 Feb-17 Jun-17 Oct-17 Feb-18 Jun-18 Oct-18 Feb-19 Jun-19 Oct-19 Feb-20 Jun-20 Oct-20 Feb-21 HCC (LHS) SHCC (LHS) HCC / SHCC spread (RHS)
  • 90.
    West Coast PortCapacity 90 • Current capacity 35 Mtpa • Teck contracted capacity, following expiry of our current contract on March 31, 2021: ‒ 2021: 12.55-13.55 Mt, including ~5 Mt in Q1 2021 ‒ From 2022: 5-7 Mtpa at fixed loading charges ‒ Total of 33 Mt over agreement term WESTSHORE TERMINALS • World class design and equipment for enhanced reliability • Capacity growth to >18.5 Mtpa • ~$150M infrastructure investment in upstream supply chain • 100% ownership of coal capacity NEPTUNE COAL TERMINAL • Current capacity 18 Mtpa • Teck contract: ‒ January 2021 to December 2027 ‒ Ramps up to 6 Mtpa over 2021 RIDLEY TERMINALS Teck’s Contracted West Coast Port Capacity (Nominal Mt) Westshore Terminals Neptune Coal Terminal Ridley Terminals 6 5-7 >18.5
  • 91.
    • Achieved 90%overall completion at end of January 2021 • All major equipment has been installed • Significant new facilities have been placed into operation and are performing to plan • First coal through the upgraded facility is expected in early Q2 2021 Neptune Facility Upgrade Update Final stage of construction 91 Secures a long-term, low-cost and reliable supply chain for steelmaking coal
  • 92.
    Endnotes: Steelmaking Coal Slide70: Steelmaking Coal Market 1. Ten-year steelmaking coal prices are calculated from January 1, 2011. Inflation-adjusted prices are based on Statistics Canada’s Consumer Price Index. Source: Argus, Teck. As at February 19, 2021. Slide 71: Steelmaking Coal Facts 1. Source: IEA. 2. Source: Wood Mackenzie (Long Term Outlook H2 2020). 3. Source: World Coal Association. Assumes all of the steel required is produced by blast furnace-basic oxygen furnace route. 4. Source: The Coal Alliance. Assumes all of the steel required is produced by blast furnace-basic oxygen furnace route. Slide 72: Steelmaking Coal Demand Growth Forecast 1. Source: Data compiled by Teck based on information from Wood Mackenzie (Short Term Outlook January 2021). Slide 73: Indian Steelmaking Coal Imports 1. Source: Data compiled by Teck based on information from WSA and CRU (Crude Steel Market Outlook October 2020). 2. Source: Data compiled by Teck based on information from Global Trade Atlas and CRU (Metallurgical Coal Market Outlook November 2020). 2020 and 2021 are based on information from CRU. Slide 74: Chinese Steelmaking Coal Imports 1. Source: Data compiled by Teck based on information from NBS, Wood Mackenzie (Long Term Outlook H2 2020), and Fenwei. 2021 is based on information from Wood Mackenzie and Fenwei. 2. Source: Data compiled by Teck based on information from China Customs and Wood Mackenzie (Short Term Outlook January 2021). 2021 is based on information from Wood Mackenzie. Slide 75: Large Users in China Increasing Imports 1. Source: Data compiled by Teck based on information from China Customs, Fenwei and Teck. Slide 76: Chinese Steel Margins 1. Source: China HRC Gross Margins is estimated by Mysteel. China Domestic HCC Price is Liulin #4 price sourced from Sxcoal and is normalized to CFR China equivalent. Seaborne HCC Price (CFR China) is based on Argus Premium HCC CFR China. Plotted to February 5, 2021. Slide 77: Chinese Scrap Use Remains Low 1. Source: Data compiled by Teck based on information from Bureau of International Recycling. 2. Source: Data compiled by Teck based on information from China Metallurgy Industry Planning and Research Institute. 3. Source: Data compiled by Teck based on information from Wood Mackenzie (Long Term Outlook H2 2020) and CRU (Crude Steel Market Outlook October 2020). Slide 78: Steelmaking Coal Supply Growth Forecast 1. Source: Data compiled by Teck based on information from Wood Mackenzie (Short Term Outlook January 2021). Slide 79: US Coal Producers are Swing Suppliers 1. Source: Data compiled by Teck based on information from Global Trade Atlas and Wood Mackenzie (Short Term Outlook January 2021). Slide 80: Canadian & Mozambique Steelmaking Coal Exports 1. Source: Data compiled by Teck based on information from Global Trade Atlas, Wood Mackenzie (Short Term Outlook January 2021). 2. Source: Data complied by Teck based on information from Wood Makenzie. 2010-2020 are based on information from Wood Mackenzie (Long Term Outlook H2 2020). 2021 is based on information from Wood Mackenzie (Short Term Outlook January 2021). 92
  • 93.
    Endnotes: Steelmaking Coal Slide82: High-Quality Steelmaking Coal Business 1. As at December 31, 2020, Teck portion, excluding oxide. Based on Teck’s 2020 Annual Information Form. Slide 84: Steelmaking Coal Unit Costs 1. Steelmaking coal unit costs are reported in Canadian dollars per tonne. Non-GAAP financial measures. See “Non-GAAP Financial Measures” slides. Slide 85: Setting Up for Strong Long-Term Cash Flows in Steelmaking Coal 1. EBITDA is a non-GAAP financial measure. See “Non-GAAP Financial Measures” slides. Slide 86: Steelmaking Coal Continues to Deliver Exceptional Returns 1. As at February 17, 2021. The sensitivity of our annual profit attributable to shareholders and EBITDA to changes in the Canadian/U.S. dollar exchange rate and commodity prices, before pricing adjustments, based on our current balance sheet, our 2021 mid-range production estimates, current commodity prices and a Canadian/U.S. dollar exchange rate of $1.30. See Teck’s Q4 2020 press release for further details. 2. All production estimates are subject to change based on market and operating conditions. 3. The effect on our profit attributable to shareholders and on EBITDA of commodity price and exchange rate movements will vary from quarter to quarter depending on sales volumes. Our estimate of the sensitivity of profit and EBITDA to changes in the U.S. dollar exchange rate is sensitive to commodity price assumptions. EBITDA is a non-GAAP financial measure. See “Non-GAAP Financial Measures” slides. 4. Productivity reflects performance of Teck’s waste haul truck fleet against an internal baseline standard haulage model (SHM) that anticipates an expected rate of material movement per equipment operating hour taking into account size of truck fleet, haul distance, grade and other road design elements. Slide 87: Sustain Production Capacity and Productivities in Steelmaking Coal 1. Historical spend has not been adjusted for inflation or foreign exchange. 2021-2025 average spend assumes annualized average production of 27 million tonnes. All dollars referenced are Teck’s portion net of POSCAN credits for Greenhills Operations at 80% and excludes the portion of sustaining capital relating to water treatment. Sustaining capital is now inclusive of production capacity investments previous called Major Enhancement. Excludes capital leases and growth capital. Slide 89: Quality and Basis Spreads 1. HCC price is average of the Argus Premium HCC Low Vol, Platts Premium Low Vol and TSI Premium Coking Coal assessments, all FOB Australia and in US dollars. SHCC price is average of the Platts HCC 64 Mid Vol and TSI HCC assessments, all FOB Australia and in US dollars. Source: Argus, Platts, TSI. Plotted to February 10, 2021. 2. Seaborne HCC CFR China price is average of the Argus Premium HCC Low Vol, Platts Premium Low Vol and TSI Premium Coking Coal assessments, all CFR China and in US dollars. Domestic HCC CFR China is Liulin #4 normalized to CFR Jingtang Port in US dollars. Source: Argus, Platts, TSI, Sxcoal. Plotted to February 5, 2021. 93
  • 94.
  • 95.
    Supply Continues tobe at Risk; Copper Demand Improves • Demand for imported cathode into China stronger each quarter YOY in 2020 • Demand outlook ex-China improving • 2021 mine production remains at risk with ongoing disruptions • Concentrate market tightness continues into 2021, COVID-19 restrictions to impact 2021 supply • Scrap availability improving on higher prices • Mine growth to resume in 2022 and peak in 2024, with multi year gap for next projects due to COVID-19 and subject to future copper price • Global stimulus positive for metals demand, risk that further lockdowns could affect short-term consumer demand 95
  • 96.
    Copper Market Raw materialsweigh on downstream production • Demand for raw materials and mine disruptions kept concentrate demand high ‒ Mine production cuts over 1.4 Mt vs. smelter cuts of ~400 kt ‒ Chinese smelters and rod mills operate through Lunar New Year ‒ Spot TC/RC drop to high $20s – low 30s • Scrap availability improving on higher prices and change in scrap import classification ‒ Loss of scrap impacts supply and increases cathode demand • LME/SHFE stocks fall through 2021, LME price and Chinese premiums rise • Chinese cathode premiums US$60-65 per tonne in Q1 2021 Copper Scrap is 18% of Supply and 20% of Total Demand2 Scrap Demand Increases on Higher Copper Price1 96 Cathode Demand 23.6 Mt Copper Demand 29.6 Mt Wire Rod 74% Billet 13% Cable/Slab 13% Electrical Network 28% Construction 28% Industrial Machinery 11% Consumer & General 21% Transport 12% (1,000) - 1,000 2,000 3,000 Jan-19 Apr-19 Jul-19 Oct-19 Jan-20 Apr-20 Jul-20 Oct-20 Jan-21 RMB/Mt Price Spread between #1 Bare Bright Copper and Copper Cathode Rational Price Spread
  • 97.
    • Chinese mineproduction flat to 2024 on lack of resources • Total probable projects: 900 kmt Mine kmt Kamoa – Kakula 535 PT – Freeport (vs 2019) 435 Quebrada Blanca 2 300 Quellaveco to 2024 275 Cobre Panama 252 China to 2024 345 All others (Spence, Chuqui UG, Escondida) 1,090 SXEW Reductions to 2024 (360) Reductions & Closures (654) Mine Production Set To Increase 2.2 Mt By 20241 Includes: 97 Global Copper Mine Production Increasing Slowly 12,000 14,000 16,000 18,000 20,000 22,000 2018 2019 2020 2021 2022 2023 2024 2025 2026 2027 Other China PT Freeport Cobre Panama Quellaveco Quebrada Blanca Kamoa-Kakula New Mines Global Copper Mine Production2 (kt contained)
  • 98.
    98 $20 $30 $40 $50 $60 $70 $80 $90 $100 $110 $120 Annual/Mid Year Spot TC/RCsSpot and Annual Falling1 (US$/lb) Copper Disruptions Continue To Impact Mines Disruptions (kt)2; -1,800 -1,600 -1,400 -1,200 -1,000 -800 -600 -400 -200 0 2005 2007 2009 2011 2013 2015 2017 2019 2021 3.6% 2.7% 4.0% 6.5% Reported to Date 7.0% Run Rate
  • 99.
    Rapid Growth inChinese Copper Smelter Capacity China added 3.2 Mt since 2019 (2.1 Mt still ramping up) 99 Chinese Copper Mine Growth1 (kt) 0 100 200 300 400 2021 137kt 2022 130 kt 2023 25 kt 0 100 200 300 400 +2.1 Mt of New Smelting Capacity2 (kt blister) 2020 510 kt 2021 – 2023 1,615 kt
  • 100.
    Copper Supply Chinese importsshift to concentrates to feed smelter capacity increases 100 Chinese Imports Shift to Concentrates3 (Copper content, kt) 0 2,000 4,000 6,000 8,000 10,000 12,000 2016 2017 2018 2019 2020 2021e 2022e Concentrates Blister Scrap Cathode Chinese Scrap/Blister Imports Fall2 (Copper content, kt) 0 500 1,000 1,500 2,000 2,500 2013 2014 2015 2016 2017 2018 2019 2020 2021e 2022e Blister Scrap • Cathode imports could drop in 2021, after tight concentrates and scrap market in 2020 saw record cathode imports • Concentrates imports will continue to rise on smelter demand • Reclassified scrap/blister could now rise off the lows of 2020
  • 101.
    Copper Metal Stocks Rawmaterial shortages increase cathode demand • Exchange stocks have fallen 440kt since March 2020, now equivalent to 3.0 days of global consumption – lowest level in a decade • SHFE stocks have decreased ~310kt since Lunar New Year 2020 • Strong arbitrage drew inventories into China, cathode imports up 36% or 1.2 Mt in 2020 • Over 77% of visible global copper inventories including bonded, are now in China • Prices decreased -25% between January 16, 2020 and March 23, 2020; prices ended the year up 19% and are now up 63% from the March 2020 lows • Expected increase in Chinese stocks with LNY has not occurred in 2020 as lockdown allowed wire/rod mills to continue to operate. 101 Daily Copper Prices (US$/mt) and Stocks1 (kt) 0 200 400 600 800 1,000 1,200 1,400 1,600 1,800 $0 $2,000 $4,000 $6,000 $8,000 $10,000 $12,000 2011 2012 2013 2014 2015 2016 2017 2018 2019 2020 2021 LME Stocks Comex SHFE Bonded Estimate Price
  • 102.
    Long Life andStable Assets in Copper 102 Antamina Highland Valley • Performing well with workforce returning to normal levels • 2021 guidance of 91,000 to 95,000 tonnes copper • Zinc production guidance remaining high at 95,000 to 100,000 tonnes in 2021 • Harder ores impacting throughput • 2021 guidance of 128,000 to 133,000 tonnes copper • RACE21TM application of processing analytics to optimize throughput and recovery Carmen de Andacollo • Production rates maintained • 2021 guidance of 46,000 to 51,000 tonnes copper • Lower copper grades in 2021 • RACE21TM application of processing analytics to optimize throughput and recovery Quebrada Blanca • Performing well with production extended to end of 2021 • 2021 guidance of 10,000 to 11,000 tonnes copper • QB2 first production expected H2 2022 • QB2 will double Teck’s copper production Foundation of stable operations, substantial near-term growth
  • 103.
    Operations Improvement and CashFlow Focus in Copper Productivity & Cost Management • Focus on reliability and maintenance and cross site sharing • RACE21TM and continuous improvement pipeline driving benefits across sites – a key driver of margins • Cost reductions embedded in plans 103 Focused Investment Priorities • Key water, tailings and regulatory projects drive sustaining capital requirements • Near-term higher sustaining spending from tailings facility costs at Antamina • Long-term sustaining capex (2024+) in copper expected at $125 million, excluding QB2 and life extension projects
  • 104.
    Copper Unit Costs 104 OperatingCost1 Breakdown in 2020 Labour 30% Contractors and Consultants 11% Operating Supplies 16% Repairs and Maintenance Parts 16% Energy 20% Other 6% Total 100% Operating Costs 47% Unit Costs1 in 2020 Royalties 2% Depreciation and Amortization 24% Transportation 6% Operating Costs 68%
  • 105.
    Endnotes: Copper Slide 96:Copper Market 1. Source: Shanghai Metal Market. 2. Source: Wood Mackenzie. Slide 97: Global Copper Mine Production Increasing Slowly 1. Source: Data compiled by Teck based on information from Wood Mackenzie and Company Reports (average production first 10 years). 2. Source: Data compiled by Teck based on information from Wood Mackenzie and Teck’s analysis of publicly available quarterly financial reports and other public disclosures of various entities. Slide 98: Copper Disruptions Return to Impact Mines 1. Source: Data compiled by Teck based on information from Wood Mackenzie, CRU, and Metal Bulletin. 2. Source: Data compiled by Teck based on information from Wood Mackenzie and Teck’s analysis of publicly available quarterly financial reports and other public disclosures of various entities. Slide 99: Rapid Growth in Chinese Copper Smelter Capacity 1. Includes mine projects with copper capacity >10 ktpa. Source: BGRIMM. 2. Source: BGRIMM, SMM, Teck. Slide 100: Copper Supply 1. Source: Wood Mackenzie, GTIS, BGRIMM, SMM. 2. Source: Wood Mackenzie, GTIS, BGRIMM, SMM. Slide 101: Copper Metal Stocks 1. Source: LME, Comex, SHFE, SMM. Slide 104: Copper Unit Costs 1. Copper unit costs are reported in US dollars per pound. Non-GAAP financial measures. See “Non-GAAP Financial Measures” slides. 105
  • 106.
  • 107.
    Zinc Mines Return Zincmine supply still at risk, pressure on smelters continues • COVID-19 and poor financials resulted in numerous mine suspensions and closures, eliminating significant production in 2020 • While mines restarted after COVID shutdowns, many SA mines are still slow to return, resulting in tight concentrate market impacting production at some smelters in China • Chinese and ROW manufacturing restarted with consumption driven by infrastructure, construction and automotive • Despite roll-out of vaccines, escalating cases of COVID-19 and the continued economic impact increase concerns for future supply and demand of zinc in 2021 107
  • 108.
    Zinc Market Raw materialsshortages and improving demand support prices • Demand for raw materials and mine disruptions due to COVID-19 kept concentrate demand strong ‒ Mine production in 2020 estimated decline >1Mt, while smelter cuts were only ~300 kt ‒ Ongoing spread of the virus and COVID-19 protocols is expected to impact production in 2021 ‒ Despite return of mine production, concentrate supply remains tight, TCs down -77% from February 2020 peak, currently <$70/dmt ‒ Conc market expected to remain tight in 2021; Gamsberg pit failure likely to further impact supply • Construction, infrastructure, and automobile demand driving zinc demand in China ‒ Galvanized utilization rates fell slightly in December to 91%, well above 78% LT average ‒ China zinc premiums remained above ~US$100 per tonne, for the 4th straight month Zinc Use Tied to the Protection of Steel 60% of Total Demand2 Steel Demand in China Supporting Zinc Price1 25 50 75 100 Jun-17 Dec-17 Jun-18 Dec-18 Jun-19 Dec-19 Jun-20 Operating Rates % Total Smelter Operating Rates Large Zinc Smelters Operating Rates at Galvanizers 108 Zinc Demand 13.1 Mt Zinc End Uses 13.1 Mt Consumer Products 6% Construction 51% Transport 20% Industrial Machinery 7% Infrastructure 16% Galvanizing 52% Oxides & Chemical 7% Brass & Semi Cast 16% Semi- Manufactured 6% Die Cast Alloys 15% Other 4%
  • 109.
    0 1,000 2,000 3,000 4,000 5,000 6,000 7,000 2013 2014 2015 2016 2017 2018 2019 2020 2021 2022 0 1,000 2,000 3,000 4,000 5,000 6,000 7,000 2013 2014 2015 2016 2017 2018 2019 2020 2021 2022 Chinese Mine andSmelter Production Mine production flat while smelter production increases 109 Chinese Refined Production Up 9% Since 20182 (kt Contained) Chinese Mine Production Down 1% Since 20181 (kt Contained) Delayed projects and decreasing ore grades continue to impact Chinese mines while smelter production increases
  • 110.
    3.4 3.6 3.8 4.0 100 350 270 180 300 250 237 392 495 360 200 -630 83 -38 -153 40 -50 85 -800 -600 -400 -200 0 200 400 600 Early-year estimateAdjusted estimate Global Mine Production Remains Under Pressure Ongoing risk to supply growth in 2021 110 Estimated Chinese Zinc Mine Growth Rarely Achieved1 (Kmt Contained) Zinc Ore Grades Falling at Chinese Mines3 (Ore grade, zinc %) -4,000 -3,000 -2,000 -1,000 0 1,000 New Mines China Mines ROW Mines Change Changes in Mine Production Since Q1 20182
  • 111.
    0 200 400 600 800 1,000 1,200 1,400 1,600 Jan-12 Aug-12 Mar-13 Oct-13 May-14 Dec-14 Jul-15 Feb-16 Sep-16 Apr-17 Nov-17 Jun-18 Jan-19 Aug-19 Mar-20 Oct-20 Domestic Commercial StocksBonded Stocks Smelter + Consumer Stocks 503 770 788 627 627 1,213 1,179 1,247 0 200 400 600 800 1,000 1,200 1,400 1,600 2016 2017 2018 2019 2020E 2021E 2022E 2023E Stocks Continue to Decrease While Refined Production Increases in China 111 Additional Zinc Metal Required to Fill the Gap3 (kt) De-stocking Continues Chinese Stocks at Record Lows1,2 (kt) • 2020 stocks down despite lower Q1 consumption due to COVID-19 • Seasonal stock increase did not happen during 2021 Lunar New Year • Additional metal required to meet 2021 demand
  • 112.
    • Following thereturn of Chinese mine production after COVID-19 shutdowns, increasing smelter production kept China reliant on imported concentrate • Chinese mine production was expected to increase in 2020; decreasing ore grades and delayed projects kept production down -2% YoY • Mine production slowly recovering in Bolivia, Peru, and Mexico, after losing >1.0Mt of production in 2020; but Peru ongoing 4 week lockdown and spread of COVID-19 could lead to further cuts • 2021 mine production expected to grow 7.0%, but the Gamsberg pit failure could lead to further cuts Zinc Supply Mine production expected to grow in 2021, but remains at risk due to COVID-19 112 Zinc Mine Production1 (kt contained) 0 2,000 4,000 6,000 8,000 10,000 12,000 14,000 16,000 2017 2018 2019 WM Q4 2019 F 2020 2021 2022 2023 ROW Others China Glencore Dugald River Gamsberg New Century New Mines WM Pre-Covid 2020 Forecast
  • 113.
    Zinc Concentrate TreatmentCharges Treatment Charges1 (USD/dmt) 113 0 50 100 150 200 250 300 350 Spot TC Benchmark TC Spot TCs down -77% vs. Feb 2020 peak
  • 114.
    Zinc Metal Stocks COVID-19related decrease in demand resulting in minor inventory build • Deficits over past 5 years drove down stocks, with total stocks at only 10 days of global consumption compared to a normal 19 days • Despite demand returning, overall refined zinc stocks have increased in 2021 • LME stocks increased while stocks in China fell; Total stocks down ~20% since mid-March 2020 - LME stock build from excess metal accumulated during COVID-19 lockdowns - LME warehouses incentivizing traders to lock up metal on exchange in rent deals - Despite Chinese smelter production increasing, SHFE stocks decreased >80% since China reopened after Q1 shutdowns due to stronger demand 114 Daily Zinc Prices1,2 (US$/mt) and Stocks1,2 (kmt) 0 500 1,000 1,500 2,000 2,500 0 500 1,000 1,500 2,000 2,500 3,000 3,500 4,000 2010 2011 2012 2013 2014 2015 2016 2017 2018 2019 2020 2021 LME Stocks Bonded SHFE Price
  • 115.
    Largest Global NetZinc Mining Companies Teck is the Largest Net Zinc Miner1(kt) Provides significant exposure to a rising zinc price 115 0 50 100 150 200 250 300 350 400 Teck Public Company Private Company
  • 116.
    Integrated Zinc Business 116 RedDog Trail • Operations maintained with travel restrictions and modified schedules • Temporary water-related restrictions removed from mine plan • 2021 guidance of 490,000 to 510,000 tonnes zinc • Lower zinc sales in H1 2021, particularly in Q2 2021 due to lower 2020 production • VIP2 project is helping to offset lower grades • Operations performing well • 2021 guidance of 300,000 to 310,000 tonnes refined zinc • Refined lead and silver production similar to prior years in 2021 but will fluctuate • Focus on margin improvement including RACE21TM implementation Strengthening our zinc business
  • 117.
    Operations Improvement and CashFlow Focus in Zinc Productivity • Focus on asset management and cross site sharing • RACE21TM and continuous improvement pipeline driving benefits across sites – a key driver of margins • Cost reductions embedded in plans 117 Focused Investment Priorities • Key water, tailings and regulatory projects drive sustaining capital requirements • Near term higher sustaining spending from tailings related projects at Red Dog and air quality and asset renewal at Trail • Long-term sustaining capex (2024+) in zinc expected at $150 million, excluding life extension projects
  • 118.
    Red Dog SalesSeasonality • Operates 12 months • Ships ~ 4 months • Shipments to inventory in Canada and Europe; Direct sales to Asia • ~65% of zinc sales in second half of year • ~100% of lead sales in second half of year • Sales seasonality causes net cash unit cost seasonality 118 Zinc Sales 1 (%) Lead Sales1 (%) 21% 16% 31% 32% 0% 10% 20% 30% 40% Q1 Q2 Q3 Q4 0% 1% 66% 33% 0% 20% 40% 60% 80% Q1 Q2 Q3 Q4
  • 119.
    Red Dog NetCash Unit Cost Seasonality Five-Year Average Red Dog Net Cash Unit Costs1 (US$/lb) 119 • Seasonality of Red Dog unit costs largely due to lead sales during the shipping season • Higher net cash unit costs expected in 2021 compared to 2020 due primarily to lower production volumes in 2020, as well as lower contribution from silver by-products - 0.20 0.40 0.60 Q1 Q2 Q3 Q4
  • 120.
    Zinc Unit Costs 120 OperatingCost1 Breakdown in 2020 Labour 35% Contractors and Consultants 10% Operating Supplies 11% Repairs and Maintenance Parts 9% Energy 18% Other 17% Total 100% Operating Costs 47% Unit Costs1 in 2020 Depreciation and Amortization 24% Operating Costs 68% Depreciation and Amortization 13% Operating Costs 38% Transportation 12% Concentrate Purchases 26% Royalties 11%
  • 121.
    Red Dog inBottom Quartile of Zinc Cost Curves Higher zinc prices reduce risk of economic closures Total Cash + Capex Cost Curve 20201 (US¢/lb) 121 0 20 40 60 80 100 120 140 160 180 200 0% 25% 50% 75% 100% 2020 Costs Based on Current Prices Current Spot LME Price RED DOG
  • 122.
    Red Dog ExtensionProject Long Life Asset • Aktigiruq exploration target of 80-150 Mt @ 16-18% Zn + Pb1 • Anarraaq Inferred Resource2: 19.4 Mt @14.4% Zn, 4.2% Pb Quality Project • Premier zinc district • Significant mineralized system • High grade Stable Jurisdiction • Operating history • ~12 km from Red Dog operations 122 Qanaiyaq Aktigiruq Anarraaq Paalaaq Su-Lik Aqqaluk Main Looking Northwest
  • 123.
    Endnotes: Zinc Slide 108:Zinc Market 1. Source: Shanghai Metal Market. 2. Source: Based on information from the International Zinc Study Group Data. Slide 109: Chinese Mine and Smelter Production 1. Source: Data compiled by Teck based on information from BGRIMM, CNIA, Antaike. 2. Source: Data compiled by Teck based on information from BGRIMM, CNIA, Antaike. Slide 110: Global Mine Production Remains Under Pressure 1. Source: Data compiled by Teck based on information from BGRIMM, CNIA, Antaike. Early year estimates from consolidation of several analyst views in the year preceding. 2. Source: Data compiled by Teck based on information from BGRIMM, CNIA, Antaike. 3. Source: Data compiled by Teck based on information from BGRIMM, CNIA, Antaike., NBS. Slide 111: Stocks Continue to Decrease While Refined Production Increases in China 1. Source: Data compiled by Teck Analysis based on information from SHFE, SMM, 2. Source: ”Smelter + consumer stocks” refers to zinc metal held in the plants of smelters and semi producers and those on the road; ”Bonded stocks” refers to zinc stored in bonded zones and will need to complete Customs clearance before entering China; ”Domestic commercial stocks” refers to zinc stored in SHFE warehouses and other domestic commercial warehouses not registered in SHFE. 3. Source: Data compiled by Teck Analysis based on historic numbers from China Customs, and forecasts based on data from BGRIMM, Antaike and Teck’s commercial contacts. Slide 112: Zinc Supply 1. Source: Data compiled by Teck based on information from Wood Mackenzie, BGRIMM, CNIA, Antaike and Teck analysis. Slide 113: Zinc Concentrate Treatment Charges 1. Source: Wood Mackenzie. Slide 114: Zinc Metal Stocks 1. Source: Data compiled by Teck from information from LME, SHFE, SMM. 2. Source: Data compiled by Teck from information from LME, Fastmarkets, Argus, Acuity, company reports. Slide 115: Largest Global Net Zinc Mining Companies 1. Source: Data compiled by Teck from information from Wood Mackenzie – Company smelter production netted against company mine production on an equity basis. Slide 118: Red Dog Sales Seasonality 1. Average sales from 2016 to 2020. Slide 119: Red Dog Net Cash Unit Cost Seasonality 1. Average quarterly net cash unit cost in 2016 to 2020, before royalties. Based on Teck ‘s reported financials. Net cash unit cost is a non-GAAP financial measure. See “Non-GAAP Financial Measures” slides. Slide 120: Zinc Unit Costs 1. Zinc unit costs are reported in US dollars per pound. Non-GAAP financial measures. See “Non-GAAP Financial Measures” slides. Slide 121: Red Dog in Bottom Quartile of Zinc Cost Curves 1. Source: Data compiled by Teck from information from Wood Mackenzie, LME – Based on WM Forecast information and estimates for 2020 based on current short term average prices. Slide 122: Red Dog Extension Project 1. Aktigiruq is an exploration target, not a resource. Refer to press release of September 18, 2017, available on SEDAR. Potential quantity and grade of this exploration target is conceptual in nature. There has been insufficient exploration to define a mineral resource and it is uncertain if further exploration will result in the target being delineated as a mineral resource. 2. Based on Teck’s 2020 Annual Information Form. 123
  • 124.
  • 125.
    Energy Benchmark Pricing CalendarNYMEX WTI Price1 , WTI/WCS Basis Differential at Hardisty2 and WTI/WCS Basis Differential at the US Gulf Coast3 (US$/bbl) 125 (10) - 10 20 30 40 50 60 70 80 (10) 0 10 20 30 40 50 60 70 80 Jan-17 Jun-17 Nov-17 Apr-18 Sep-18 Feb-19 Jul-19 Dec-19 May-20 Oct-20 Mar-21 Calendar NYMEX WTI Price WTI/WCS Basis Differential at Hardisty WTI/WCS Basis Differential at the USGC
  • 126.
    0 50 100 150 200 250 Q1 Q2 Q3Q4 Q1 Q2 Q3 Q4 Q1 Q2 Q3 Q4 2018 2019 2020 Production @ 100% (kbpd) Fort Hills is A Modern Oil Sands Mine 126 Curtailed De-bottleneck potential Best monthly production rate (201 kbpd) • Higher quality partially de-carbonized Paraffinic Froth Treatment (PFT) product; lower greenhouse gas (GHG) emissions • Partners commenced a phased re-start of the second train in Q4 2020, earlier than previously anticipated • Assessing plans to increase production to capacity as business environment continues to improve • Government of Alberta production limits relaxed in Q4 20201 • Focused on operational excellence to reduce operating costs and capital efficiency Start-up Temporarily reduced production due to COVID-19 and low WCS prices Fort Hills is a quality asset with significant upside potential
  • 127.
    127 0 20 40 60 80 Yale’s Environmental PerformanceIndex Of Top 10 Oil Reserve Countries World Oil Producers Ranked By Corruption and Volume1 Canada is a Leader in ESG The world benefits from Fort Hills low carbon intensity product during transition to renewables Canada should be a supplier of choice to reduce global emissions
  • 128.
    Best In ClassLow Carbon Intensity Production Our Fort Hills blend can displace carbon intensive crudes 128 • Emissions intensity of Canadian oil sands has declined by 25% - estimated reduction of 15% to 20% by 2030 • PFT bitumen emissions from mining significantly lower than others • Fort Hills PFT currently the new bar for low emissions • Fort Hills will displace barrels of crude from higher emitters Source: Bloomberg, BMO Capital Markets Total Life Cycle Emissions Intensity (kg CO2e/bbl refined product – gasoline/diesel) Lower carbon intensity than 50% of the US refined barrels of oil
  • 129.
    Continuous Improvement inEmissions Intensity Fort Hills emissions performance has been outstanding to date 129 • Recent analysis by IHS Markit shows 15% improvement in emissions intensity of mined dilbit PFT in 2018 - Includes emissions during Fort Hills ramp-up to full production where emissions are typically higher - Fort Hills total life cycle emissions 1.6% lower than the average crude oil refined in the US • Fort Hills performance in 2019 was 13% better than 2018 despite Alberta Government curtailment Fort Hills emissions are decreasing year-over-year
  • 130.
    Fort Hills GHGEmissions Emissions Boundaries 130 Well to Wheels Upstream (Direct) Emissions Image Source: IHS Markit; edited by Teck. Downstream (Indirect) Emissions
  • 131.
    Fort Hills BlendWidely Accepted In Market A preferred feedstock and supplier of choice We produce a high quality refinery feedstock • Low GHG intensity: <50% of US crude supply • Including in-situ and upgraded synthetic Our sales mix provides diverse market access • Pipeline connected with rail loading as needed • Hardisty and US Gulf Coast core markets 131 8.0 28.5 Hardisty/US Gulf Coast Monthly Sales Hardisty: Term Contracts Teck Blend: 36.5 kbpd Teck’s Expected Commercial Activities In 2021 Bitumen production 28.0 kbpd1 + Diluent acquisition 8.5 kbpd = Bitumen blend sales 36.5 kbpd Teck’s Delivery Location (kbpd) We are well positioned for future opportunities
  • 132.
    Sufficient Pipeline Capacityas of 2022/2023 Differentials to improve on completed export capacity 132 3 4 5 6 2019 2020 2021 2022 2023 2024 2025 Total Available Supply Current Market Access Pipe Optimization Enbridge Line 3 TransMountain TMX Rail Near term: • Rail shipments reduced in 2020 on shut-in production, increasing in 2021 Pipeline development progressing: • Enbridge: 370 kbpd (Q4 2021) • TMX: 600 kbpd (Late Q4 2022) Longer term: • Global heavy refining capacity increase • US, India and China largest heavy importers Western Canada Crude Oil Takeaway Capacity1
  • 133.
    Endnotes: Energy Slide 125:Energy Benchmark Pricing 1. The WTI CMA is an average of the daily settle quoted price for WTI prices for future deliveries for the trading days during a calendar month. Source: CME Group. As at February 22, 2021. 2. WCS at Hardisty: an index value determined during the trading period, which is typically the first 9 to 11 business days of the month prior to the month of delivery and does not include trades done after this trading period or during the month of delivery. Sources: Net Energy and CalRock. As at February 22, 2021. 3. Source: Link, PVM and Platts. A simple average of Link brokerage, PVM and Platts assessments for the month of delivery during the trading period, which is typically the 25th of two months prior to the month of delivery to the 25th of the month prior to the month of delivery. As at February 22, 2021. Slide 126: Fort Hills is a Modern Mine 1. On, October 23, 2020, the Government of Alberta announced that it will not issue monthly production limits effective December 2020 production month. Since December 2020, operators will be able to produce above their previously issued production limits without having to purchase curtailment credits or apply for Special Production Allowances. The curtailment rules have been extended to December 31, 2021, however, the Government of Alberta, will only issue Ministerial Orders to limit production when they feel it is needed. If required, Ministerial Orders will be issued with 30-60 days’ notice to allow time for curtailed producers to respond and plan accordingly. The Fort Hills Partners continue to monitor the business environment and assess plans to maximize cash flow, including the potential to increase production. Slide 127: Canada is a Leader in ESG 1. Source: Transparency International Corruption Perceptions Index 2017 (y-axis). BP Statistical Review 2017 (x-axis). Slide 131: Fort Hills Blend Widely Accepted In Market 1. Bitumen production assumes the mid-point of our 2021 production guidance range. Slide 132: Sufficient Pipeline Capacity as of 2022/2023 1. Source: IHSMarkit, Teck. 133
  • 134.
  • 135.
    Non-GAAP Financial Measures 135 Ourfinancial results are prepared in accordance with International Financial Reporting Standards (IFRS) as issued by the International Accounting Standards Board. This document refers to a number of Non-GAAP Financial Measures which are not measures recognized under IFRS and do not have a standardized meaning prescribed by IFRS or Generally Accepted Accounting Principles (GAAP) in the United States. The Non-GAAP Measures described below do not have standardized meanings under IFRS, may differ from those used by other issuers, and may not be comparable to such measures as reported by others. These measures have been derived from our financial statements and applied on a consistent basis as appropriate. We disclose these measures because we believe they assist readers in understanding the results of our operations and financial position and are meant to provide further information about our financial results to investors. These measures should not be considered in isolation or used in substitute for other measures of performance prepared in accordance with IFRS. We have changed our calculations of adjusted profit attributable to shareholders and adjusted EBITDA to include additional items that we have not previously included in our adjustments and have also changed our debt ratios to compare debt and net debt to adjusted EBITDA rather than EBITDA. These changes were made from January 1, 2020 onwards and comparative figures have been restated to conform to the current period presentation. In addition to items previously adjusted, our adjusted profit attributable to shareholders and adjusted EBITDA now include adjustments for environmental costs, including changes relating to the remeasurement of decommissioning and restoration costs for our closed operations due to changes in discount rates, share-based compensation costs, inventory write-downs and reversals and commodity derivatives. We believe that by including these items, which reflect measurement changes on our balance sheet, in our adjustments, our adjusted profit attributable to shareholders and adjusted EBITDA will reflect the recurring results of our core operating activities. This revised presentation will help us and readers to analyze the rest of our results more clearly and to understand the ongoing cash generating potential of our business. With respect to our debt ratios, we believe that using adjusted EBITDA, will present a more meaningful basis for us and the reader to understand the debt service capacity of our core operating activities. Adjusted profit attributable to shareholders – For adjusted profit, we adjust profit attributable to shareholders as reported to remove the after-tax effect of certain types of transactions that reflect measurement changes on our balance sheet or are not indicative of our normal operating activities. We believe adjusted profit helps us and readers better understand the results of our core operating activities and the ongoing cash generating potential of our business. Adjusted basic earnings per share – Adjusted basic earnings per share is adjusted profit divided by average number of shares outstanding in the period. Adjusted diluted earnings per share – Adjusted diluted earnings per share is adjusted profit divided by average number of fully diluted shares in a period. EBITDA – EBITDA is profit before net finance expense, provision for income taxes, and depreciation and amortization. Adjusted EBITDA – Adjusted EBITDA is EBITDA before the pre-tax effect of the adjustments that we make to adjusted profit attributable to shareholders as described above. The adjustments described above to profit attributable to shareholders and EBITDA highlight items and allow us and readers to analyze the rest of our results more clearly. We believe that disclosing these measures assists readers in understanding the ongoing cash generating potential of our business in order to provide liquidity to fund working capital needs, service outstanding debt, fund future capital expenditures and investment opportunities, and pay dividends. Gross profit before depreciation and amortization – Gross profit before depreciation and amortization is gross profit with the depreciation and amortization expense added back. We believe this measure assists us and readers to assess our ability to generate cash flow from our business units or operations. Gross profit margins before depreciation – Gross profit margins before depreciation are gross profit before depreciation and amortization, divided by revenue for each respective business unit. We believe this measure assists us and readers to compare margins on a percentage basis among our business units. Unit costs – Unit costs for our steelmaking coal operations are total cost of goods sold, divided by tonnes sold in the period, excluding depreciation and amortization charges. We include this information as it is frequently requested by investors and investment analysts who use it to assess our cost structure and margins and compare it to similar information provided by many companies in the industry. Adjusted site cash cost of sales – Adjusted site cash cost of sales for our steelmaking coal operations is defined as the cost of the product as it leaves the mine excluding depreciation and amortization charges, out-bound transportation costs and any one-time collective agreement charges and inventory write-down provisions. Total cash unit costs – Total cash unit costs for our copper and zinc operations includes adjusted cash costs of sales, as described above, plus the smelter and refining charges added back in determining adjusted revenue. This presentation allows a comparison of total cash unit costs, including smelter charges, to the underlying price of copper or zinc in order to assess the margin for the mine on a per unit basis.
  • 136.
    Non-GAAP Financial Measures 136 Netcash unit costs – Net cash unit costs of principal product, after deducting co-product and by-product margins, are also a common industry measure. By deducting the co- and by-product margin per unit of the principal product, the margin for the mine on a per unit basis may be presented in a single metric for comparison to other operations. Readers should be aware that this metric, by excluding certain items and reclassifying cost and revenue items, distorts our actual production costs as determined under IFRS. Adjusted cash cost of sales – Adjusted cash cost of sales for our copper and zinc operations is defined as the cost of the product delivered to the port of shipment, excluding depreciation and amortization charges, any one-time collective agreement charges or inventory write-down provisions and by-product cost of sales. It is common practice in the industry to exclude depreciation and amortization as these costs are non-cash and discounted cash flow valuation models used in the industry substitute expectations of future capital spending for these amounts. Adjusted operating costs – Adjusted operating costs for our energy business unit is defined as the costs of product as it leaves the mine, excluding depreciation and amortization charges, cost of diluent for blending to transport our bitumen by pipeline, cost of non-proprietary product purchased and transportation costs of our product and non-proprietary product and any one-time collective agreement charges or inventory write-down provisions. Cash margins for by-products – Cash margins for by-products is revenue from by- and co-products, less any associated cost of sales of the by and co-product. In addition, for our copper operations, by-product cost of sales also includes cost recoveries associated with our streaming transactions. Adjusted revenue – Adjusted revenue for our copper and zinc operations excludes the revenue from co-products and by-products, but adds back the processing and refining charges to arrive at the value of the underlying payable pounds of copper and zinc. Readers may compare this on a per unit basis with the price of copper and zinc on the LME. Adjusted revenue for our energy business unit excludes the cost of diluent for blending and non-proprietary product revenues, but adds back crown royalties to arrive at the value of the underlying bitumen. Blended bitumen revenue – Blended bitumen revenue is revenue as reported for our energy business unit, but excludes non-proprietary product revenue, and adds back crown royalties that are deducted from revenue. Blended bitumen price realized – Blended bitumen price realized is blended bitumen revenue divided by blended bitumen barrels sold in the period. Operating netback – Operating netbacks per barrel in our energy business unit are calculated as blended bitumen sales revenue net of diluent expenses (also referred to as bitumen price realized), less crown royalties, transportation and operating expenses divided by barrels of bitumen sold. We include this information as investors and investment analysts use it to measure our profitability on a per barrel basis and compare it to similar information provided by other companies in the oil sands industry. The debt-related measures outlined below are disclosed as we believe they provide readers with information that allows them to assess our credit capacity and the ability to meet our short and long-term financial obligations. Net debt – Net debt is total debt, less cash and cash equivalents. Debt to debt-plus-equity ratio – debt to debt-plus-equity ratio takes total debt as reported and divides that by the sum of total debt plus total equity, expressed as a percentage. Net debt to net debt-plus-equity ratio – net debt to net debt-plus-equity ratio is net debt divided by the sum of net debt plus total equity, expressed as a percentage. Debt to Adjusted EBITDA ratio – debt to adjusted EBITDA ratio takes total debt as reported and divides that by adjusted EBITDA for the twelve months ended at the reporting period, expressed as the number of times adjusted EBITDA needs to be earned to repay all of the outstanding debt. Net debt to Adjusted EBITDA ratio – net debt to adjusted EBITDA ratio is the same calculation as the debt to adjusted EBITDA ratio, but using net debt as the numerator. Net debt to capitalization ratio – net debt to capitalization ratio is net debt divided by the sum of total debt plus equity attributable to shareholders. The ratio is a financial covenant under our revolving credit facility.
  • 137.
    Non-GAAP Financial Measures 137 Reconciliationof Profit (Loss) and Adjusted Profit (C$ in millions) Three months ended December 31, 2020 Three months ended December 31, 2019 Year ended December 31, 2020 Year ended December 31, 2019 Profit (loss) attributable to shareholders $ (464) $ (1,835) $ (864) $ (605) Add (deduct) on an after-tax basis: Asset impairments 438 1,943 912 2,052 COVID-19 costs - - 233 - Environmental costs 201 62 210 142 Inventory write-downs 15 34 91 41 Share-based compensation 21 4 34 3 Commodity derivative losses (gains) (15) 1 (46) (13) Debt prepayment option gain - - - (77) Loss on debt redemption or purchase - - 8 166 Taxes and other 52 14 (17) (12) Adjusted profit attributable to shareholders $ 248 $ 223 $ 561 $ 1,697 Adjusted basic earnings per share $ 0.47 $ 0.40 $ 1.05 $ 3.03 Adjusted diluted earnings per share $ 0.46 $ 0.40 $ 1.04 $ 3.00
  • 138.
    Non-GAAP Financial Measures 138 (Pershare amounts) Three months ended December 31, 2020 Three months ended December 31, 2019 Year ended December 31, 2020 Year ended December 31, 2019 Basic earnings (loss) per share $ (0.87) $ (3.33) $ (1.62) $ (1.08) Add (deduct): Asset impairments 0.82 3.52 1.71 3.67 COVID-19 costs - - 0.44 - Environmental costs 0.37 0.11 0.39 0.25 Inventory write-downs 0.03 0.06 0.17 0.07 Share-based compensation 0.04 0.01 0.06 0.01 Commodity derivative losses (gains) (0.03) - (0.09) (0.02) Debt prepayment option gain - - - (0.13) Loss on debt redemption or purchase - - 0.01 0.29 Taxes and other 0.11 0.03 (0.02) (0.03) Adjusted basic earnings per share $ 0.47 $ 0.40 $ 1.05 $ 3.03 Reconciliation of Basic Earnings (Loss) Per Share to Adjusted Basic Earnings (Loss) Per Share
  • 139.
    Non-GAAP Financial Measures 139 (Pershare amounts) Three months ended December 31, 2020 Three months ended December 31, 2019 Year ended December 31, 2020 Year ended December 31, 2019 Diluted earnings (loss) per share $ (0.87) $ (3.33) $ (1.62) $ (1.08) Add (deduct): Asset impairments 0.82 3.49 1.70 3.63 COVID-19 costs - - 0.43 - Environmental costs 0.37 0.11 0.39 0.25 Inventory write-downs (reversals) 0.03 0.06 0.17 0.07 Share-based compensation 0.04 0.01 0.07 0.01 Commodity derivative losses (gains) (0.03) - (0.09) (0.02) Debt prepayment option gain - - - (0.13) Loss on debt redemption or purchase - - 0.01 0.29 Taxes and other 0.10 0.06 (0.02) (0.02) Adjusted diluted earnings per share $ 0.46 $ 0.40 $ 1.04 $ 3.00 Reconciliation of Diluted Earnings (Loss) Per Share to Adjusted Diluted Earnings Per Share
  • 140.
    (C$ in millions) Twelvemonths ended December 31, 2019 Twelve months ended December 31, 2020 Profit (loss) $ (588) $ (944) Finance expense net of finance income 218 268 Provision for (recovery of) income taxes 120 (192) Depreciation and amortization 1,619 1,510 EBITDA $ 1,369 $ 642 Add (deduct): Asset impairments 2,690 1,244 COVID-19 costs - 336 Environmental costs 197 270 Inventory write-downs 60 134 Share-based compensation 4 47 Commodity derivative gains (17) (62) Debt prepayment option gain (105) - Loss on debt redemption or purchase 224 11 Taxes and other 51 (52) Adjusted EBITDA (B) $ 4,473 (A) $ 2,570 Non-GAAP Financial Measures 140 Reconciliation of Net Debt to Adjusted EBITDA Ratio
  • 141.
    (C$ in millions) Twelvemonths ended December 31, 2019 Twelve months ended December 31, 2020 Total debt at period end (D) $ 4,834 (C) $ 6,947 Less: cash and cash equivalents at period end (1,026) (450) Net debt (F) $ 3,808 (E) $ 6,497 Debt to adjusted EBITDA ratio (D/B) 1.1 (C/A) 2.7 Net debt to adjusted EBITDA ratio (F/B) 0.9 (E/A) 2.5 Equity attributable to shareholders of the company (H) 21,304 (G) 20,039 Obligation to Neptune Bulk Terminals (J) - (I) 138 Adjusted net debt to capitalization ratio (F+J)/(D+J+H) 0.15 (E+I)/(C+I+G) 0.24 Non-GAAP Financial Measures We include net debt measures as we believe they provide readers with information that allows them to assess our credit capacity and the ability to meet our short and long-term financial obligations, as well as providing a comparison to our peers. 141 Reconciliation of Net Debt to Adjusted EBITDA Ratio - Continued
  • 142.
    Non-GAAP Financial Measures 142 (C$in millions) Three months ended December 31, 2020 Three months ended December 31, 2019 Year ended December 31, 2020 Year ended December 31, 2019 Profit (loss) $ (473) $ (1,855) $ (944) $ (588) Finance expense net of finance income 44 46 268 218 Provision for (recovery of) income taxes (76) (510) (192) 120 Depreciation and amortization 406 415 1,510 1,619 EBITDA $ (99) $ (1,904) $ 642 $ 1,369 Add (deduct): Asset impairments 597 2,519 1,244 2,690 COVID-19 costs - - 336 - Environmental costs 258 85 270 197 Inventory write-downs 23 51 134 60 Share-based compensation 29 6 47 4 Commodity derivative losses (gains) (20) 2 (62) (17) Debt prepayment option gain - - - (105) Loss on debt redemption or purchase - - 11 224 Taxes and other 51 26 (52) 51 Adjusted EBITDA $ 839 $ 785 $ 2,570 $ 4,473 Reconciliation of EBITDA and Adjusted EBITDA
  • 143.
    Non-GAAP Financial Measures 143 Reconciliationof Gross Profit Before Depreciation and Amortization (C$ in millions) Three months ended December 31, 2020 Three months ended December 31, 2019 Year ended December 31, 2020 Year ended December 31, 2019 Gross profit $ 505 $ 460 $ 1,333 $ 3,340 Depreciation and amortization 406 415 1,510 1,619 Gross profit before depreciation and amortization $ 911 $ 875 $ 2,843 $ 4,959 Reported as: Copper Highland Valley Copper $ 185 $ 117 $ 476 $ 395 Antamina 210 164 566 614 Carmen de Andacollo 63 (14) 170 89 Quebrada Blanca 12 (28) 30 (18) 470 239 1,242 1,080 Zinc Trail Operations 27 (10) 65 - Red Dog 188 210 717 837 Pend Oreille - - - (4) Other 2 (15) 33 (2) 217 185 815 831 Steelmaking coal 248 448 1,009 2,904 Energy (34) 3 (223) 144 Gross profit before depreciation and amortization $ 911 $ 875 $ 2,843 $ 4,959
  • 144.
    Non-GAAP Financial Measures 144 (C$in millions) Three months ended December 31, 2020 Three months ended December 31, 2019 Year ended December 31, 2020 Year ended December 31, 2019 Revenues Copper (A) $ 820 $ 592 $ 2,419 $ 2,469 Zinc (B) 739 745 2,700 2,968 Steelmaking coal (C) 861 1,105 3,375 5,522 Energy (D) 140 213 454 975 Total $ 2,560 $ 2,655 $ 8,948 $ 11,934 Gross profit (loss) before depreciation and amortization Copper (E) $ 470 $ 239 $ 1,242 $ 1,080 Zinc (F) 217 185 815 831 Steelmaking coal (G) 248 448 1,009 2,904 Energy (H) (24) 3 (223) 144 Total $ 911 $ 875 $ 2,843 $ 4,959 Gross profit margins before depreciation Copper (A/E) 57% 40% 51% 44% Zinc (B/F) 29% 25% 30% 28% Steelmaking coal (C/G) 29% 41% 30% 53% Energy (D/H) (17)% 1% (49)% 15% Reconciliation of Gross Profit (Loss) Margins Before Depreciation
  • 145.
    Non-GAAP Financial Measures 1.Average period exchange rates are used to convert to US$ per pound equivalent. We include unit cost information as it is frequently requested by investors and investment analysts who use it to assess our cost structure and margins and compare it to similar information provided by many companies in our industry. 145 (C$ in millions, except where noted) Three months ended December 31, 2020 Three months ended December 31, 2019 Year ended December 31, 2020 Year ended December 31, 2019 Revenue as reported $ 820 $ 592 $ 2,419 $ 2,469 By-product revenue (A) (104) (68) (300) (311) Smelter processing charges (B) 40 38 140 164 Adjusted revenue $ 756 $ 562 $ 2,259 $ 2,322 Cost of sales as reported $ 452 $ 462 $ 1,560 $ 1,852 Less: Depreciation and amortization (102) (109) (383) (463) Inventory (write-downs) provision reversal - (20) - (24) Labour settlement and strike costs - (22) - (35) By-product cost of sales (C) (29) (19) (71) (58) Adjusted cash cost of sales (D) $ 321 $ 292 $ 1,106 $ 1,272 Payable pounds sold (millions) (E) 172.7 158.5 591.7 641.7 Per unit amounts (C$/lb) Adjusted cash cost of sales (D/E) $ 1.86 $ 1.84 $ 1.87 $ 1.98 Smelter processing charges (B/E) 0.23 0.24 0.23 0.26 Total cash unit costs (C$/lb) $ 2.09 $ 2.08 $ 2.10 $ 2.24 Cash margin for by-products (C$/lb) ((A-C)/E) (0.43) (0.31) (0.39) (0.39) Net cash unit costs (C$/lb) $ 1.66 $ 1.77 $ 1.71 $ 1.85 US$ AMOUNTS1 Average exchange rate (C$/US$) $ 1.30 $ 1.32 $ 1.34 $ 1.33 Per unit amounts (US$/lb) Adjusted cash cost of sales $ 1.42 $ 1.40 $ 1.39 $ 1.49 Smelter processing charges 0.18 0.18 0.18 0.19 Total cash unit costs (US$/lb) $ 1.60 $ 1.58 $ 1.57 $ 1.68 Cash margin for by-products (US$/lb) (0.33) (0.24) (0.29) (0.29) Net cash unit costs (US$/lb) $ 1.27 $ 1.34 $ 1.28 $ 1.39 Copper Unit Cost Reconciliation
  • 146.
    Non-GAAP Financial Measures 1.Red Dog and Pend Oreille (closed in July 2019). We include unit cost information as it is frequently requested by investors and investment analysts who use it to assess our cost structure and margins and compare it to similar information provided by many companies in our industry. 146 (C$ in millions, except where noted) Three months ended December 31, 2020 Three months ended December 31, 2019 Year ended December 31, 2020 Year ended December 31, 2019 Revenue as reported $ 739 $ 745 $ 2,700 $ 2,968 Less: Trail Operations revenues as reported (473) (406) (1,761) (1,829) Other revenues as reported (2) (2) (9) (8) Add back: Intra-segment revenues as reported 140 111 464 519 $ 404 $ 448 $ 1,394 $ 1,650 By-product revenue (A) (74) (86) (316) (317) Smelter processing charges (B) 111 99 370 308 Adjusted revenue $ 441 $ 461 $ 1,448 $ 1,641 Cost of sales as reported $ 592 $ 625 $ 2,177 $ 2,367 Less: Trail Operations cost of sales as reported (468) (439) (1,784) (1,915) Other costs of sales as reported - (17) 24 (10) Add back: Intra-segment as reported 140 111 464 519 $ 264 $ 280 $ 881 $ 961 Less: Depreciation and amortization (48) (42) (204) (144) Severance charge - - - (4) Royalty costs (93) (96) (231) (307) By-product cost of sales (C) (17) (24) (78) (75) Adjusted cash cost of sales (D) $ 106 $ 118 $ 368 $ 431 Zinc Unit Cost Reconciliation (Mining Operations)1
  • 147.
    Non-GAAP Financial Measures 147 1.Red Dog and Pend Oreille (closed in July 2019). 2. Average period exchange rates are used to convert to US$ per pound equivalent. We include unit cost information as it is frequently requested by investors and investment analysts who use it to assess our cost structure and margins and compare it to similar information provided by many companies in our industry. Zinc Unit Cost Reconciliation (Mining Operations)1 - Continued (C$ in millions, except where noted) Three months ended December 31, 2020 Three months ended December 31, 2019 Year ended December 31, 2020 Year ended December 31, 2019 Payable pounds sold (millions) (E) 281.7 325.0 1,040.3 1,094.2 Per unit amounts (C$/lb) Adjusted cash cost of sales (D/E) $ 0.38 $ 0.36 $ 0.35 $ 0.40 Smelter processing charges (B/E) 0.39 0.31 0.36 0.28 Total cash unit costs (C$/lb) $ 0.77 $ 0.67 $ 0.71 $ 0.68 Cash margin for by-products (C$/lb) ((A-C)/B) (0.20) (0.19) (0.23) (0.22) Net cash unit costs (C$/lb) $ 0.57 $ 0.48 $ 0.48 $ 0.46 US$ AMOUNTS2 Average exchange rate (C$/US$) $ 1.30 $ 1.32 $ 1.34 $ 1.33 Per unit amounts (US$/lb) Adjusted cash cost of sales $ 0.29 $ 0.27 $ 0.26 $ 0.30 Smelter processing charges 0.30 0.23 0.27 0.21 Total cash unit costs (US$/lb) $ 0.59 $ 0.50 $ 0.53 $ 0.51 Cash margin for by-products (US$/lb) (0.15) (0.14) (0.17) (0.17) Net cash unit costs (US$/lb) $ 0.44 $ 0.36 $ 0.36 $ 0.34
  • 148.
    Non-GAAP Financial Measures 1.Average period exchange rates are used to convert to US$ per tonne equivalent. We include unit cost information as it is frequently requested by investors and investment analysts who use it to assess our cost structure and margins and compare it to similar information provided by many companies in our industry. 148 (C$ in millions, except where noted) Three months ended December 31, 2020 Three months ended December 31, 2019 Year ended December 31, 2020 Year ended December 31, 2019 Cost of sales as reported $ 825 $ 864 $ 3,098 $ 3,410 Less: Transportation costs (245) (249) (905) (976) Depreciation and amortization (212) (207) (732) (792) Inventory (write-down) reversal (14) (28) (59) (32) Labour settlement - - (4) - Adjusted site cash cost of sales $ 354 $ 380 $ 1,398 $ 1,610 Tonnes sold (millions) 6.1 6.3 21.9 25.0 Per unit amounts (C$/t) Adjusted site cash cost of sales $ 58 $ 60 $ 64 $ 65 Transportation costs 40 40 41 39 Inventory write-downs 2 4 3 1 Unit costs (C$/t) $ 100 $ 104 $ 108 $ 105 US$ AMOUNTS1 Average exchange rate (C$/US$) $ 1.30 $ 1.32 $ 1.34 $ 1.33 Per unit amounts (US$/t) Adjusted site cash cost of sales $ 44 $ 46 $ 47 $ 49 Transportation costs 31 30 31 29 Inventory write-downs 2 3 2 1 Unit costs (US$/t) $ 77 $ 79 $ 80 $ 79 Steelmaking Coal Unit Cost Reconciliation
  • 149.
    Non-GAAP Financial Measures 1.Reflects adjustments for costs not directly attributed to the production of Fort Hills bitumen, including transportation for non-proprietary product purchased. 149 (C$ in millions, except where noted) Three months ended December 31, 2020 Three months ended December 31, 2019 Year ended December 31, 2020 Year ended December 31, 2019 Revenue as reported $ 140 $ 213 $ 454 $ 975 Less: Cost of diluent for blending (54) (80) (217) (322) Non-proprietary product revenue (4) (8) (21) (32) Add back: Crown royalties (D) 1 3 4 18 Adjusted revenue (A) $ 83 $ 128 $ 220 $ 639 Cost of sales as reported $ 186 $ 244 $ 780 $ 965 Less: Depreciation and amortization (22) (34) (103) (134) Bitumen and diluent inventory write-downs (8) - (54) - Cash cost of sales $ 156 $ 210 $ 623 $ 831 Less: Cost of diluent for blending (54) (80) (217) (322) Cost of non-proprietary product purchased (4) (6) (17) (31) Transportation costs for non-proprietary product purchased1 (1) - (8) (2) Transportation costs for FRB (C) (25) (29) (103) (118) Adjusted operating costs (E) $ 72 $ 95 $ 278 $ 358 Blended bitumen barrels sold (000’s) 3,056 3,837 11,641 16,023 Less: diluent barrels included in blended bitumen (000’s) (762) (924) (2,949) (3,788) Bitumen barrels sold (000’s) (B) 2,294 2,913 8,692 12,235 Energy Operating Netback, Bitumen & Blended Bitumen Price Realized Reconciliations
  • 150.
    Non-GAAP Financial Measures 1.Bitumen price realized represents the realized petroleum revenue (blended bitumen sales revenue) net of diluent expense, expressed on a per barrel basis. Blended bitumen sales revenue represents revenue from our share of the heavy crude oil blend known as Fort Hills Reduced Carbon Life Cycle Dilbit Blend (FRB), sold at the Hardisty and U.S. Gulf Coast market hubs. FRB is comprised of bitumen produced from Fort Hills blended with purchased diluent. The cost of blending is affected by the amount of diluent required and the cost of purchasing, transporting and blending the diluent. A portion of diluent expense is effectively recovered in the sales price of the blended product. Diluent expense is also affected by Canadian and U.S. benchmark pricing and changes in the value of the Canadian dollar relative to the U.S. dollar. We include unit cost information as it is frequently requested by investors and investment analysts who use it to assess our cost structure and margins and compare it to similar information provided by many companies in our industry. 150 Energy Operating Netback, Bitumen & Blended Bitumen Price Realized Reconciliations - Continued (C$ in millions, except where noted) Three months ended December 31, 2020 Three months ended December 31, 2019 Year ended December 31, 2020 Year ended December 31, 2019 Per barrel amounts (C$) Bitumen price realized1 (A/B) $ 35.92 $ 44.29 $ 25.27 $ 52.21 Crown royalties (D/B) (0.33) (1.27) (0.49) (1.50) Transportation costs for FRB (C/B) (10.69) (9.71) (11.84) (9.62) Adjusted operating costs (E/B) (31.13) (32.55) (31.96) (29.24) Operating netback (C$/barrel) $ (6.23) $ 0.76 $ (19.02) $ 11.85 Revenue as reported $ 140 $ 213 $ 454 $ 975 Less: Non-proprietary product revenue (4) (8) (21) (32) Add back: Crown royalties 1 3 4 18 Blended bitumen revenue (A) $ 137 $ 208 $ 437 $ 961 Blended bitumen barrels sold (000s) (B) 3,056 3,837 11,641 16,023 Blended bitumen price realized1 (C$) (A/B)=D $ 44.77 $ 54.38 $ 37.55 $ 59.97 Average exchange rate (C$ per US$1) (C) 1.30 1.32 1.34 1.33 Blended bitumen price realized (US$/barrel) (D/C) $ 34.36 $ 41.20 $ 27.99 $ 45.20
  • 151.
    Non-GAAP Financial Measures 151 Reconciliationof Free Cash Flow (C$ in millions) 2003 to Q4 2020 Cash Flow from Operations $48,150 Debt interest and finance charges paid (5,820) Capital expenditures, including capitalized stripping costs (28,602) Payments to non-controlling interests (NCI) (649) Free Cash Flow $13,079 Dividends paid $4,487 Payout ratio 34%
  • 152.
    Global Metals &Mining Conference March 1, 2021 Don Lindsay President and Chief Executive Officer