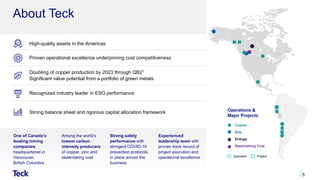
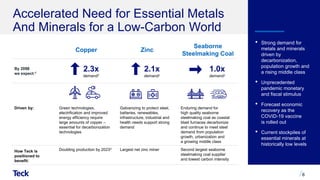
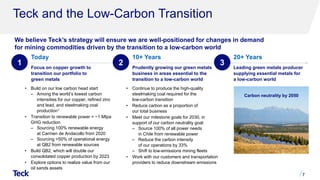
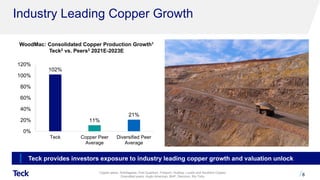
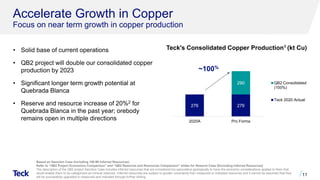
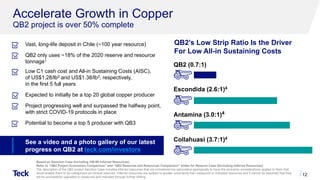
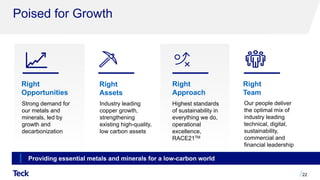
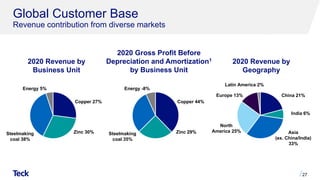
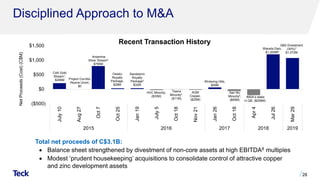
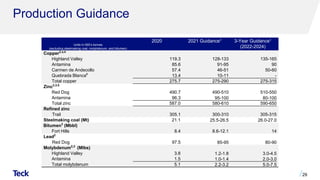
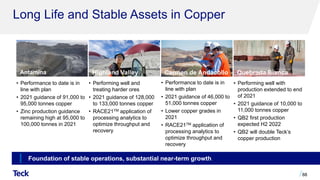
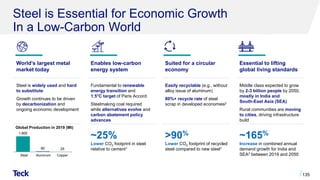
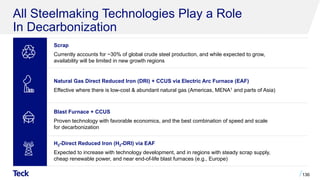
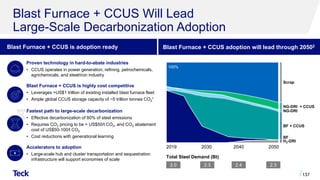
Global Basic Materials
Conference
June 10, 2021
Don Lindsay
President and Chief Executive Officer
Caution Regarding Forward-Looking Statements
2
Both these slides and the accompanying oral presentations contain certain forward-looking statements within the meaning of the United States Private Securities Litigation Reform Act of 1995 and forward-looking information within the meaning of the
Securities Act (Ontario) and comparable legislation in other provinces (collectively referred to herein as forward-looking statements). Forward-looking statements can be identified by the use of words such as “plans”, “expects” or “does not expect”, “is
expected”, “budget”, “scheduled”, “estimates”, “forecasts”, “intends”, “anticipates” or “does not anticipate”, or “believes”, or variation of such words and phrases or state that certain actions, events or results “may”, “could”, “should”, “would”, “might” or
“will” be taken, occur or be achieved. Forward-looking statements involve known and unknown risks, uncertainties and other factors which may cause the actual results, performance or achievements of Teck to be materially different from any future
results, performance or achievements expressed or implied by the forward-looking statements. These statements speak only as of the original date of this presentation.
These forward-looking statements include, but are not limited to, statements concerning: the potential impact of the COVID-19 on our business and operations, including our ability to continue operations at our sites; our ability to manage challenges
presented by COVID-19; our long-term strategy, including but not limited to copper growth strategy; doubling of copper production by 2023 through QB2; all expectations regarding future copper, zinc and steelmaking coal demand and how Teck is
positioned to benefit; Teck’s strategy ensuring we are well-positioned for changes in demand for commodities; expectation that Teck is well positioned for the low-carbon economy; our goal of carbon neutrality and the steps to achieve that goal;
expectations of copper production growth; our green metals growth strategy and the components of that strategy, including but not limited to accelerating growth in copper, and maximizing cash flow from operations to fund copper growth; our climate
action strategy and goals; all projections and forecasts about QB2 and QB3 or based on QB2 or QB3, including but not limited to life of the deposit, copper growth, C1 cash costs and AISC costs, strip ratio, throughput rate and potential to become a
top five global copper producer, reserve and resource estimates, first production expectation, and all other projections included in the “Quebrada Blanca 2” Appendix; statement that Teck is positioned to realize value from a robust pipeline of copper
projects; our ability to develop our copper growth projects; expectation that our copper growth projects will be approved for development; all potential project economics of our copper projects, including but not limited to NPV, C1 cash costs; all
potential production from our copper projects; goals to maximize shareholder returns and maintain a strong balance sheet; goal of maintaining investment grade metrics; goal of balancing growth and capital returns; long-term zinc optionality; all
economic and other projections for our copper growth projects, including but not limited to IRR, payback period, construction period, capex and mine life; impact of commodity price change on annualized EBITDA and annualized profit; liquidity and
availability of borrowings under our credit facilities and the QB2 project finance facility; objectives and components of Teck's capital allocation framework, including a base dividend and potential supplemental shareholder distribution and
maintenance of solid investment grade metrics; sustainability goals; statement we are poised for growth; expectation that QB2 will be a long-life, low-cost operation with significant expansion potential, the impact of QB2 on Teck’s portfolio balance
and QB; QB2 capital estimate and estimated COVID-19 impacts on costs at QB2; timing of first production at QB2; growth options and opportunities in copper, zinc and steelmaking coal; all guidance appearing in this document including but not
limited to the production, sales, cost, unit cost, capital expenditure, cost reduction and other guidance; climate action goals and the expectation that we will achieve these goals; water management goals and expectation that we will achieve those
goals; Elk Valley water treatment projections; benefits and impact of our RACE21TM program; long term annual steelmaking coal production of 26 to 27 million tonnes, and expectations of stable long term strip ratio; benefits of the Neptune facility
upgrade; expectation of strong long-term cash flows in steelmaking coal; projected steelmaking coal sustaining capital; expectation that Teck’s coal is optimally positioned for a decarbonizing future; long-term sustaining capital expenditure projection
in copper; long-term sustaining capital expenditure projection in zinc; expectations for Red Dog extension; Fort Hills debottlenecking potential; expectation of sufficient pipeline capacity for our energy business; the benefits of our innovation strategy
and initiatives described under the “Technology and Innovation” Appendix and elsewhere; mine lives and duration of operations at our various mines and operations; expectations and forecasts for our products, business units and individual
operations and projects; and forecasts for supply and demand for copper, zinc, steelmaking coal and oil.
The forward-looking statements are based on and involve numerous assumptions, risks and uncertainties and actual results may vary materially. These statements are based on assumptions, including, but not limited to, general business and
economic conditions, interest rates, the supply and demand for, deliveries of, and the level and volatility of prices of, zinc, copper, coal, blended bitumen, and other primary metals, minerals and products as well as steel, oil, natural gas, petroleum,
and related products, the timing of the receipt of regulatory and governmental approvals for our development projects and other operations and new technologies, our costs of production and production and productivity levels, as well as those of our
competitors, power prices, continuing availability of water and power resources for our operations, market competition, the accuracy of our reserve estimates (including with respect to size, grade and recoverability) and the geological, operational
and price assumptions on which these are based, conditions in financial markets, the future financial performance of the company, our ability to successfully implement our technology and innovation strategy, the performance of new technologies in
accordance with our expectations, our ability to attract and retain skilled staff, our ability to procure equipment and operating supplies, positive results from the studies on our expansion projects, our coal and other product inventories, our ability to
secure adequate transportation for our products, our ability to obtain permits for our operations and expansions, our ongoing relations with our employees and business partners and joint venturers, our expectations with respect to the carbon
intensity of our operations, assumptions regarding returns of cash to shareholders include assumptions regarding our future business and prospects, other uses for cash or retaining cash. Our sustainability goals are based on a number of additional
assumptions, including regarding the availability and effectiveness of technologies needed to achieve our sustainability goals and priorities; the availability of clean energy sources and zero-emissions alternatives for transportation on reasonable
terms; our ability to implement new source control or mine design strategies and transition to seawater or low-quality water on commercially reasonable terms without impacting production objectives; our ability to successfully implement our
technology and innovation strategy; and the performance of new technologies in accordance with our expectations. In addition, assumptions regarding the Elk Valley Water Quality Plan include assumptions that additional treatment will be effective at
scale, and that the technology and facilities operate as expected. Reserve and resource life estimates assume the mine life of longest lived resource in the relevant commodity is achieved, assumes production at planned rates and in some cases
development of as yet undeveloped projects. Assumptions regarding the benefits of the Neptune Bulk Terminals expansion and other projects include assumptions that the project is constructed and operated in accordance with current expectations.
Capital allocation decisions, and decisions regarding the payment of dividends, are in the discretion of the board of directors. Assumptions regarding QB2 include assumption of completion based on current project assumptions and assumptions
regarding the final feasibility study; assumptions regarding QB3 include assumptions regarding the receipt of permits. Assumptions regarding QB2 include current project assumptions and assumptions regarding the final feasibility study, CLP/USD
exchange rate of 775, as well as there being no unexpected material and negative impact to the various contractors, suppliers and subcontractors for the QB2 project relating to COVID-19 or otherwise that would impair their ability to provide goods
and services as anticipated during the suspension period or ramp-up of construction activities. Assumptions regarding the benefits of the Neptune Bulk Terminals expansion include assumptions that the project is constructed and operated in
Caution Regarding Forward-Looking Statements
3
accordance with current expectations, and upstream infrastructure is in place to support the additional capacity. Statements regarding the availability of our credit facilities and project financing facility are based on assumptions that we will be able to
satisfy the conditions for borrowing at the time of a borrowing request and that the facilities are not otherwise terminated or accelerated due to an event of default. Statements concerning future production costs or volumes are based on numerous
assumptions of management regarding operating matters and on assumptions that demand for products develops as anticipated, that customers and other counterparties perform their contractual obligations, that operating and capital plans will not
be disrupted by issues such as mechanical failure, unavailability of parts and supplies, labour disturbances, interruption in transportation or utilities, adverse weather conditions, and that there are no material unanticipated variations in the cost of
energy or supplies. Statements regarding anticipated steelmaking coal sales volumes and average steelmaking coal prices depend on, among other things, timely arrival of vessels and performance of our steelmaking coal-loading facilities, as well
as the level of spot pricing sales. The foregoing list of assumptions is not exhaustive. Events or circumstances could cause actual results to vary materially. Assumptions are also included in the footnotes to the slides.
Factors that may cause actual results to vary materially include, but are not limited to: extended COVID-19 related suspension of activities and negative impacts on our suppliers, contractors, employees and customers; extended delays in return to
normal operations due to COVID-19 related challenges; changes in commodity and power prices, changes in market demand for our products; changes in interest and currency exchange rates; acts of governments and the outcome of legal
proceedings; inaccurate geological and metallurgical assumptions (including with respect to the size, grade and recoverability of mineral reserves and resources); unanticipated operational difficulties (including failure of plant, equipment or
processes to operate in accordance with specifications or expectations, cost escalation, unavailability of materials and equipment, government action or delays in the receipt of government approvals, industrial disturbances or other job action,
adverse weather conditions and unanticipated events related to health, safety and environmental matters); union labour disputes; political risk; social unrest; failure of customers or counterparties (including logistics suppliers) to perform their
contractual obligations; changes in our credit ratings; unanticipated increases in costs to construct our development projects, difficulty in obtaining or retaining permits; inability to address concerns regarding permits or environmental impact
assessments; current and new technologies relating to our Elk Valley water treatment efforts and other sustainability goals and targets may not perform as anticipated or may not be available, and ongoing monitoring may reveal unexpected
environmental conditions requiring additional remedial measures; and changes or further deterioration in general economic conditions. Development of future reserves and resources is dependent on, among other factors, receipt of permits. Current
and new technologies relating to our Elk Valley water treatment efforts may not perform as anticipated, and ongoing monitoring may reveal unexpected environmental conditions requiring additional remedial measures. QB2 costs, construction
progress and timing of first production is dependent on, among other matters, our continued ability to successfully manage through the impacts of COVID-19. QB2 costs may also be affected by claims and other proceedings that might be brought
against us relating to costs and impacts of the COVID-19 pandemic. Red Dog production may also be impacted by water levels at site.
The forward-looking statements in this presentation and actual results will also be impacted by the effects of COVID-19 and related matters. The overall effects of COVID-19 related matters on our business and operations and projects will depend on
how the ability of our sites to maintain normal operations, and on the duration of impacts on our suppliers, customers and markets for our products, all of which are unknown at this time. Continuing operating activities is highly dependent on the
progression of the pandemic and the success of measures taken to prevent transmission, which will influence when health and government authorities remove various restrictions on business activities.
We assume no obligation to update forward-looking statements except as required under securities laws. Further information concerning risks and uncertainties associated with these forward-looking statements and our business can be found in our
Annual Information Form for the year ended December 31, 2020, filed under our profile on SEDAR (www.sedar.com) and on EDGAR (www.sec.gov) under cover of Form 40-F, as well as subsequent filings, including but not limited to our quarterly
reports.
QB2 Project Disclosure
All economic analysis with respect to the QB2 project based on a development case which includes inferred resources within the life of mine plan, referred to as the Sanction Case, which is the case on which Teck based its development decision for
the QB2 project. Inferred resources are considered too speculative geologically to have the economic considerations applied to them that would enable them to be categorized as mineral reserves. Inferred resources are subject to greater uncertainty
than measured or indicated resources and it cannot be assumed that they will be successfully upgraded to measured and indicated through further drilling. Nonetheless, based on the nature of the mineralization, Teck has used a mine plan including
inferred resources as the development mine plan for the QB2 project.
The economic analysis of the Sanction Case, which includes inferred resources, may be compared to economic analysis regarding a hypothetical mine plan which does not include the use of inferred resources as mill feed, referred to as the Reserve
Case, and which is set out in Appendix slides “QB2 Project Economics Comparison” and “QB2 Reserves and Resources Comparison”.
The scientific and technical information regarding the QB2 project and Teck's other material properties was prepared under the supervision of Rodrigo Marinho, P. Geo, who is an employee of Teck. Mr. Marinho is a qualified person, as defined under
National Instrument 43-101.
Overview
A Focused Strategy
Poised for Growth
Photo: Lowering shell for ball mill #3 at QB2
High-quality assets in the Americas
Proven operational excellence underpinning cost competitiveness
Doubling of copper production by 2023 through QB21
Significant value potential from a portfolio of green metals
Recognized industry leader in ESG performance
Strong balance sheet and rigorous capital allocation framework
5
Strong safety
performance with
stringent COVID-19
prevention protocols
in place across the
business
Among the world’s
lowest carbon
intensity producers
of copper, zinc and
steelmaking coal
Experienced
leadership team with
proven track record of
project execution and
operational excellence
One of Canada’s
leading mining
companies,
headquartered in
Vancouver,
British Columbia
Operations &
Major Projects
Copper
Zinc
Energy
Steelmaking Coal
Operation Project
About Teck
Copper Zinc
Seaborne
Steelmaking Coal
By 2050
we expect:1
2.3x
demand2
2.1x
demand2
1.0x
demand2
Driven by: Green technologies,
electrification and improved
energy efficiency require
large amounts of copper –
essential for decarbonization
technologies
Galvanizing to protect steel,
batteries, renewables,
infrastructure, industrial and
health needs support strong
demand
Enduring demand for
high quality seaborne
steelmaking coal as coastal
blast furnaces decarbonize
and continue to meet steel
demand from population
growth, urbanization and
a growing middle class
How Teck is
positioned to
benefit:
Doubling production by 20233 Largest net zinc miner Second largest seaborne
steelmaking coal supplier
and lowest carbon intensity
6
• Strong demand for
metals and minerals
driven by
decarbonization,
population growth and
a rising middle class
• Unprecedented
pandemic monetary
and fiscal stimulus
• Forecast economic
recovery as the
COVID-19 vaccine
is rolled out
• Current stockpiles of
essential minerals at
historically low levels
Accelerated Need for Essential Metals
And Minerals for a Low-Carbon World
Teck and the Low-Carbon Transition
7
We believe Teck’s strategy will ensure we are well-positioned for changes in demand
for mining commodities driven by the transition to a low-carbon world
• Build on our low carbon head start
‒ Among the world’s lowest carbon
intensities for our copper, refined zinc
and lead, and steelmaking coal
production1
• Transition to renewable power = ~1 Mtpa
GHG reduction
‒ Sourcing 100% renewable energy
at Carmen de Andacollo from 2020
‒ Sourcing >50% of operational energy
at QB2 from renewable sources
• Build QB2, which will double our
consolidated copper production by 2023
• Explore options to realize value from our
oil sands assets
• Continue to produce the high-quality
steelmaking coal required for the
low-carbon transition
• Reduce carbon as a proportion of
our total business
• Meet our milestone goals for 2030, in
support of our carbon neutrality goal:
‒ Source 100% of all power needs
in Chile from renewable power
‒ Reduce the carbon intensity
of our operations by 33%
‒ Shift to low-emissions mining fleets
• Work with our customers and transportation
providers to reduce downstream emissions
Carbon neutrality by 2050
1
Today
Focus on copper growth to
transition our portfolio to
green metals
2
10+ Years
Prudently growing our green metals
business in areas essential to the
transition to a low-carbon world
3
20+ Years
Leading green metals producer
supplying essential metals for
a low-carbon world
Industry Leading Copper Growth
8
WoodMac: Consolidated Copper Production Growth1
Teck2 vs. Peers3 2021E-2023E
Peru
86 kt
Copper peers: Antofagasta, First Quantum, Freeport, Hudbay, Lundin and Southern Copper.
Diversified peers: Anglo American, BHP, Glencore, Rio Tinto.
Teck provides investors exposure to industry leading copper growth and valuation unlock
102%
11%
21%
0%
20%
40%
60%
80%
100%
120%
Teck Copper Peer
Average
Diversified Peer
Average
Overview
A Focused Strategy
Poised for Growth
Photo: QB2 concentrator -
Flotation to concentrate thickeners
Prudent Green Metals Growth Strategy
10
Canada
156 kt
Peru
86 kt
Chile
227 kt
Accelerate
growth in copper
Maximize
cash flows from operations to fund copper growth
Strengthen
existing high-quality assets through RACE21TM
Discipline
in capital allocation
Leadership
in sustainability
276 276
290
2020A Pro Forma
QB2 Consolidated
(100%)
Teck 2020 Actual
Teck's Consolidated Copper Production1 (kt Cu)
Accelerate Growth in Copper
Focus on near term growth in copper production
11
• Solid base of current operations
• QB2 project will double our consolidated copper
production by 2023
• Significant longer term growth potential at
Quebrada Blanca
• Reserve and resource increase of 20%2 for
Quebrada Blanca in the past year; orebody
remains open in multiple directions
~100%
Based on Sanction Case (Including 199 Mt Inferred Resources)
Refer to “QB2 Project Economics Comparison” and “QB2 Reserves and Resources Comparison” slides for Reserve Case (Excluding Inferred Resources)
The description of the QB2 project Sanction Case includes inferred resources that are considered too speculative geologically to have the economic considerations applied to them that
would enable them to be categorized as mineral reserves. Inferred resources are subject to greater uncertainty than measured or indicated resources and it cannot be assumed that they
will be successfully upgraded to measured and indicated through further drilling.
Accelerate Growth in Copper
QB2 project is over 50% complete
12
QB2’s Low Strip Ratio Is the Driver
For Low All-in Sustaining Costs
Vast, long-life deposit in Chile (~100 year resource)
QB2 only uses ~18% of the 2020 reserve and resource
tonnage1
Low C1 cash cost and All-in Sustaining Costs (AISC),
of US$1.28/lb2 and US$1.38/lb3, respectively,
in the first 5 full years
Expected to initially be a top 20 global copper producer
Project progressing well and surpassed the halfway point,
with strict COVID-19 protocols in place
Potential to become a top 5 producer with QB3
QB2 (0.7:1)
Antamina (3.0:1)4
Collahuasi (3.7:1)4
Escondida (2.6:1)4
Based on Sanction Case (Including 199 Mt Inferred Resources)
Refer to “QB2 Project Economics Comparison” and “QB2 Reserves and Resources Comparison” slides for Reserve Case (Excluding Inferred Resources)
The description of the QB2 project Sanction Case includes inferred resources that are considered too speculative geologically to have the economic considerations applied to them that
would enable them to be categorized as mineral reserves. Inferred resources are subject to greater uncertainty than measured or indicated resources and it cannot be assumed that they
will be successfully upgraded to measured and indicated through further drilling.
See a video and a photo gallery of our latest
progress on QB2 at teck.com/investors
Portfolio of Copper Growth Options
Well understood resource base creates multiple options
13
• High quality resources in very attractive mineral
districts
‒ Including ~22 million ounces1 of measured
and indicated gold resources, and
~10 million ounces1 in inferred gold
resources in our copper growth options1
• Prudent investment to further define path to
value, e.g. conversion of resources to reserves
• Leveraging exploration, development and
commercial expertise
• Sustainability and community focus
Teck’s Consolidated Copper Asset
Reserves and Resources (CuEq Mt)2
7
8
16
31
13
15
29
56
18
12
18
48
Copper Operations QB Copper Growth
Options
Total
Proven and Probable Reserves
Measured & Indicated Resources
Inferred Resources
1
Portfolio of Copper Growth Options
Optionality to realize value through production or M&A
Teck is positioned to realize value from a robust pipeline
of copper projects
• Investment in exploration and strategic M&A over the last
20 years have secured various opportunities
• Focus on technical, social, environmental and commercial
de-risking of opportunities
• Leadership, experience and systems in place to fulfill strategy
Seek to maximize shareholder returns and maintain a strong
balance sheet
• Reduce Teck’s equity requirements through partnering, streams,
infrastructure carve-outs and project financing
• Maintain investment grade metrics to support strong liquidity
• Rigorous capital allocation framework to balance growth and
cash returns
14
QB2 Case Study
De-risked at project sanction:
• ~80% engineered and >70% procured
• Key permits approved
Reduced equity requirements:
• US$1.2B transaction payment received
• Partnership further reduced Teck’s funding
• US$2.5B project finance
Right sized balance sheet:
• Repaid US$4B in debt1 and regained investment grade
rating
Return of capital to shareholders:
• C$1.2B of share buy backs and ~C$700M in dividends2
Total Capex Partner Project Finance Teck
QB2
Zafranal
San
Nicolás
QB3
Galore Creek
Mesaba
Schaft
Creek
NuevaUnión
-5.0%
50.0%
105.0%
1.5 3.5 5.5
Portfolio of Copper Growth Options
Value optionality guided by commercial discipline
Bubble size reflects LOM average annual CuEq production1 (shown on a 100% project basis). QB3 shown as incremental to QB2. 15
Medium-term Options
Framing Options Near-term Options Delivering Value
Deliberate risk-adjusted capital allocation process
Investment
Return
Potential
Early Stage Options Investment | Execution
16
3
4
2
1
5
6
7
Portfolio of Copper Growth Options
High quality copper options
Near Term Options
1 Zafranal (Cu-Au), Peru1,2 80% (MMC)
Feasibility Study complete; SEIA submission in Q2 2021
First five years: 133 ktpa CuEq; C1 Costs US$1.18/lb Cu. US$1.2B capex; NPV8 US$1,026M; IRR 23.3%
2 San Nicolás (Cu-Zn-Au-Ag), Mexico1,2 100%
Prefeasibility Study complete Q1 2021
First five years: 125 ktpa CuEq; C1 Costs (US$0.18)/lb Cu. US$0.8B capex; NPV8 US$1,499M; IRR 34.0%
Medium Term Options
3 QB3 (Cu-Ag-Mo), Chile1,3 60% (SMM/SC)
Prefeasibility Study stage; Doubling scenario: Potential 465ktpa CuEq; C1 Costs of US$1.15-1.25/lb Cu
4 Galore Creek (Cu-Au-Ag), BC, Canada1 50% (Newmont)
Prefeasibility Study stage; Potential 230 ktpa CuEq; C1 Costs of US$0.65-0.75/lb Cu
Future Potential
5 NuevaUnión (Cu-Au-Ag-Mo), Chile1 50% (Newmont)
Feasibility Study being optimized; Potential 254 ktpa CuEq; C1 Costs of US$1.00-1.10/lb Cu
6 Mesaba (Cu-Ni, PGM-Co), Minnesota, USA1 100%
Scoping study (incl. baseline studies) complete; Potential 239 ktpa CuEq; C1 Costs US$0.80-0.90/lb Cu
7 Schaft Creek (Cu-Mo-Au-Ag), BC, Canada1 75% (Copper Fox)
Scoping Study being updated; Potential 161 ktpa CuEq; C1 Costs US$0.60-0.70/lb Cu
This slide discloses the results of economic analysis of mineral resources. Mineral resources that are not mineral reserves and do not have demonstrated economic viability.
Projections for QB3, Galore Creek, Mesaba and Schaft Creek include inferred resources that are considered too speculative geologically to have the economic considerations applied
to them that would enable them to be categorized as mineral reserves. Inferred resources are subject to greater uncertainty than measured or indicated resources and it cannot be
assumed that they will be successfully upgraded to measured and indicated through further drilling.
Maximize Cash Flows From Operations
To Fund Copper Growth
17
COPPER
• Foundation of stable operations with three large operating mines
• Among the lowest carbon intensity copper producers
• 10-year average gross profit margin 47%1
ZINC
• Galvanizing extends the life of infrastructure supporting decarbonization
• Red Dog is one of the largest high grade, low-cost zinc mines globally
• Long-term optionality through Teena, Cirque, Aktigiruq, and Anarraaq
• Red Dog 10-year average gross profit margin 53%1
STEELMAKING COAL
• Stable operations with four operating mines in the Elk Valley, BC
• Focus on growing margins, not volume
• Enhanced logistics capability to strengthen long-term, low-cost and reliable supply chain
• 10-year average gross profit margin 49%1
Strengthen Existing High-Quality Assets
Through RACE21TM
18
Transformational
safety impact
Step-change impact to
operational efficiency
Increased productivity
through technology and
innovation
Increased margins
Advanced data analytics
and artificial intelligence to
reduce risk of heavy vehicle
/ light vehicle interactions
Increased copper
throughput by ~7% and
recovery by ~2% at
Highland Valley Copper
Record haul truck
productivities at our coal
sites, up 0.5% versus
same period last year
Improved zinc feed
margins by $5 per tonne
processed at our
Trail Operations
RACE21TM is driving operational improvements and transforming our business
through technology and innovation
Focus
Examples
Discipline in Capital Allocation
A transparent framework, rigorously applied
19
BASE
DIVIDEND
COMMITTED
GROWTH
CAPITAL
CAPITAL
STRUCTURE
SUSTAINING
CAPITAL
(including stripping)
SUPPLEMENTAL
SHAREHOLDER
DISTRIBUTIONS
Plus at Least 30%
Available Cash Flow1
Additional cash
returns to shareholders
Build on C$6.8 billion2 of
dividends and share
buybacks since 2003
Further green metals
growth opportunities
No growth in carbon
assets
1. For this purpose, we define available cash flow as cash flow from operating activities after interest and finance charges, lease payments and distributions to non-controlling interests
less: (i) sustaining capital and capitalized stripping; (ii) committed growth capital; (iii) any cash required to adjust the capital structure to maintain solid investment grade credit metrics;
and (iv) our base $0.20 per share annual dividend. Proceeds from any asset sales may also be used to supplement available cash flow. Any additional cash returns will be made
through share repurchases and/or supplemental dividends depending on market conditions at the relevant time.
2. As at March 31, 2021. FCF is free cash flow. Free cash flow is a non-GAAP financial measure. See “Non-GAAP Financial Measures” slides.
C$4.5 billion2
in dividends
(36% of FCF)
C$2.3 billion2
in buybacks
(18% of FCF)
{
Optimizing how we deploy Available Cash Flow1:
Balancing between returning cash to shareholders and investing in green metals growth
AND
Leadership in Sustainability
20
Top ranked diversified metals
mining company
“A” rating since 2013
Outperforming 4 of 5 largest peers
Top-ranked mining company 2020
World & North American Indices
Gold Class Award 2021
Carbon and water goals that address the climate challenge
• Paris-aligned commitment to be carbon neutral by 2050;
reducing carbon intensity by 33% by 2030
• Transitioning to sea or sustainable water sources in all water-scarce regions by 2040
• Lowest GHG intensity miner1 (tCO2e/t CuEq, 2017)
Employer of choice, neighbor of choice
• Enhancing critical control verification to drive further improvements in safety
• Strong relationships with our communities and Indigenous Peoples
Sustainable governance
• Sustainability oversight & direction by dedicated Board and management committees
• Health & safety and sustainability performance linked to compensation program
1. Source: Barclays Research, Teck.
Overview
A Focused Strategy
Poised for Growth
Photo: New double rail car dumper at Neptune
Industry leading
copper growth,
strengthening
existing high-quality,
low carbon assets
Right
Approach
Highest standards
of sustainability in
everything we do,
operational
excellence,
RACE21TM
Our people deliver
the optimal mix of
industry leading
technical, digital,
sustainability,
commercial and
financial leadership
Right
Opportunities
Strong demand for
our metals and
minerals, led by
growth and
decarbonization
Right
Assets
Poised for Growth
22
Providing essential metals and minerals for a low-carbon world
Right
Team
Appendix
Endnotes
Slide 5: About Teck
1. On a consolidated basis.
Slide 6: Accelerated Need for Essential Metals and Minerals for a Low-Carbon World
1. Modelled forecast under International Energy Agency (IEA) Rapid Transition Sustainable Development Scenario (SDS) for 1.5ºC (1.5oC).
2. Source: McKinsey.
3. On a consolidated basis.
Slide 7: Teck and the Low-Carbon Transition
1. Barclays Research; Teck. 2017.
Slide 8: Industry Leading Copper Growth
1. Source: Wood Mackenzie base case (attributable) copper production dataset. Consolidated production estimates were derived based on accounting standards for consolidation for Teck and its peers.
2. Teck growth estimate uses 2020 actual production and Wood Mackenzie data for 2023.
3. Copper peers: Antofagasta, First Quantum, Freeport, Hudbay, Lundin, Southern Copper. Diversified peers: Anglo American, BHP, Glencore, Rio Tinto. Peer production metrics for 2020 and 2023 are from Wood Mackenzie. Peer production
metrics for 2020 and 2023 are from Wood Mackenzie. Peer averages are the simple averages.
Slide 11: Accelerate Growth in Copper - Focus on near-term growth in copper production
1. We include 100% of production from our Quebrada Blanca and Carmen de Andacollo mines in our production and sales volumes, even though we do not own 100% of these operations, because we fully consolidate their results in our financial
statements. We include 22.5% of production from Antamina, representing our proportionate ownership interest in the operation. QB2 is on a consolidated basis and is based on the QB2 Sanction Case first five full years of copper production.
2. Contained metal. Based on Teck’s 2020 Annual Information Form.
Slide 12: Accelerate Growth in Copper - QB2 project is over 50% complete
1. Resources figures are based on Teck’s 2020 Annual Information Form. Resources are reported separately from, and do not include that portion of resources classified as reserves. See “QB2 Reserves and Resources Comparison” slide for
further details.
2. C1 cash costs (also known as net cash unit costs) are presented after by-product credits assuming US$10.00/lb molybdenum and US$18.00/oz silver. C1 cash costs for QB2 include stripping costs during operations. See “QB2 Reserves and
Resources Comparison” slide for further details. Net cash unit costs and C1 cash costs are non-GAAP financial measures. See “Non-GAAP Financial Measures” slides.
3. All-in sustaining costs (AISC) are net cash unit costs (also known as C1 cash costs) plus sustaining capital expenditures. Net cash unit costs are calculated after cash margin by-product credits assuming US$10.00/lb molybdenum and
US$18.00/oz silver. Net cash unit costs for QB2 include stripping costs during operations. See “QB2 Reserves and Resources Comparison” slide for further details. AISC, net cash unit cost and cash margins for by-products are non-GAAP
financial measures. See “Non-GAAP Financial Measures” slides.
4. Source: Wood Mackenzie. Average 2021-2040.
Slide 13: Portfolio of Copper Growth Options - Well understood resource base creates multiple options
1. Contained equivalent copper metal at 100% basis for all projects. Copper growth assets are: Zafranal, San Nicolás, NuevaUnión, Mesaba, Schaft Creek, Galore Creek. See Teck’s 2020 AIF for further information, including the grade and
quantity, regarding the gold reserves and resources for these projects and the grade of the other metals used to determine the copper equivalent.
2. Contained equivalent copper metal at 100% basis for all projects. CuEq calculated with price assumptions: US$3.50/lb Cu; US$1.15/lb Zn; US$6.90/lb Ni; US$21/lb Co; US$10/lb Mo; US$1,400/oz Au; US$18/oz Ag; US$1,300/oz Pd;
US$1,200/oz Pt.
Slide 14: Portfolio of Copper Growth Options - Optionality to realize value through production or M&A
1. Total debt repayment between Q4 2015 and Q3 2019.
2. Share buybacks and dividends since Q4 2017 (one year prior to project sanction).
Slide 15: Portfolio of Copper Growth Options - Value optionality guided by commercial discipline
1. CuEq calculated with price assumptions: US$3.50/lb Cu; US$1.15/lb Zn; US$6.90/lb Ni; US$21/lb Co; US$10/lb Mo; US$1,400/oz Au; US$18/oz Ag; US$1,300/oz Pd; $1,200/oz Pt. Averages exclude first and last partial years of production.
24
Endnotes
Slide 16: Portfolio of Copper Growth Options - High quality copper options
1. Financials and CuEq calculated with price assumptions: US$3.50/lb Cu; US$1.15/lb Zn; US$6.90/lb Ni; US$21/lb Co; US$10/lb Mo; US$1,400/oz Au; US$18/oz Ag; US$1,300/oz Pd; US$1,200/oz Pt. C1 cash cost are shown net of by-product
credits. All averages exclude first and last partial years of production.
2. Financial summary based on At-Sanction Economic Assessment. Go-forward costs of Prefeasibility, Detailed Engineering, Permitting and Project Set-up costs not included.
3. Various paths to expansion including 50% increase, doubling and tripling of throughput.
Slide 17: Maximize Cash Flows from Operations to Fund Copper Growth
1. Gross profit margins before depreciation from January 1, 2011 to December 31, 2020. Gross profit margins before depreciation are a non-GAAP financial measure. See “Non-GAAP Financial Measures” slides.
25
Overview
Global Customer Base
Revenue contribution from diverse markets
27
2020 Revenue by
Business Unit
Copper 27%
Zinc 30%
Steelmaking
coal 38%
Energy 5%
2020 Gross Profit Before
Depreciation and Amortization1
by Business Unit
Copper 44%
Zinc 29%
Steelmaking
coal 35%
Energy -8%
2020 Revenue by
Geography
India 6%
China 21%
Asia
(ex. China/India)
33%
North
America 25%
Latin America 2%
Europe 13%
Disciplined Approach to M&A
28
CdA Gold
Stream1,
$206M Project Corridor
/Nueva Union,
$0
Antamina
Silver Stream2
$795M
Osisko
Royalty
Package,
$28M
Sandstorm
Royalty
Package3
$32M
HVC Minority,
($33M)
Teena
Minority4,
($11M)
AQM
Copper,
($25M)
Wintering Hills,
$59M
San Nic
Minority5,
($65M)
IMSA’s stake
in QB, ($208M)
Waneta Dam,
$1,200M6
QB2 Divestment
(30%)7
$1,072M
($500)
$0
$500
$1,000
$1,500
July
10
Aug
27
Oct
7
Oct
25
Jan
19
July
5
Oct
18
Nov
21
Jan
26
Oct
18
Apr
4
Jul
26
Mar
29
2015 2016 2017 2018 2019
Total net proceeds of C$3.1B:
• Balance sheet strengthened by divestment of non-core assets at high EBITDA8 multiples
• Modest ‘prudent housekeeping’ acquisitions to consolidate control of attractive copper
and zinc development assets
Recent Transaction History
Net
Proceeds
(Cost)
(C$M)
Production Guidance
29
Units in 000’s tonnes
(excluding steelmaking coal, molybdenum, and bitumen)
2020 2021 Guidance1 3-Year Guidance1
(2022-2024)
Copper2,3,4
Highland Valley 119.3 128-133 135-165
Antamina 85.6 91-95 90
Carmen de Andecollo 57.4 46-51 50-60
Quebrada Blanca6
13.4 10-11 -
Total copper 275.7 275-290 275-315
Zinc2,3,5
Red Dog 490.7 490-510 510-550
Antamina 96.3 95-100 80-100
Total zinc 587.0 580-610 590-650
Refined zinc
Trail 305.1 300-310 305-315
Steelmaking coal (Mt) 21.1 25.5-26.5 26.0-27.0
Bitumen3
(Mbbl)
Fort Hills 8.4 8.6-12.1 14
Lead2
Red Dog 97.5 85-95 80-90
Molybdenum2,3
(Mlbs)
Highland Valley 3.8 1.2-1.8 3.0-4.5
Antamina 1.5 1.0-1.4 2.0-3.0
Total molybdenum 5.1 2.2-3.2 5.0-7.5
Sales and Unit Cost Guidance
30
Unit Costs 2020 2021 Guidance1
Copper3
Total cash unit costs7
(US$/lb) $1.57 $1.65-1.75
Net cash unit costs4,7
(US$/lb) 1.28 1.30-1.40
Zinc5
Total cash unit costs7
(US$/lb) 0.53 $0.54-0.59
Net cash unit costs4,7
(US$/lb) 0.36 0.40-0.45
Steelmaking coal6
Adjusted site cash cost of sales7
$64 $59-64
Transportation costs 41 36-39
Inventory write-down 3 -
Unit costs7
(C$/tonne) $108 $95-103
Bitumen
Adjusted operating costs7
(C$/barrel) C$31.96 C$28-32
Sales Q1 2020 Q2 2022 Guidance1
Zinc2
Red Dog (kt) 104 35-45
Steelmaking coal (Mt) 6.2 6.0-6.4
Capital Expenditures Guidance
31
(Teck’s share in CAD$ millions)
2020 2021
Guidance1
Sustaining
Copper $ 161 $ 160
Zinc 188 155
Steelmaking coal2 571 430
Energy 91 85
Corporate 12 -
Total sustaining $ 1,023 $ 830
Growth3
Copper4 $ 41 $ 125
Zinc 7 25
Steelmaking coal 411 390
Corporate 4 5
$ 463 $ 545
Total
Copper $ 202 $ 285
Zinc 195 180
Steelmaking coal 982 820
Energy 91 85
Corporate 16 5
$ 1,486 $ 1,375
(Teck’s share in CAD$ millions)
2020 2021
Guidance1
QB2 capital expenditures $ 1,643 $ 2,500
Total before SMM/SC contributions 3,129 3,875
Estimated SMM/SC contributions (660) (440)
Estimated QB2 project financing
draw to capex (983) (1,425)
Total, net of partner contributions
and project financing $ 1,486 $ 2,010
QB2
(Teck’s share in CAD$ millions)
2020 2021
Guidance1
Capitalized Stripping
Copper $ 145 $ 205
Zinc 51 70
Steelmaking coal 303 295
$ 499 $ 570
Capitalized Stripping
Sustaining and Growth Capital
Commodity Price Leverage1
32
2021 Mid-Range
Production
Estimates2,5
Change Estimated Effect
on Annualized
Profit3 ($M)
Estimated Effect
on Annualized
EBITDA3 ($M)
US$ exchange C$0.01 $45 $70
Copper (kt) 282.5 US$0.01/lb $5 $8
Zinc4 (kt) 902.5 US$0.01/lb $9 $12
Steelmaking coal (Mt) 26.0 US$1/tonne $19 $30
WCS5 (Mbbl) 10.4 US$1/bbl $9 $13
WTI6 US$1/bbl $6 $8
Tax-Efficient Earnings in Canada and Chile
33
Canada: ~C$4.5 billion in available tax pools at December 31, 2020
• Includes:
‒ $3.8 billion in Canadian federal net operating loss carryforwards
‒ $0.3 billion in Canadian Development Expenses (30% declining balance p.a.)
‒ $0.4 billion in allowable capital loss carryforwards
• Applies to cash income taxes in Canada
• Does not apply to:
‒ Resource taxes in Canada
‒ Cash taxes in foreign jurisdictions
Chile: ~C$800 million in available tax pools at December 31, 2020
• Chilean net operating loss carryforwards
• Applies to cash income taxes for QB2
Share Structure & Principal Shareholders
34
Shares Held Percent Voting Rights
Class A Shareholdings
Temagami Mining Company Limited 4,300,000 55.4%
SMM Resources Inc (Sumitomo) 1,469,000 18.9%
Other 1,996,503 25.7%
7,765,503 100.0%
Class B Shareholdings
Temagami Mining Company Limited 725,000 0.1%
SMM Resources Inc (Sumitomo) 295,800 0.1%
China Investment Corporation (Fullbloom) 59,304,474 11.3%
Other 463,056,146 88.5%
523,381,420 100.0%
Total Shareholdings
Temagami Mining Company Limited 5,025,000 0.9% 33.1%
SMM Resources Inc (Sumitomo) 1,764,800 0.3% 11.3%
China Investment Corporation (Fullbloom) 59,304,474 11.2% 4.6%
Other 465,052,649 87.6% 51.0%
531,146,923 100.0% 100.0%
Teck Resources Limited at December 31, 2020
Collective Agreements
Operation Expiry Dates
Elkview October 31, 2020
Fording River April 30, 2021
Antamina July 31, 2021
Highland Valley Copper September 30, 2021
Trail Operations May 31, 2022
Cardinal River June 30, 2022
Quebrada Blanca
January 31, 2022
March 31, 2022
November 20, 2022
Carmen de Andacollo
September 30, 2022
December 31, 2022
Line Creek May 31, 2024
35
Endnotes: Overview
Slide 27: Global Customer Base
1. Gross profit before depreciation and amortization is a non-GAAP financial measure. See “Non-GAAP Financial Measures” slides.
Slide 28: Disciplined Approach to M&A
1. Carmen de Andacollo gold stream transaction occurred in USD at US$162 million.
2. Antamina silver stream transaction occurred in USD at US$610 million.
3. Sandstorm royalty transaction occurred in USD at US$22 million.
4. Teena transaction occurred in AUD at A$10.6 million.
5. San Nicolàs transaction occurred in USD at US$50 million.
6. Waneta Dam transaction closed July 26, 2018 for C$1.2 billion.
7. QB2 Partnership (sale of 30% interest of project to Sumitomo; SMM and SC) for total consideration of US$1.2 billion, including US$800 million earn-in and US$400 million matching contribution; converted at FX of 1.34 on March 29, 2019.
8. EBITDA is a non-GAAP financial measure. See “Non-GAAP Financial Measures” slides.
Slide 29: Production Guidance
1. As at April 27, 2021. See Teck’s Q1 2021 press release for further details.
2. Metal contained in concentrate.
3. We include 100% of production and sales from our Quebrada Blanca and Carmen de Andacollo mines in our production and sales volumes, even though we do not own 100% of these operations, because we fully consolidate their results in our
financial statements. We include 22.5% and 21.3% of production and sales from Antamina and Fort Hills, respectively, representing our proportionate ownership interest in these operations.
4. Copper production includes cathode production at Quebrada Blanca and Carmen de Andacollo.
5. Total zinc includes co-product zinc production from our 22.5% proportionate interest in Antamina.
6. Three-year guidance 2022-2024 excludes production from QB2.
Slide 30: Sales and Unit Cost Guidance
1. As at April 27, 2021. See Teck’s Q1 2021 press release for further details.
2. Metal contained in concentrate.
3. Copper unit costs are reported in U.S. dollars per payable pound of metal contained in concentrate. Copper net cash unit costs include adjusted cash cost of sales and smelter processing charges, less cash margins for by-products including
co-products. Guidance for 2021 assumes a zinc price of US$1.22 per pound, a molybdenum price of US$8.50 per pound, a silver price of US$20 per ounce, a gold price of US$2,000 per ounce and a Canadian/U.S. dollar exchange rate of
$1.30.
4. After co-product and by-product margins.
5. Zinc unit costs are reported in U.S. dollars per payable pound of metal contained in concentrate. Zinc net cash unit costs are mine costs including adjusted cash cost of sales and smelter processing charges, less cash margins for by-products.
Guidance for 2021 assumes a lead price of US$0.85 per pound, a silver price of US$20 per ounce and a Canadian/U.S. dollar exchange rate of $1.30. By-products include both by-products and co-products.
6. Steelmaking coal unit costs are reported in Canadian dollars per tonne.
7. Non-GAAP financial measure. See “Non-GAAP Financial Measures” slides.
36
Endnotes: Overview
Slide 31: Capital Expenditures Guidance
1. As at April 27, 2021. See Teck’s Q1 2021 press release for further details.
2. Steelmaking coal sustaining capital guidance for 2021 includes $255 million of water treatment capital. 2020 includes $267 million of water treatment capital.
3. Growth expenditures include RACE21TM capital expenditures for 2021 of $120 million, of which $80 million relates to steelmaking coal, $30 million relates to copper, $5 million relates to zinc and $5 million relates to corporate projects.
4. Copper growth guidance for 2021 includes studies for HVC 2040, Antamina, QB3, Zafranal, San Nicolás and Galore Creek.
Slide 32: Commodity Price Leverage
1. As at April 27, 2021. The sensitivity of our annual profit attributable to shareholders and EBITDA to changes in the Canadian/U.S. dollar exchange rate and commodity prices, before pricing adjustments, based on our current balance sheet, our
2021 mid-range production estimates, current commodity prices and a Canadian/U.S. dollar exchange rate of $1.30. See Teck’s Q1 2021 press release for further details.
2. All production estimates are subject to change based on market and operating conditions.
3. The effect on our profit attributable to shareholders and on EBITDA of commodity price and exchange rate movements will vary from quarter to quarter depending on sales volumes. Our estimate of the sensitivity of profit and EBITDA to changes
in the U.S. dollar exchange rate is sensitive to commodity price assumptions.
4. Zinc includes 305,000 tonnes of refined zinc and 597,500 tonnes of zinc contained in concentrate.
5. Bitumen volumes from our energy business unit.
6. Our WTI oil price sensitivity takes into account our interest in Fort Hills for respective change in revenue, partially offset by the effect of the change in diluent purchase costs as well as the effect on the change in operating costs across our
business units, as our operations use a significant amount of diesel fuel.
37
Safety and
Sustainability
Leadership
Sustainability Reporting & Rankings
39
• Top-ranked mining company
World & North American Indices
• Gold Class Award 2021
• “A” rating since 2013
• Outperforming 4 of 5 largest peers
• Top ranked diversified metals mining
company
• Top ranked North American
company
• #1 in the mining subsector
• Ranked among the top 10% of
Metals & Mining companies
Our Reporting Frameworks
GRI Standards
Helps businesses, government and
stakeholders communicate and
understand impact of business on
sustainability issues
SASB Standards
Helps businesses identify, manage
and report on sustainability topics of
greatest interest to investors
Task Force on Climate Related
Financial Disclosures (TCFD)
Helps businesses quantify and
communicate climate change risks
and opportunities
ESG Rankings
Focus on Sustainability Leadership
Ambitious sustainability goals in eight strategic themes
40
Climate Change Responsible Production
Water Tailings Management Biodiversity and
Reclamation
Health and Safety Our People
Communities and
Indigenous Peoples
Sustainability Leadership
Aligned with leading external standards and practices
41
See the full list on our Memberships and Partnerships page:
https://www.teck.com/responsibility/approach-to-responsibility/policies-and-commitments/memberships-&-partnerships/
Health and Safety
Our safest year on record in 2020
• Safety performance in 2020
- 32% reduction in High-Potential
Incident Frequency
- 23% decrease in Lost-Time
Disabling Injury Frequency
42
Teck Operated Incident Frequency
(per 200,000 hours worked)
0.00
0.10
0.20
0.30
0.40
0.50
0.60
0.70
2016 2017 2018 2019 2020
High-Potential Incident Frequency
Serious High-Potential Incident Frequency
Potentially Fatal Occurrence Frequency
High-Potential Incident Frequency rate
reduced by two-thirds over past five years
Climate Action
Positioning for a low-carbon economy
Well positioned for a
low-carbon economy
Among lowest GHG
intensity miners globally on
a copper-equivalent basis
GHG intensity for steelmaking
coal and copper production
among lowest in industry
Carbon pricing already built
into majority of business
Scope 1+2 emissions per copper equivalent ranking1
(tCO2e/t CuEq, 2017)
43
1. Source: Barclays Research, Teck.
Climate Action
Key activities for short-term goals
44
Investing in lower-carbon
means of transportation
such as electric haul trucks,
conveyors and other
approaches
Reduce the carbon
intensity of our
operations by
33% by
2030
Electric bus pilot project represents the
first use of electric passenger buses for
employee transport in the Canadian
mining industry
Accelerate the adoption of
zero-emissions alternatives
for transportation by
displacing the
equivalent of
internal combustion engine
(ICE) vehicles by 2025
1,000
Procure of
our electricity demands
in Chile from clean
energy by 2025 and
In 2020 two power purchase
agreements announced:
- Over 50% of QB2 operating
power requirement from
renewables
- 100% renewable power at
Carmen de Andacollo
100% by 2030
50%
Climate Action
Path to carbon neutrality
Mitigation
Hierarchy
Apply
Decarbonization
Framework
Prioritize Opportunities and Deliver Cost Competitive Reductions
Avoid
Eliminate
Minimize
Offset
Emissions
sources
Power
supply
Mobile
equipment
Stationary
combustion
and process
Fugitive
methane
emissions
Renewable
energy
Electrification
and alternative
material handling
Select abatement options
Electrification
and low
carbon fuels
Methane
recovery and
abatement
Time
2020-2030:
Target readily
available, cost
competitive
technologies in
these areas
45
Implement innovative water management
and water treatment solutions to protect
water quality downstream of all our
operations.
Transition to seawater or low-quality water
sources for all operations in water-scarce
regions by 2040.
46
Water Management
Long term strategic priorities and goals
Water Quality in the Elk Valley
Advancing innovative technologies
47
Saturated Rock Fill Nitrate Reduction
Elk Valley Water Quality Plan developed with government, Indigenous Peoples
and communities to address water quality challenges
Elk Valley Water Treatment
Clear path forward for improving water quality
48
Millions
of
Litres
per
Day
Tailings Management
Our approach
• Full implementation of the Global Industry
Standard on Tailings Management
underway with full conformance by 2023
• Management and emergency response
aligned with Towards Sustainable Mining
Protocols
• Enhanced transparency & disclosure
‒ Facilities inventory posted www.teck.com
‒ Detailed response to the tailings facility
enquiry from the Church of England
Pensions Board and Swedish Council on
Ethics for the AP Funds
Teck has comprehensive systems and
procedures in place based on
6 levels of protection:
Surveillance
Technology
1 Internal
Inspections
2 Annual Dam
Safety
Inspections
3
Internal
Governance
Reviews
4 Detailed
Third-Party
Reviews
5 Independent
Tailings
Review Boards
6
49
• Agreements in place at all mining
operations within or adjacent to Indigenous
Peoples’ territories
• $192 million to Indigenous businesses in
2020 through procurement
• 72% of total local employment in 2020
• $19 million in community investment in 2020
• Zero significant incidents that were human
rights related in 2020
• Released updated Human Rights Policy in
April 2020, first established in 2012
Relationships with Communities and Indigenous
Peoples, Respecting Human Rights
50
Related SASB1 Metric: EM-MM-210a.3 | Link to Data
Related SASB1 Metric: EM-MM-210b.1 | Link to Data
Inclusion and Diversity
• Inclusion and Diversity: committed to improve
representation of under-represented groups in
our workforce: women, Indigenous, Asian, Black,
and all people of colour (BIPOC), persons with
disabilities, and members of the LGBTQ+
community
• Gender Diversity: 20% of workforce are women;
25% of Board of Directors, including the Chair;
29% of new hires
• Workplace Flexibility: family-friendly policies
and programs in place, expanding remote
working policy
• Employee engagement and feedback:
24-hour hotline, site-based inclusion and diversity
chairs, leadership development programs
51
Range of projects in place to promote
inclusion and diversity, including STEM
leadership courses at Trail Operations
• Compensation program is linked to
sustainability and health and safety
performance through individual,
department and company-wide objectives.
• Objectives related to climate change,
communities and Indigenous Peoples,
tailings and water management and others
can affect bonuses by at least 10%–20%.
• Incentive compensation of the CEO and
senior officers includes sustainability
performance indicators.
52
Sustainability Performance
and Compensation
Questions and Further Information
ESG resources for investors
Please see our Disclosure Portal and Sustainability Information for Investors 53
• Sustainability reporting for 20 years in
Core accordance with the Global
Reporting Initiative (GRI) Standards and
G4 Mining and Metals Sector Disclosures
• Report is aligned with Sustainability
Accounting Standards Board (SASB)
• Task Force for Climate-Related
Financial Disclosure (TCFD) aligned
report “Portfolio Resilience in the Face of
Climate Change” published in 2019
• Detailed COVID-19 Response page
QB2 Project
Photo: Concentrator - Aerial view of grinding lines
with shell for ball mill #4 being lowered into place
 Vast, long life deposit
 Very low strip ratio
 Low all in sustaining costs (AISC)1
 Potential to be a top 20 producer
 High grade, clean concentrates
 Significant brownfield development
 Community agreements in place and strong local relationships
 Project has surpassed the halfway point
 Expansion potential (QB3) with potential to be a top 5 producer
Highlights
Chile
Peru
Bolivia
Tarapacá
Region
Arica y
Parinacota
Region
Antofagasta
Region
Arica
Iquique
QB2
Teck, SMM, SC, ENAMI
Collahuasi
Anglo American,
Glencore, Mitsui
El Abra
Freeport-McMoRan,
Codelco
Radomiro
Tomic
Codelco Chuquicamata
Codelco
Ministro
Hales
Codelco
Cerro
Colorado
BHP
Spence
BHP
Centinela
Antofagasta, Marubeni
Gabriela Mistral
Codelco
Escondida
BHP, Rio Tinto, Mitsubishi Argentina
Sierra Gorda
KGHM, SMM, SC
Location
QB2 Project
Executing on a world class development asset
55
QB2 Project Update
56
• Overall project progress surpassed the
halfway point in April
• Pace of construction trending upwards,
setting new weekly records over the last month
• Project continues to manage through the
current COVID-19 wave in Chile, with strict
protocols in place and continuously enhanced
First production expected in H2 2022
QB2 is a long-life, low-cost operation
with major expansion potential
Photo: Lowering of shell for ball mill #3” at QB2.
QB2’s Competitive Cost Position
Competitive Operating Cost &
Capital Intensity Low Cash Cost Position
57
Based on Sanction Case (Including 199 Mt Inferred Resources)
Refer to “QB2 Project Economics Comparison” and “QB2 Reserves and Resources Comparison” slides for Reserve Case (Excluding Inferred Resources)
The description of the QB2 project Sanction Case includes inferred resources that are considered too speculative geologically to have the economic considerations applied to them that
would enable them to be categorized as mineral reserves. Inferred resources are subject to greater uncertainty than measured or indicated resources and it cannot be assumed that they
will be successfully upgraded to measured and indicated through further drilling.
C1 Cash Cost2 & AISC3 Curve1 (US$/lb, 2023E)
• Given the exceptionally low strip ratio, consistent grade
profile, compact site layout, and high level of automation,
QB2 is expected to have attractive and relatively stable
operating costs
• Exceptional strip ratio of 0.70 LOM, meaning for every one
tonne of ore mined, only 0.70 tonnes of waste need to be
mined (0.44 over first 5 full years)
− Compares to other world class asset strip ratios of 2.6
for Escondida, 3.0 for Antamina, and 3.7 for Collahuasi1
− Major benefit to sustaining capital since it reduces
mobile fleet size and replacement costs
Antamina
Escondida
Collahuasi
-
0.50
1.00
1.50
2.00
2.50
3.00
3.50
- 25% 50% 75% 100%
US$/lb
Cumulative Paid Metal (%)
AISC C1 Cash Cost
QB2
(first 5 full years)
US$1.38/lb
QB2
(first 5 full years)
US$1.28/lb
Vast, Long Life Deposit at Quebrada Blanca
Significant extension potential
• QB2 uses only ~18% of the 2020 reserve and
resource tonnage1
• Deposit is capable of supporting a very long
mine life based on throughput rate of 143 ktpd2
by utilizing further tailings capacity at already
identified sites
• Actively evaluating potential options to exploit
value of full resource through mill expansion
and / or mine life extension
• Beyond the extensive upside included in the
defined QB deposit, the district geology is highly
prospective for exploration discovery and
resource addition; mineralization is open in
multiple directions
58
.
1,259 1,202 1,401 1,432
1,325 1,472
1,891
3,621
2,141
3,393
3,492
3,119
2017 AIF 2018 Resource
Update
2019 AIF 2020 AIF
Inferred
M&I (Exclusive)
P&P
Resources (excluding reserves)
+94%3
Reserve and Resource Tonnage (Mt)
1
Based on Sanction Case (Including 199 Mt Inferred Resources)
Refer to “QB2 Project Economics Comparison” and “QB2 Reserves and Resources Comparison” slides for Reserve Case (Excluding Inferred Resources)
The description of the QB2 project Sanction Case includes inferred resources that are considered too speculative geologically to have the economic considerations applied to them that
would enable them to be categorized as mineral reserves. Inferred resources are subject to greater uncertainty than measured or indicated resources and it cannot be assumed that they
will be successfully upgraded to measured and indicated through further drilling.
QB2 Project Economics Comparison
59
The description of the QB2 project Sanction Case includes inferred resources that are considered too speculative geologically to have the economic considerations applied to them that
would enable them to be categorized as mineral reserves. Inferred resources are subject to greater uncertainty than measured or indicated resources and it cannot be assumed that they
will be successfully upgraded to measured and indicated through further drilling.
7 8
Reserve
Case1
Sanction
Case2
Mine Life Years 28 28
Strip Ratio
First 5 Full Years 0.16 0.44
LOM3 0.41 0.70
C1 Cash Cost4
First 5 Full Years US$/lb $1.29 $1.28
LOM3 US$/lb $1.47 $1.37
AISC5
First 5 Full Years US$/lb $1.40 $1.38
LOM3 US$/lb $1.53 $1.42
QB2 Reserves and Resources Comparison
Reserve Case (as at Nov. 30, 2018)1,2 Sanction Case (as at Nov. 30, 2018)2,4
60
Reserves Mt
Cu
Grade %
Mo
Grade %
Silver
Grade ppm
Proven 409 0.54 0.019 1.47
Probable 793 0.51 0.021 1.34
Reserves 1,202 0.52 0.020 1.38
Resources
(Exclusive of
Reserves)5
Mt
Cu
Grade %
Mo
Grade %
Silver
Grade ppm
Measured 36 0.42 0.014 1.23
Indicated 1,436 0.40 0.016 1.13
M&I (Exclusive) 1,472 0.40 0.016 1.14
Inferred 3,194 0.37 0.017 1.13
+ Inferred in SC pit 199 0.53 0.022 1.21
Reserves Mt
Cu
Grade %
Mo
Grade %
Silver
Grade ppm
Proven 476 0.51 0.018 1.40
Probable 924 0.47 0.019 1.25
Reserves 1,400 0.48 0.018 1.30
Resources
(Exclusive of
Reserves)3
Mt
Cu
Grade %
Mo
Grade %
Silver
Grade ppm
Measured 36 0.42 0.014 1.23
Indicated 1,558 0.40 0.016 1.14
M&I (Exclusive) 1,594 0.40 0.016 1.14
Inferred 3,125 0.38 0.018 1.15
ENAMI Interest in Quebrada Blanca
Organizational Chart
• The government of Chile owns a 10% non-funding
interest in Compañía Minera Teck Quebrada Blanca
S.A. (CMTQB) through its state-run minerals company,
Empresa Nacional de Minería (ENAMI)
• ENAMI has been a partner at QB since 1989 and is
a 10% shareholder of Carmen de Andacollo
• ENAMI is not required to fund QB2 development costs
• Project equity funding in form of:
‒ 25% Series A Shares
‒ 75% Shareholder Loans
• Until shareholder loans are fully repaid, ENAMI is
entitled to a minimum dividend, based on net income,
that approximates 2.0-2.5% of free cash flow
‒ Thereafter, ENAMI receives 10% of dividends /
free cash flow
61
.
CMTQB
TRCL
ENAMI
Teck
10%
(Series B)
100%
90%
(Series A)
JVCo
SMM
66.67%
100%
33.33%
SC
83.33% 16.67%
Chile HoldCo
QB1 / QB2 / QB3
Quebrada Blanca Accounting Treatment
Balance Sheet Cash Flow
• 100% of project spending included in property, plant and
equipment
• Debt includes 100% of project financing
• Total shareholder funding to be split between loans and
equity approximately 75%/25% over the life of the project
• Sumitomo (SMM/SC)1 contributions will be shown as
advances as a non-current liability and non-controlling
interest as part of equity
• Teck contributions, whether debt or equity, eliminated on
consolidation
• 100% of project spending included in capital
expenditures
• Sumitomo1 contribution recorded within financing
activities and split approximately 75%/25% as:
‒ Loans recorded as “Advances from Sumitomo”
‒ Equity recorded as “Contributions from
Non-Controlling Interests”
• 100% of draws on project financing included in financing
activities
• After start-up of operations
‒ 100% of profit in cash flow from operations
‒ Sumitomo’s1 30% and ENAMI’s 10% share of
distributions included in non-controlling interest
62
Income Statement
• Teck’s income statement will include 100% of QB’s
revenues and expenses
• Sumitomo’s1 30% and ENAMI’s 10% share of profit will
show as profit attributable to non-controlling interests
Endnotes: QB2 Project
Slide 55: QB2 Project
1. All-in sustaining costs (AISC) are net cash unit costs (also known as C1 cash costs) plus sustaining capital expenditures. Net cash unit costs are calculated after cash margin by-product credits assuming US$10.00/lb molybdenum and
US$18.00/oz silver. Net cash unit costs for QB2 include stripping costs during operations. AISC, Net cash unit cost and cash margins for by-products are non-GAAP financial measures which do not have a standardized meanings prescribed by
International Financial Reporting Standards (IFRS) or Generally Accepted Accounting Principles in the United States. These measures may differ from those used by other issuers and may not be comparable to such measures as reported by
others. These measures are meant to provide further information about our financial expectations to investors. These measures should not be considered in isolation or used in substitute for other measures of performance prepared in
accordance with IFRS. For more information on our calculation of non-GAAP financial measures please see our Management’s Discussion and Analysis for the year ended December 31, 2018, which can be found under our profile on SEDAR
at www.sedar.com.
Slide 57: QB2’s Competitive Cost Position
1. Source: Wood Mackenzie. Average 2021-2040.
2. C1 cash costs (also known as net cash unit costs) are presented after by-product credits assuming US$10.00/lb molybdenum and US$18.00/oz silver. C1 cash costs for QB2 include stripping costs during operations. Net cash unit costs and C1
cash costs are non-GAAP financial measures. See “Non-GAAP Financial Measures” slides.
3. All-in sustaining costs (AISC) are net cash unit costs (also known as C1 cash costs) plus sustaining capital expenditures. Net cash unit costs are calculated after cash margin by-product credits assuming US$10.00/lb molybdenum and
US$18.00/oz silver. Net cash unit costs for QB2 include stripping costs during operations. AISC, net cash unit cost and cash margins for by-products are non-GAAP financial measures. See “Non-GAAP Financial Measures” slides.
Slide 58: Vast, Long Life Deposit at Quebrada Blanca
1. Reserves and resources as at December 31, 2020.
2. Based on Sanction Case mine plan tonnage.
3. Resources are reported separately from, and do not include that portion of resources classified as reserves.
Slide 59: QB2 Project Economics Comparison
1. Based on go-forward cash flow from January 1, 2017. Based on all equity funding structure.
2. Based on go-forward cash flow from January 1, 2019. Based on optimized funding structure.
3. Life of Mine annual average figures exclude the first and last partial years of operations.
4. C1 cash costs are presented after by-product credits assuming US$10.00/lb molybdenum and US$18.00/oz silver. Net cash unit costs are consistent with C1 cash costs. C1 cash costs for QB2 include stripping costs during operations. Net cash
unit costs and C1 cash costs are non-GAAP financial measures. See “Non-GAAP Financial Measures” slides.
5. All-in sustaining costs (AISC) are net cash unit costs (also known as C1 cash costs) plus sustaining capital expenditures. Net cash unit costs are calculated after cash margin by-product credits assuming US$10.00/lb molybdenum and
US$18.00/oz silver. Net cash unit costs for QB2 include stripping costs during operations. AISC, net cash unit cost and cash margins for by-products are non-GAAP financial measures. See “Non-GAAP Financial Measures” slides.
Slide 60: QB2 Reserves and Resources Comparison
1. Mineral reserves are constrained within an optimized pit shell and scheduled using a variable grade cut-off approach based on NSR cut-off US$13.39/t over the planned life of mine. The life-of-mine strip ratio is 0.41.
2. Both mineral resource and mineral reserve estimates assume long-term commodity prices of US$3.00/lb Cu, US$9.40/lb Mo and US$18.00/oz Ag and other assumptions that include: pit slope angles of 30–44º, variable metallurgical recoveries
that average approximately 91% for Cu and 74% for Mo and operational costs supported by the Feasibility Study as revised and updated.
3. Mineral resources are reported using a NSR cut-off of US$11.00/t and include 23.8 million tonnes of hypogene material grading 0.54% copper that has been mined and stockpiled during existing supergene operations.
4. Mineral reserves are constrained within an optimized pit shell and scheduled using a variable grade cut-off approach based on NSR cut-off US$18.95/t over the planned life of mine. The life-of-mine strip ratio is 0.70.
5. Mineral resources are reported using a NSR cut-off of US$11.00/t outside of the reserves pit. Mineral resources include inferred resources within the reserves pit at a US$ 18.95/t NSR cut-off and also include 23.8 million tonnes of hypogene
material grading 0.54% copper that has been mined and stockpiled during existing supergene operations.
Slide 62: Quebrada Blanca Accounting Treatment
1. Sumitomo Metal Mining Co. Ltd. and Sumitomo Corporation are collectively referred to as Sumitomo.
63
Portfolio of Copper
Growth Options
Zafranal Cu-Au Porphyry (80%)
Located in the mineral rich Southern Peru Copper Belt
65
Project Details
Ownership 80% Teck, 20% Mitsubishi Materials Corporation
Location Castilla and Caylloma Provinces, Peru
Deposit Type Copper-gold porphyry
Products Copper-gold concentrate
Metal Production Recovered Cu (ktpa) / Au (kozpa) C1 Cash Costs (US$/lb)1 AISC (US$/lb)1
First 5 years 125 42 $1.18 $1.30
First 10 years 96 34 $1.34 $1.43
LOM 78 30 $1.50 $1.57
Ore Throughput 66 ktpd; 440.7Mt LOM total
Initial Capex $1,230 million
Reserves2,3
Tonnage Grade Contained Metal
Mt Cu (%) Au (g/t) Cu (kt) Au (koz)
Proven 408.8 0.388 0.071 1,587 939
Probable 32.0 0.216 0.046 68 47
Total P&P 440.7 0.376 0.070 1,655 986
Resources2,4 (exclusive of reserves)
Measured 5.1 0.19 0.04 10 6
Indicated 2.3 0.21 0.05 5 4
Total M&I 7.4 0.20 0.04 15 10
Inferred 62.8 0.24 0.10 150 212
Located in a mining-friendly jurisdiction with established infrastructure and a skilled workforce, the Zafranal Copper-Gold Project covers a large area of ~72,300 ha hosting district scale
upside potential. With 440.7Mt of reserves and a minimum 19-year mine life, the project will produce an average copper equivalent production of 133ktpa in the first 5 years.
Zafranal
Teck & MMC
Cerro Verde
Freeport McMoran
Tia Maria
Southern Copper
Antapaccay
Glencore
Cuajone
Southern Copper Quellaveco
Anglo American
Toquepala
Southern Copper
Arequipa
San Rafael
Minsur
Cusco
Las Bambas
MMG
Tintaya
Glencore
Constancia
Hudbay
0 30
km
Port of Matarani
<1,500m
1,500 - 3,000m
3,000 - 4,500m
>4500m
Peru
Zafranal Cu-Au Porphyry (80%)
Feasibility complete, SEIA submission in 20211
• 19 year life of mine
• Further upside potential within the deposit
footprint and in the district
Quality Investment
• Attractive front-end grade profile
• Mid range forecast LOM C1 cash costs3
• Competitive capital intensity
Mining Jurisdiction
• Strong support from Peruvian regulators
including MINEM and SENACE
• Engaged with all communities
Path to Value Realization:
• Continue to make prudent investments to de-risk the
project improving capital and operating costs
• SEIA submission in H1 2021
66
Peru
US$1,026M
After-Tax
NPV8
23.3%
After-Tax IRR
US$1,230M
Initial Capex
2.3 Year
Payback
Period
US$1.18/lb
C1 Cash
Cost3
1st 5 Years2
0.57% Cu
Average
Head Grade
1st 5 Years2
19 Year Mine
Life
US$620M
Average
EBITDA3
1st 5 Years2
Q1 Q2 Q3 Q4 Q1 Q2 Q3 Q4 Q1 Q2 Q3 Q4 Q1 Q2 Q3 Q4
2021 2022 2023 2026
SEIA
Submission
Evaluation Process
Virtual Public Hearings
Final Review Process
SEIA
Approval
Sanction
Construction 3 years
Production
Pre-sanction Engineering
(3,000)
(2,000)
(1,000)
-
1,000
2,000
3,000
(1,200)
(800)
(400)
-
400
800
1,200
2022
2023
2024
2025
2026
2027
2028
2029
2030
2031
2032
2033
2034
2035
2036
2037
2038
2039
2040
2041
2042
2043
Capital Cost FCF EBITDA Cumulative FCF (RHS)
Illustrative Timeline
Annual Capital, EBITDA3 and Cashflow (US$M)
San Nicolás Cu-Zn (Ag-Au) VHMS (100%)
Located in the mineral rich Mexican Silver Belt
67
Located in a well-established mining district in Mexico with established infrastructure and a skilled workforce, the San Nicolás Project represents one of the world’s most significant
undeveloped VHMS deposits. The Prefeasibility Study envisions processing 107.3 Mt of ore over a 15-year mine life.
Project Details
Ownership 100% Teck
Location Zacatecas State, Mexico
Deposit Type Cu-Zn rich VHMS
Products Copper & Zinc concentrate with gold and silver by-products
Avg. Metal Production
Cu
(ktpa)
Zn
(ktpa)
Au
(kozpa)
Ag
(kozpa)
C1 Cash Costs
(US$/lb Cu)1
First 5 full years 63.2 147.4 30.7 3,286 ($0.18)
First 10 full years 62.1 114.3 22.4 2,504 $0.18
LOM 65.8 91.0 17.5 2,072 $0.42
Ore Throughput 21 ktpd; 107 Mt LOM total
Initial Capex US$814 million
Reserves2,3 Tonnage Grade Contained Metal
Mt Cu (%) Zn (%) Au (g/t) Ag (g/t) Pb (%) Cu (kt) Zn (kt) Au (koz) Ag (koz) Pb (kt)
Proven 47.7 1.26 1.61 0.41 23.93 0.12 599.6 766.6 628.4 36,713 57.2
Probable 57.5 1.01 1.37 0.39 20.91 0.09 583.4 788.2 715.7 38,665 52.9
Total P&P 105.2 1.12 1.48 0.4 22.28 0.1 1,183.0 1,554.8 1,344.1 75,378 110.1
Resources2,3,4
Measured 0.5 1.35 0.39 0.08 6.4 0.01 7.1 2 1.3 107 0.1
Indicated 6.1 1.17 0.71 0.2 11.86 0.05 71 43.2 38.3 2,315 3.1
Total M&I 6.6 1.18 0.69 0.19 11.43 0.05 78 45.3 39.6 2,423 3.2
Inferred 4.9 0.94 0.62 0.13 9.26 0.05 46.3 30.7 20.4 1,469 2.4
Mexico
San Nicolás Cu-Zn (Ag-Au) VHMS (100%)
Prefeasibility complete and Environmental Impact Assessment nearing completion1
• One of the world’s most significant
undeveloped VMS deposits
• Updated Resources Statement
Quality Investment
• Expect C1 cash costs3 in the 1st quartile
• Competitive capital intensity
• Co-product Zn and Au & Ag credits
Mining Jurisdiction
• Well-established mining district in Mexico
• Community engagement well underway
• Social-environmental studies advancing
Path to Value Realization:
• Completed multi-disciplinary design, engineering, and
baseline environmental and social field studies in 2020
• Completion of a Prefeasibility and EIA in H1 2021
Annual Capital, EBITDA3 and Cashflow (US$M)
US$1,499M
After-Tax
NPV8
34.0% After-
Tax IRR
US$814M
Initial Capex
2.5 Year
Payback
Period
US$(0.18)/lb
C1 Cash
Costs3
1st 5 Years2
1.07% Cu
Average
Head Grade
1st 5 Years2
15 Year Mine
Life
US$489M
Average
EBITDA3
1st 5 Years2
68
Mexico
Q1 Q2 Q3 Q4 Q1 Q2 Q3 Q4 Q1 Q2 Q3 Q4 Q1 Q2 Q3 Q4
2021 2022 2023 2025
MIA Submission MIA Approval
Sanction
Construction 2 years
Production
Commissioning
Start FS
ETJ Submission ETJ Approval
FS Complete
Site prep. & Adv. Eng.
Q1
2026
Illustrative Timeline
(2,000)
(1,000)
-
1,000
2,000
3,000
4,000
(600)
(400)
(200)
-
200
400
600
800
2023
2024
2025
2026
2027
2028
2029
2030
2031
2032
2033
2034
2035
2036
2037
2038
2039
Capital Cost FCF EBITDA Cumulative FCF (RHS)
QB3 Cu-Mo-Ag (60% Interest)
Creating the platform to realize the potential in the vast resource
Path to Value Realization:
• Preparing for prefeasibility study with various paths to
expansion including 50% increase, doubling and tripling of
throughput
• Solid environmental, social and regulatory programs
already in place for QB2
69
Long Life Asset
• Top global copper resources by size
• R&R has increased by 94% since 2017
• Mineralization open in multiple directions
Quality Brownfield Growth Opportunity
• Reduced execution risk
• Low capital intensity
• Greater economies of scale
Mining Jurisdiction
• Established regional relationships
• Debottlenecking and/or twinning of existing
infrastructure
QB Hypogene Reserve
and Resource
Tonnage Grades
Mt Cu (%) Ag (g/t) Mo (%)
Reserves1,2
Total P&P 1,432.3 0.51 1.4 0.021
Resources1,3
(exclusive of reserves)
Measured 929.0 0.37 1.1 0.013
Indicated 2,692.2 0.36 1.1 0.017
Total M&I 3,621.2 0.37 1.1 0.016
Inferred 3,119.3 0.35 1.1 0.017
Chile
QB2 – Aerial View of the Concentrator Area
Galore Creek Cu-Au-Ag (50% Interest)
Prefeasibility Study started in Q1 2021
Long Life Asset
• Large high grade copper-gold system
• Legacy and Bountiful zones discovered in
2013-14 reflected in updated Resource
Quality Investment and Partnership
• Expect C1 cash costs4 in the 1st quartile
• Strong technical, commercial, and
community expertise from Partners
Path to Value Realization:
• Multi-disciplinary engineering studies and community
engagement work planned in support of prefeasibility
• Focus is on reducing cost and risk related to access
70
Stable Jurisdiction
• Improving infrastructure in Golden Triangle
including power, roads and port facilities
• Tahltan Nation Participation Agreement
Resources1,2,3
Tonnage Grades
Mt Cu (%) Au (g/t) Ag (g/t)
Measured 256.8 0.72 0.36 5.8
Indicated 846.7 0.39 0.23 3.7
Total (M+I) 1,103.5 0.47 0.26 4.2
Inferred 198.1 0.27 0.21 2.7
Canada
Galore Creek Valley
NuevaUnión Cu-Mo-Au-Ag (50% Interest)
Increased value through partnership
Path to Value Realization:
• Continue to build on positive social and environmental
baseline aspects of the project
• Translate opportunities identified in the feasibility
study into improved project economics
71
Long Life Asset
• Top five of the largest undeveloped Cu-Au
projects in the Americas
• Further district potential
Quality Investment Opportunity
• Phased development will allow funding of
expansions through project cash flows
• Strong partnership arrangement
Mining Jurisdiction
• Permitting pathway well defined
• Strong familiarity with the region and
established community relationships
La Fortuna Deposit
Tonnage Grades
Mt Cu (%) Ag (g/t) Au (g/t)
Reserves1,3
Total P&P 682.2 0.51 0.8 0.47
Resources1,3,4
(exclusive of reserves)
Measured 9.6 0.42 0.9 0.47
Indicated 236.7 0.51 1.1 0.59
Total (M+I) 246.3 0.51 1.1 0.59
Inferred 479.7 0.43 1.0 0.40
Chile
Relincho Deposit
Tonnage Grades
Mt Cu (%) Ag (g/t) Mo (%)
Reserves1,2
Total P&P 1,553.8 0.35 1.5 0.016
Resources1,2
(exclusive of reserves)
Measured 319.0 0.19 1.0 0.006
Indicated 463.0 0.26 1.2 0.009
Total (M+I) 782.0 0.23 1.12 0.008
Inferred 724.7 0.36 1.3 0.012
Resource Definition Drilling
Mesaba Cu-Ni-PGM, Co-Au-Ag (100% Interest)
Top 3 nickel contained-in-sulphide deposit globally1
Path to Value Realization:
• Baseline environmental studies, technical programs,
and community engagement work proceeding
• Assessment of district development synergies
72
Long Life Asset
• Large Cu-Ni-PGE-Co magmatic deposit
• Substantial maiden Resource Statement at
0.703% CuEq grade2
Quality Investment Opportunity
• Expect C1 cash costs5 in the 1st quartile
• Production of a marketable copper and bulk
copper-nickel concentrate
Stable Jurisdiction
• Located in historic Mesabi Iron Range
• Building a strong technical, commercial, and
community team in Minnesota
Resources3,4 Tonnage Grades
Mt Cu (%) Ni (%) Co (%) Au (g/t) Ag (g/t) Pt (g/t) Pd (g/t)
Measured 244.1 0.47 0.11 0.009 0.03 1.2 0.041 0.120
Indicated 1,334.1 0.42 0.10 0.007 0.03 1.0 0.034 0.093
Total (M+I) 1,578.2 0.43 0.10 0.01 0.008 1.1 0.035 0.097
Inferred 1,461.9 0.35 0.09 0.01 0.006 1.0 0.04 0.127
USA
Orebody Knowledge
Schaft Creek Cu-Mo-Au-Ag (75%)
Assessing options for this large Cu-Mo-Au-Ag deposit
Path to Value Realization:
• Multi-Year Area Based permits in place
• Evaluating staged development options
• Continuing baseline environmental and social
programs
73
Long Life Asset
• Large Cu-Mo-Au-Ag porphyry deposit
• Good property wide exploration potential
• Updated Resource Statement
Quality Investment Opportunity
• Expect competitive cash operating costs
• Solid engineering and design work on which
to improve investment case
Stable Jurisdiction
• Improving infrastructure in Golden Triangle
including power, road and port facilities
• Relationship with Tahltan Nation
Resources1,2 Tonnage Grades
Mt Cu (%) Au (g/t) Ag (g/t) Mo (%)
Measured 166.0 0.32 0.2 1.5 0.021
Indicated 1,127.2 0.25 0.15 1.2 0.016
Total (M+I) 1,293.2 0.26 0.16 1.2 0.017
Inferred 316.7 0.19 0.14 1.1 0.019
Canada
Exploration Site Access and Logistic
Endnotes: Portfolio of Copper Growth Options
Slide 65: Zafranal Cu-Au Porphyry (80%)
1. C1 cash cost and All-In Sustaining Cost (AISC) with by-product credits calculated at: US$3.50/lb Cu and US$1,400/oz Au. All values exclude first and last partial years of production. C1 cash cost and AISC are non-GAAP financial
measures. See “Non-GAAP Financial Measures” slides.
2. Mineral Reserves and Resources from Teck’s 2020 AIF. Estimates were prepared assuming metal prices of US$3.00/lb Cu and US$1,200/oz Au, variable metallurgical recoveries up to 89.5% for copper and up to 56% for gold and pit slope
angles of 30 – 41.7 degrees.
3. Mineral Reserves are reported using a variable Net Smelter Return cut-off of US$6.10 to 6.35/t averaging US$6.11/t. The life-of-mine strip ratio is 1.14.
4. Mineral Resources are constrained by a pit shell developed using Whittle™ software considering similar assumptions as for Reserves and use a 0.12% Cu cut-off for Supergene and Hypogene materials.
Slide 66: Zafranal Cu-Au Porphyry (80%)
1. Financial summary based on At-Sanction Economic Assessment using: US$3.50/lb Cu and US$1,400/oz Au and US$18/oz Ag. Detailed Engineering, Permitting and Project Set-up costs not included. All calendar dates and timeline are
preliminary potential estimates.
2. First five full years of production.
3. EBITDA and C1 cash cost are non-GAAP financial measures. See “Non-GAAP Financial Measures” slides.
Slide 67: San Nicolás Cu-Zn (Ag-Au) VHMS (100%)
1. C1 cash cost with by-product credits, calculated at : US$3.50/lb Cu, US$1.15/lb Zn, US$1,400/oz Au and US$18/oz Ag. All values exclude first and last partial years of production. C1 cash cost is a non-GAAP financial measure. See “Non-GAAP
Financial Measures” slides.
2. Mineral Reserves and Resources from Teck’s 2020 AIF. Estimates were prepared assuming metal prices of US$3.00/lb Cu, US$1.10/lb Zn, US$1,300/oz Au and US$20/oz Ag.
3. The estimates assume different net smelter return cut-offs for low zinc/copper ores and high zinc/copper ores, respectively, of US$9.71 per tonne and US$13.15/tonne net smelter return based on an estimate of the marginal cost of production
for the relevant ore.
4. Mineral Resources estimates were confined within a conceptual open pit shell using Whittle™ software. Inputs to the pit shell included direct mining costs of US$1.27/t moved; process costs of US$10.20/t milled which includes G&A costs;
variable concentrate metallurgical recovery equations by element and geomet domain; and inter-ramp angles between 42 and 46 degrees. Reported mineral resources are exclusive of reserves.
Slide 68: San Nicolás Cu-Zn (Ag-Au) VHMS (100%)
1. Financial summary based on At-Sanction Economic Assessment using: US$3.50/lb Cu, US$1.15/lb Zn, US$1,400/oz Au and US$18/oz Ag. Go-forward costs of Prefeasibility, Detailed Engineering, Permitting and Project Set-up costs not
included. All calendar dates and timeline are preliminary potential estimates.
2. First five full years of production (Year 2 – Year 6).
3. EBITDA and C1 cash cost are non-GAAP financial measures. See “Non-GAAP Financial Measures” slides.
Slide 69: QB3 Cu-Mo-Ag (60% Interest)
1. Mineral Reserves and Resources from Teck’s 2020 AIF. Estimates were prepared assuming metal prices of US$3.00/lb Cu and US$ 9.4/lb Mo, pit slope angles of 30 – 42 degrees and variable metallurgical recoveries.
2. Mineral Reserves estimates are based on a variable Net Smelter Return cut-off and reported at an average value of US$19.39/t. The life-of-mine strip ratio is 0.7:1.
3. Mineral Resources are constrained by a pit shell developed using Whittle™ software considering similar assumptions as for Reserves. Resources are reported at Net Smelter Return cut-off of US$ 8.35/t.
Slide 70: Galore Creek Cu-Au-Ag (50% Interest)
1. Mineral Resources are estimated using metal price assumptions of US$3.00/lb copper, US$1,200/oz gold and US$20/oz silver using a US$8.84/t Net Smelter Return cut-off.
2. Mineral Resources are reported within a constraining pit shell developed using Whittle™ software. Inputs to the pit optimization include the following assumptions: metal prices; pit slope angles of 36.3–51.9º; variable metallurgical recoveries
averaging 90.6% for copper, 73.1% for gold and 64.5% for silver.
3. Mineral Resources have been estimated using a US$8.84/t Net Smelter Return cut-off, which are based on cost estimates from a 2011 Prefeasibility Study. Assumptions consider that major portions of the Galore Creek Project are amenable for
open pit extraction.
4. C1 cash cost is a non-GAAP financial measure. See “Non-GAAP Financial Measures” slides.
74
Endnotes: Portfolio of Copper Growth Options
Slide 71: NuevaUnión Cu-Mo-Au-Ag (50% Interest)
1. Mineral Reserves and Resources from Teck’s 2020 AIF.
2. Relincho Mineral Reserves and Mineral Resources are reported using an average Net Smelter Return cut-off of US$11.00/t and US$6.72/t, respectively, and assuming metal prices of US$ 3.00/lb Cu and US$10.00/lb Mo and US$18.00/oz Ag.
3. La Fortuna Mineral Reserves and open pit Mineral Resources are reported using an average Net Smelter Return cut-off of US$10.55/t and US$9.12/t, respectively, and assuming metal prices of US$3.00/lb Cu and US$1,200/oz Au.
4. Mineral Resources outside of the Mineral Reserve pit are defined using a conceptual underground mining envelope based on same price assumptions.
Slide 72: Mesaba Cu-Ni-PGM, Co-Au-Ag (100% Interest)
1. Ranking of nickel contained in undeveloped global nickel sulphide deposits derived from SNL (S&P Global), company websites and technical reports on SEDAR.
2. Copper equivalent calculations based on current Measured & Indicated Resources only adjusted for recoveries of by-product metals.​
3. Mineral Resources are reported at a cut-off of 0.2% copper, equivalent to a Net Smelter Return cut-off of US$5.24/t using metal price assumptions of US$ 3.00/lb copper, US$ 7.60/lb nickel, US$1,250/oz gold, US$20.00/oz silver, $23.00/lb
cobalt, $900/oz palladium, and $1,100/oz platinum.
4. Mineral Resources are reported within a constraining pit shell developed using Whittle™ software. Inputs to the pit optimization include the following assumptions: metal prices; inter-ramp pit slope angles of 37º, 40º, and 49º for overburden,
sedimentary, and intrusive lithologies respectively; and average metallurgical recoveries of 93.2% for Cu, 84.0% for Ni, 41.2% for Co, 59.3% for Au, 67.5% Ag, 59.3% for Pd, and 63.8% for Pt.
5. C1 cash cost is a non-GAAP financial measure. See “Non-GAAP Financial Measures” slides.
Slide 73: Schaft Creek Cu-Mo-Au-Ag (75%)
1. Mineral Resources are estimated using metal price assumptions of US$3.00/lb copper, US$10.00/lb molybdenum, US$1,200/oz gold, and US$20/oz silver using a US$4.31/t Net Smelter Return cut-off.
2. Mineral Resources are reported within a constraining pit shell developed using Whittle™ software. Inputs to the pit optimization include the following assumptions: metal prices; pit slope angles of 40–44º; metallurgical recoveries reflective of
prior test work that average 86.6% for copper, 73.0% for gold and 48.3% for silver.
75
Technology and
Innovation
RACE21TM
Our innovation-driven business transformation program
77
• Unify and modernize Teck’s core systems
• Establish technology foundation that facilitates
deployment of Connect and Automate reliably and at
scale
• For example: Wireless site infrastructure to support
automation, sensing, site communications, information
access, pit-to-port integration and advanced analytics
• Accelerate and scale autonomy program
• Transformational shift in safety
• Reduce per-tonne mining costs with smaller fleets
• Provide innovation platform to enable implementation
of advanced analytics to drive cycle time improvement
& predictive maintenance
Renew Automate
RACE21TM
Our innovation-driven business transformation program
78
• Link disparate systems into a collaborative digital
platform with powerful tools for sensing and analyzing
in real time
• For example: Dynamic and predictive models to
reduce variability, leading to significant improvements
in throughput and recovery
• The natural implication of Renew, Automate, and
Connect is we can re-imagine what it means to work
at Teck and re-design our operating model to attract,
recruit, train and retain the workforce of the future
Connect Empower
Significant Value Has Been Captured
Through RACE21TM
79
COST
Reduced operational
costs
PROFITABILITY
Step-change impact to
profitability
SAFETY
Transformational
safety impact
PRODUCTIVITY
Increased productivity
through technology
and innovation
Advanced data
analytics and artificial
intelligence to reduce
risk of heavy vehicle /
light vehicle
interactions
Increased copper
throughput by ~7%
and recovery by ~2%
at Highland Valley
Copper
Advanced analytical
tools contributed to
record haul truck
productivity across our
major mine sites
Blending optimization
tools used at Trail
Operations to reduce
costs
Copper
Business Unit & Markets
Supply Continues to be at Risk;
Copper Demand Improves
• Demand for imported cathode into China up
36% in 2020, down 7% YTD February 2021 on
higher prices and higher scrap imports up 60%
• Demand outlook ex-China improving
• 2021 mine production to date ~300 kt or ~7%,
similar to 2020
• Concentrate market tightness continues into
2021; Spot terms lowest since 2011, COVID-19
restrictions continue to impact 2021 supply
• Mine growth to resume in 2022 and peak in
2024, with multi-year gap for next projects due
to timeline to execution
• Global stimulus positive for metals demand,
risk that further lockdowns could affect
short-term consumer demand
81
Copper Market
Raw materials weigh on downstream production
• Demand for raw materials and mine
disruptions keep concentrate demand high
‒ Mine production cuts over 1.4 Mt in 2020,
continue into Q1 2021
‒ Chinese smelters to take advanced
maintenance in April/May
‒ Spot TC/RC drop to high teens / low 20s
• LME/SHFE stocks rise through 2021, but
remain at low levels
• LME price at near record highs, while
Chinese cathode premiums fall
• Scrap availability improving on higher prices
and change in scrap import classification
• Chinese cathode premiums US$38-40 per
tonne in Q1 2021; buyers look to scrap to
offset higher cathode prices
Copper Scrap is 18% of Supply and 20% of Total Demand2
Scrap Demand Increases on Higher Copper Price1
82
Cathode Demand 23.6 Mt Copper Demand 29.6 Mt
Wire Rod
74%
Billet 13%
Cable/Slab
13% Electrical
Network
28%
Construction
28%
Industrial
Machinery
11%
Consumer
& General
21%
Transport
12%
(600)
400
1,400
2,400
3,400
Jan-19 Jul-19 Jan-20 Jul-20 Jan-21
RMB/Mt
Price Spread between #1 Bare Bright Copper and Copper Cathode
Rational Price Spread
• Chinese mine production flat to 2024 on lack of resources
• Total probable projects: 900 kmt
Mine kmt
Kamoa – Kakula 535
PT – Freeport (vs 2019) 435
Quebrada Blanca 2 300
Quellaveco to 2024 275
Cobre Panama 252
China to 2024 345
All others (Spence, Chuqui UG, Escondida) 1,090
SXEW Reductions to 2024 (360)
Reductions & Closures (654)
Mine Production Set To Increase 2.2 Mt By 20241
Includes:
83
Global Copper Mine Production Increasing Slowly
12,000
14,000
16,000
18,000
20,000
22,000
2018 2019 2020 2021 2022 2023 2024 2025 2026 2027
Other China
PT Freeport Cobre Panama
Quellaveco Quebrada Blanca
Kamoa-Kakula New Mines
Global Copper Mine Production2 (kt contained)
84
$0
$10
$20
$30
$40
$50
$60
$70
$80
$90
$100
$110
$120
Annual/Mid Year Spot
TC/RCs Spot and Annual Falling1 (US$/lb)
Copper Disruptions Continue To Impact Mines
Disruptions (kt)2;
-1,800
-1,600
-1,400
-1,200
-1,000
-800
-600
-400
-200
0
2005 2007 2009 2011 2013 2015 2017 2019 2021
3.6%
2.7%
4.0%
6.6%
7.0%
Run Rate
Rapid Growth in Chinese Copper Smelter Capacity
China added 3.2 Mt since 2019 (2.1 Mt still ramping up)
85
Chinese Copper Mine Growth1
(kt)
0
100
200
300
400
2021
137kt
2022
130 kt
2023
25 kt
+2.1 Mt of New Smelting Capacity2
(kt blister)
0
100
200
300
400
500
600
700
800
900
1000
2020
510 kt
2021 – 2023
1,615 kt
2023+
1,900 kt
Copper Supply
Chinese imports shift to concentrates to feed smelter capacity increases
86
Chinese Imports Shift to Concentrates3
(Copper content, kt)
0
2,000
4,000
6,000
8,000
10,000
12,000
2016 2017 2018 2019 2020 2021e 2022e
Concentrates Blister Scrap Cathode
Chinese Scrap/Blister Imports Fall2
(Copper content, kt)
0
500
1,000
1,500
2,000
2,500
2013 2014 2015 2016 2017 2018 2019 2020 2021e 2022e
Blister Scrap
• Cathode imports could drop in 2021, after tight concentrates
and scrap market in 2020 saw record cathode imports
• Concentrates imports will continue to rise on smelter demand
• Reclassified scrap/blister could now rise off the
lows of 2020
Copper Metal Stocks
Raw material shortages increase cathode demand
• Copper prices traded >US$10,000 per tonne in
late April, near record high seen in February 2011
• Exchange stocks have fallen 236 kt since March
2020, now equivalent to 6.0 days of global
consumption
• SHFE stocks decreased ~177 kt since Q1 2020
and saw the lowest seasonal build in over 5 years
• Strong copper prices have pushed consumers
to scrap markets for lower priced inputs
• Over 70% of visible global copper inventories
including bonded, are now in China
• Underlying stimulus demand remains strong and
supply chain inventories remain low across several
downstream markets.
87
Daily Copper Prices (US$/mt) and Stocks1 (kt)
0
200
400
600
800
1,000
1,200
1,400
1,600
1,800
$0
$2,000
$4,000
$6,000
$8,000
$10,000
$12,000
2011
2012
2013
2014
2015
2016
2017
2018
2019
2020
2021
LME Stocks Comex
SHFE Bonded Estimate
Price
Long Life and Stable Assets in Copper
88
Antamina Highland Valley
• Performance to date is in
line with plan
• 2021 guidance of 91,000 to
95,000 tonnes copper
• Zinc production guidance
remaining high at 95,000 to
100,000 tonnes in 2021
• Performing well and
treating harder ores
• 2021 guidance of 128,000
to 133,000 tonnes copper
• RACE21TM application of
processing analytics to
optimize throughput and
recovery
Carmen de Andacollo
• Performance to date is in
line with plan
• 2021 guidance of 46,000 to
51,000 tonnes copper
• Lower copper grades in
2021
• RACE21TM application of
processing analytics to
optimize throughput and
recovery
Quebrada Blanca
• Performing well with
production extended to end
of 2021
• 2021 guidance of 10,000 to
11,000 tonnes copper
• QB2 first production
expected H2 2022
• QB2 will double Teck’s
copper production
Foundation of stable operations, substantial near-term growth
Operations Improvement and
Cash Flow Focus in Copper
Productivity & Cost Management
• Focus on reliability and maintenance
and cross site sharing
• RACE21TM and continuous
improvement pipeline driving benefits
across sites – a key driver of margins
• Cost reductions embedded in plans
89
Focused Investment Priorities
• Key water, tailings and regulatory projects
drive sustaining capital requirements
• Near-term higher sustaining spending
from tailings facility costs at Antamina
• Long-term sustaining capex (2024+)
in copper expected at $125 million,
excluding QB2 and life extension projects
Copper Unit Costs
90
Operating Cost1 Breakdown in 2020
Labour 30%
Contractors and Consultants 11%
Operating Supplies 16%
Repairs and Maintenance Parts 16%
Energy 20%
Other 6%
Total 100%
Operating Costs
47%
Unit Costs1 in 2020
Royalties
2%
Depreciation
and
Amortization
24%
Transportation
6%
Operating Costs
68%
Endnotes: Copper
Slide 82: Copper Market
1. Source: Shanghai Metal Market.
2. Source: Wood Mackenzie.
Slide 83: Global Copper Mine Production Increasing Slowly
1. Source: Data compiled by Teck based on information from Wood Mackenzie and Company Reports (average production first 10 years).
2. Source: Data compiled by Teck based on information from Wood Mackenzie and Teck’s analysis of publicly available quarterly financial reports and other public disclosures of various entities.
Slide 84: Copper Disruptions Continue o Impact Mines
1. Source: Data compiled by Teck based on information from Wood Mackenzie, CRU, and Metal Bulletin.
2. Source: Data compiled by Teck based on information from Wood Mackenzie and Teck’s analysis of publicly available quarterly financial reports and other public disclosures of various entities.
Slide 85: Rapid Growth in Chinese Copper Smelter Capacity
1. Includes mine projects with copper capacity >10 ktpa. Source: BGRIMM.
2. Source: BGRIMM, SMM, Teck.
Slide 86: Copper Supply
1. Source: Wood Mackenzie, GTIS, BGRIMM, SMM.
2. Source: Wood Mackenzie, GTIS, BGRIMM, SMM.
Slide 87: Copper Metal Stocks
1. Source: LME, Comex, SHFE, SMM.
Slide 90: Copper Unit Costs
1. Copper unit costs are reported in US dollars per pound. Non-GAAP financial measures. See “Non-GAAP Financial Measures” slides.
91
Zinc
Business Unit & Markets
Zinc Mines Return but Insufficient to Meet Demand
Zinc mine supply still at risk, pressure on smelters continues
• COVID-19 and poor financials resulted in
numerous mine suspensions and closures,
eliminating significant production in 2020
• Mine production has returned, including several
previously closed mines due to high LME zinc
prices. Despite return of mine supply, the
concentrate market remains very tight in 2021
• Chinese and ROW manufacturing restarted with
consumption driven by infrastructure, construction
and automotive
• Despite roll-out of vaccines, escalating cases of
COVID-19 and the continued economic impact
increase concerns for future demand and supply
of zinc in 2021
93
Zinc Market
Raw materials shortages and improving demand support prices
• Demand for raw materials and mine disruptions
due to COVID-19 kept concentrate demand strong
‒ Mine production in 2020 estimated decline >1 Mt,
while smelter cuts were only ~300 kt
‒ Ongoing spread of the virus and COVID-19
protocols impacting production in 2021
‒ Despite return of mine production, concentrate
supply remains tight; Spot TCs down -78% from
February 2020 peak, currently ~US$70/dmt
‒ Concentrate market expected to remain tight in
2021; Gamsberg pit failure likely to further impact
supply
• Construction, infrastructure, and automobile demand
driving zinc demand in China
‒ Galvanized utilization rates rebounded after Lunar
New Year to 91% in March, well above 78%
long term average
‒ China zinc premiums remained above ~US$100
per tonne, for the fifth straight month
Zinc Tied to the Protection of Steel for 60% of Total Demand2
Steel Demand in China Supporting Zinc Price1
25
50
75
100
Jun-17 Dec-17 Jun-18 Dec-18 Jun-19 Dec-19 Jun-20 Dec-20
Operating
Rates
%
Total Smelter Operating Rates Large Zinc Smelters
Operating Rates at Galvanizers
94
Zinc Demand 13.1 Mt Zinc End Uses 13.1 Mt
Consumer
Products
6%
Construction
51%
Transport
20%
Industrial
Machinery
7%
Infrastructure
16%
Galvanizing
52%
Oxides &
Chemical
7%
Brass &
Semi Cast
16%
Semi-
Manufactured
6%
Die Cast
Alloys
15%
Other
4%
0
1,000
2,000
3,000
4,000
5,000
6,000
7,000
2013
2014
2015
2016
2017
2018
2019
2020
2021
2022
0
1,000
2,000
3,000
4,000
5,000
6,000
7,000
2013
2014
2015
2016
2017
2018
2019
2020
2021
2022
Chinese Mine and Smelter Production
Mine production flat while smelter production increases
95
Chinese Refined Production Up 9% Since 20182
(kt Contained)
Chinese Mine Production Down 1% Since 20181
(kt Contained)
Delayed projects and decreasing ore grades continue to impact Chinese mines
while smelter production increases
3.4
3.6
3.8
4.0
100
350
270
180
300
250 237
392
495
360
200
-630
83
-38
-153
40
-50
50
-800
-600
-400
-200
0
200
400
600
Early-year estimate Adjusted estimate
Global Mine Production Remains Under Pressure
Ongoing risk to supply growth in 2021
96
Estimated Chinese Zinc Mine Growth
Rarely Achieved1 (Kmt Contained)
Zinc Ore Grades Falling at Chinese Mines3
(Ore grade, zinc %)
-4,000
-3,000
-2,000
-1,000
0
1,000
New Mines China Mines ROW Mines Change
Changes in Mine Production Since Q1 20182
0
200
400
600
800
1,000
1,200
1,400
1,600
Jan-12
Aug-12
Mar-13
Oct-13
May-14
Dec-14
Jul-15
Feb-16
Sep-16
Apr-17
Nov-17
Jun-18
Jan-19
Aug-19
Mar-20
Oct-20
Domestic Commercial Stocks Bonded Stocks
Smelter + Consumer Stocks
503
770 788
627 627
1,213 1,229 1,247
0
200
400
600
800
1,000
1,200
1,400
1,600
2016
2017
2018
2019
2020E
2021E
2022E
2023E
Stocks Continue to Decrease
While Refined Production Increases in China
97
Additional Zinc Metal
Required to Fill the Gap3 (kt)
De-stocking Continues
Chinese Stocks at Record Lows1,2 (kt)
• 2020 stocks down despite lower Q1 consumption due to COVID-19
• Seasonal stock increase during Lunar New Year was lower than previous years
• Additional metal required to meet 2021 demand
• Following the return of Chinese mine production
after COVID-19 shutdowns, increasing smelter
production kept China reliant on imported
concentrate
• Chinese mine production was expected to
increase in 2020; decreasing ore grades and
delayed projects kept production down -1% YoY
• Mine production has recovered in South America,
after losing >1.0 Mt of production in 2020; but
increasing cases of COVID-19 variants likely to
lead to further affect mine supply
• 2021 mine production currently forecast to grow
7.7%, but already impacted by COVID-19
hygiene protocol lowering guidance at several
mines and Gamsberg pit failure
Zinc Supply
Mine production expected to grow in 2021, but remains at risk due to COVID-19
98
Zinc Mine Production1 (kt contained)
0
2,000
4,000
6,000
8,000
10,000
12,000
14,000
16,000
2017 2018 2019 WM Q4
2019 F
2020 2021 2022 2023
ROW Others China
Glencore Dugald River
Gamsberg New Century
New Mines WM Pre-Covid 2020 Forecast
Zinc Concentrate Treatment Charges
Treatment Charges1 (USD/dmt)
99
0
50
100
150
200
250
300
350
Spot TC Benchmark TC
Spot TCs
down -78%
vs. Feb 2020 peak
Benchmark TCs
down -47% YoY
Zinc Metal Stocks
COVID-19 related decrease in demand resulting in minor inventory build
• Deficits over past 5 years drove down stocks,
with total stocks at only 6.5 days of global
consumption by the end of 2020, compared to
a 19-day historical average
• Despite demand returning, overall refined zinc
stocks have increased in 2021
• LME and Chinese stocks have increased 57%
year-to-date, still only 10.8 days of consumption
- LME stock build from excess metal
accumulated during COVID-19 lockdowns
- LME warehouses incentivizing traders to
lock up metal on exchange in rent deals
- SHFE stocks increased during Lunar New Year
but already decreased 17% since the peak in
February
100
Daily Zinc Prices1,2 (US$/mt)
and Stocks1,2 (kmt)
0
500
1,000
1,500
2,000
2,500
0
500
1,000
1,500
2,000
2,500
3,000
3,500
4,000
2010
2011
2012
2013
2014
2015
2016
2017
2018
2019
2020
2021
LME Stocks Bonded SHFE Price
Largest Global Net Zinc Mining Companies
Teck is the Largest Net Zinc Miner1(kt)
Provides significant exposure to a rising zinc price
101
0
50
100
150
200
250
300
Teck
Public Company
Private Company
Integrated Zinc Business
102
Red Dog Trail
• Performance to date is in line with plan
• Water related issues that impacted 2020
are not expected to impact 2021 production
• 2021 guidance of 490,000 to 510,000 tonnes of
zinc in concentrate
• Lower zinc sales in H1 2021, particularly in
Q2 2021, due to lower 2020 production
• VIP2 project is helping to offset lower grades
• Planned annual zinc roaster maintenance
during Q2 will impact production in Q2
• 2021 guidance of 300,000 to 310,000 tonnes
of refined zinc
• Refined lead and silver production similar to
prior years in 2021 but will fluctuate
• Focus on margin improvement including
RACE21TM implementation
Strengthening our zinc business
Operations Improvement and
Cash Flow Focus in Zinc
Productivity
• Focus on asset management and cross
site sharing
• RACE21TM and continuous
improvement pipeline driving benefits
across sites – a key driver of margins
• Cost reductions embedded in plans
103
Focused Investment Priorities
• Key water, tailings and regulatory projects
drive sustaining capital requirements
• Near term higher sustaining spending from
tailings related projects at Red Dog and air
quality and asset renewal at Trail Operations
• Long-term sustaining capex (2024+) in zinc
expected at $150 million, excluding life
extension projects
Red Dog Sales Seasonality
• Operates 12 months
• Ships ~ 4 months
• Shipments to inventory in Canada
and Europe; Direct sales to Asia
• ~65% of zinc sales in second half
of year
• ~100% of lead sales in second half
of year
• Sales seasonality causes net cash
unit cost seasonality
104
Zinc Sales 1 (%)
Lead Sales1 (%)
21%
16%
31% 32%
0%
10%
20%
30%
40%
Q1 Q2 Q3 Q4
0% 1%
66%
33%
0%
20%
40%
60%
80%
Q1 Q2 Q3 Q4
Red Dog Net Cash Unit Cost Seasonality
Five-Year Average Red Dog Net Cash Unit Costs1 (US$/lb)
105
• Seasonality of Red Dog unit costs largely due to lead sales during the shipping season
• Higher net cash unit costs expected in 2021 compared to 2020 due primarily to lower
production volumes in 2020, as well as lower contribution from silver by-products
-
0.20
0.40
0.60
Q1 Q2 Q3 Q4
Zinc Unit Costs
106
Operating Cost1 Breakdown in 2020
Labour 35%
Contractors and Consultants 10%
Operating Supplies 11%
Repairs and Maintenance Parts 9%
Energy 18%
Other 17%
Total 100%
Operating Costs
47%
Unit Costs1 in 2020
Depreciation
and
Amortization
24% Operating Costs
68%
Depreciation and
Amortization
13%
Operating
Costs
38%
Transportation
12%
Concentrate
Purchases
26%
Royalties
11%
Red Dog in Bottom Quartile of Zinc Cost Curves
Higher zinc prices reduce risk of economic closures
Total Cash + Capex Cost Curve 20201 (US¢/lb)
107
0
20
40
60
80
100
120
140
160
180
200
0% 25% 50% 75% 100%
2020 Costs Based on Current Prices Current Spot LME Price
RED DOG
Red Dog Extension Project
Long Life Asset
• Aktigiruq exploration target of 80-150 Mt
@ 16-18% Zn + Pb1
• Anarraaq Inferred Resource2: 19.4 Mt
@14.4% Zn, 4.2% Pb
Quality Project
• Premier zinc district
• Significant mineralized system
• High grade
Stable Jurisdiction
• Operating history
• ~12 km from Red Dog operations
108
Qanaiyaq
Aktigiruq
Anarraaq
Paalaaq
Su-Lik
Aqqaluk
Main
Looking Northwest
Endnotes: Zinc
Slide 94: Zinc Market
1. Source: Shanghai Metal Market.
2. Source: Based on information from the International Zinc Study Group Data.
Slide 95: Chinese Mine and Smelter Production
1. Source: Data compiled by Teck based on information from BGRIMM, CNIA, Antaike.
2. Source: Data compiled by Teck based on information from BGRIMM, CNIA, Antaike.
Slide 96: Global Mine Production Remains Under Pressure
1. Source: Data compiled by Teck based on information from BGRIMM, CNIA, Antaike. Early year estimates from consolidation of several analyst views in the year preceding.
2. Source: Data compiled by Teck based on information from BGRIMM, CNIA, Antaike.
3. Source: Data compiled by Teck based on information from BGRIMM, CNIA, Antaike., NBS.
Slide 97: Stocks Continue to Decrease While Refined Production Increases in China
1. Source: Data compiled by Teck Analysis based on information from SHFE, SMM,
2. Source: ”Smelter + consumer stocks” refers to zinc metal held in the plants of smelters and semi producers and those on the road; ”Bonded stocks” refers to zinc stored in bonded zones and will need to complete Customs clearance before
entering China; ”Domestic commercial stocks” refers to zinc stored in SHFE warehouses and other domestic commercial warehouses not registered in SHFE.
3. Source: Data compiled by Teck Analysis based on historic numbers from China Customs, and forecasts based on data from BGRIMM, Antaike and Teck’s commercial contacts.
Slide 98: Zinc Supply
1. Source: Data compiled by Teck based on information from Wood Mackenzie, BGRIMM, CNIA, Antaike and Teck analysis.
Slide 99: Zinc Concentrate Treatment Charges
1. Source: Wood Mackenzie.
Slide 100: Zinc Metal Stocks
1. Source: Data compiled by Teck from information from LME, SHFE, SMM.
2. Source: Data compiled by Teck from information from LME, Fastmarkets, Argus, Acuity, company reports.
Slide 101: Largest Global Net Zinc Mining Companies
1. Source: Data compiled by Teck from information from Wood Mackenzie – Company smelter production netted against company mine production on an equity basis.
Slide 104: Red Dog Sales Seasonality
1. Average sales from 2016 to 2020.
Slide 105: Red Dog Net Cash Unit Cost Seasonality
1. Average quarterly net cash unit cost in 2016 to 2020, before royalties. Based on Teck ‘s reported financials. Net cash unit cost is a non-GAAP financial measure. See “Non-GAAP Financial Measures” slides.
Slide 106: Zinc Unit Costs
1. Zinc unit costs are reported in US dollars per pound. Non-GAAP financial measures. See “Non-GAAP Financial Measures” slides.
Slide 107: Red Dog in Bottom Quartile of Zinc Cost Curves
1. Source: Data compiled by Teck from information from Wood Mackenzie, LME – Based on WM Forecast information and estimates for 2020 based on current short term average prices.
Slide 108: Red Dog Extension Project
1. Aktigiruq is an exploration target, not a resource. Refer to press release of September 18, 2017, available on SEDAR. Potential quantity and grade of this exploration target is conceptual in nature. There has been insufficient exploration to
define a mineral resource and it is uncertain if further exploration will result in the target being delineated as a mineral resource.
2. Based on Teck’s 2020 Annual Information Form.
109
Steelmaking Coal
Business Unit & Markets
Steelmaking Coal Facts
Global Coal Production1:
~7.4 billion tonnes
Steelmaking Coal Production2:
~1,130 million tonnes
Export Steelmaking Coal2:
~320 million tonnes
Seaborne Steelmaking Coal2:
~285 million tonnes
111
• ~0.7 tonnes of steelmaking coal is used to
produce each tonne of steel3
• Up to 100 tonnes of steelmaking coal is required
to produce the steel in the average wind turbine4
Our market is seaborne hard coking coal2: ~190 million tonnes
Steelmaking Coal Market
China ban of Australian coal pushing seaborne CFR China price higher
Near term outlook: An eventual end to “China
ban” would increase FOB Australia prices
• China: Q1 seaborne imports slumped due to the ban of
Australian coal (effective October 2020)
• Ex-China markets: Demand strong as steel prices
achieve record high; Q1 crude steel production up 10%,
hot metal production up 5.8% as blast furnaces restart
• Supply: Cost curve and supply response (COVID-19,
“China ban”, and mine disruptions) provide price support
Longer term outlook: Fundamentals remain
unchanged
• China: Declining domestic reserves and persistent
demand by coastal steel mills and new projects
• Ex-China markets: Mid-term demand boosted by
government stimulus and long-term growth supported
by Indian government targets, limited scrap supply and
continued urbanization
• Supply: Declining existing capacity and minimal project
pipeline (low investment and permitting challenges)
112
Strong coal fundamentals underpinned
by global economic recovery
Steelmaking Coal Prices1 (US$/t)
10-year average Seaborne FOB price of ~US$170/t,
or ~US$180/t on an inflation-adjusted basis
0
50
100
150
200
250
300
Chinese Domestic CFR Equivalent
CFR China
FOB Australia
Steelmaking Coal Demand Growth Forecast
Continued recovery with >80% banked blast furnaces restarted/announced restart
Seaborne Steelmaking Coal Imports1 (Mt)
Change 2021 vs. 2020
113
Includes:
• China: Impact of the ban on Australian coal
• Europe/JKT: Restarting banked furnaces
• India: Growing steel production (unchanged long-term
fundamentals)
• Brazil: Strong domestic demand (residential
construction, automotive) and export market
• SE Asia: Economic recovery (demand growth from
Vietnam)
290
297
11
6
4
2 2
20
260
270
280
290
300
2020 China Europe India JKT Brazil SE Asia 2021E
Indian Steelmaking Coal Imports
Mid- & long-term imports supported by secular demand and government targets
114
Indian Seaborne Coking Coal Imports2 (Mt)
Indian Crude Steel Production1 (Mt)
India 2021 crude steel production and seaborne coking coal imports have surpassed 2019 levels
0
20
40
60
80
100
120
0
10
20
30
40
50
60
70
Chinese Steelmaking Coal Imports – Australia Ban
Q1 2021 seaborne imports down by -13 Mt with ex-Australia up +2 Mt YoY
115
Chinese Coking Coal Imports2 (Mt)
Chinese Crude Steel Production (CSP), Hot Metal
Production (HMP) and Coal Production (Mt)1
Recovering China domestic and Mongolia imports in Q1 from low base in 2020
• +13Mt YoY for domestic coking coal production… safety inspections limit growth forward
• +3.4Mt YoY in Q1 for Mongolian coking coal imports… pandemic reduces April imports
0
100
200
300
400
500
600
0
200
400
600
800
1,000
1,200
CSP (LHS) HMP (LHS) Coking Coal Production (RHS)
35
60
48
35 36
44
37 41
48
28
19
16
15
13
24
26
28
34 24
30
0
10
20
30
40
50
60
70
80
Seaborne Coking Coal Imports Mongolian Coking Coal Imports
Chinese Steel Margins
Steel margins rebound on record high steel prices
China Hot Rolled Coil (HRC) Margins and Steelmaking Coal (HCC) Prices1 (US$/t)
116
0
200
400
600
800
1000
1200
2010 2012 2014 2016 2018 2020 2022 2024
Chinese Scrap Use Remains Low
Scrap supply limits EAF share in steel output
117
China’s scrap ratio lower than global average of 38%1
(2019)2
Crude Steel
Electric Arc Furnace
Hot Metal
China Steel Use By Sector
(2000-2020)3
2025 EAF share forecast to be similar to 20104
83%
69%
55%
42% 40% 34%
22%
0%
20%
40%
60%
80%
100%
Turkey USA EU Russia Korea Japan China
Construction
50-60%
Machinery
15-20%
Auto
5-10%
Others
15-25%
Steelmaking Coal Supply Growth Forecast
Supply is forecast to recover amid growing demand
Seaborne Steelmaking Coal Exports1 (Mt)
Change 2021 vs. 2020
118
Includes:
• USA: YTD exports down 17% on increased domestic
demand & mine disruptions
• Russia: Higher exports to China and potential mine
expansion projects
‒ Kolmar’s and Evraz’s existing mines, A-Property’s Elga
• Canada: Growth from existing mines
• Mozambique: Possible growth from Vale’s Moatize
• Indonesia: ramp-up from newly commissioned mines
‒ Adaro’s Lampunut or Cokal’s BBM
• Australia: Analyst views range from -7 Mt to +3 Mt2
281
291
5
5
2 1
0
284-294
4
2
260
270
280
290
300
2020 USA Russia Canada Indonesia Mozambique Supply
Others
2021, ex.
Aus
Australia 2021E
Australia and US Steelmaking Coal Exports
US coal producers are swing suppliers
119
US Exports2 (Mt)
Australian Exports1 (Mt)
0
20
40
60
80
100
120
140
160
180
200
0
10
20
30
40
50
60
70
Canadian & Mozambique Steelmaking Coal Exports
Canadian exports recovering with increased demand
120
Mozambique Exports2 (Mt)
Canadian Exports1 (Mt)
0
5
10
15
20
25
30
35
40
0
1
2
3
4
5
6
7
8
9
2nd Largest Seaborne Steelmaking Coal Supplier
Competitively positioned to supply steel producers worldwide
121
CHINA
2013: ~30%
2017: ~15%
2019: ~10%
2020: ~15%
INDIA
2013: ~5%
2017: ~10%
2019: ~15%
2020: ~15%
Sales Distribution
AMERICAS
~5%
EUROPE
2013: ~15%
2017: ~20%
2019: ~15%
2020: ~15%
ASIA EXCL. CHINA & INDIA
2013: ~40%
2017: ~45%
2019: ~55%
2020: ~50%
Targeting increased sales to China to capture current CFR China price premium
122
• 811 million tonnes1 of reserves
support 26 to 27 million tonnes
of long term annual production
• The Neptune Bulk Terminals
upgrade to secure >18.5 Mt
of exclusive port capacity
‒ Lower cost and more
reliable port access for
steelmaking coal
‒ Established infrastructure
and supply chain capacity
with mines and railways
• Geographically concentrated
in the Elk Valley, BC, Canada
• Stable long term strip ratio
High Quality Steelmaking Coal Business
Steelmaking Coal Business Operating Strategy
123
26 to 27 million tonnes of long term
annual production capacity
• Increase margins not volumes
• Maximize synergies in the
Elk Valley, BC, Canada
• Optimize supply chain
• Productivity focus
• Sustain strong cash flow
on a restructured cost base
Steelmaking Coal Unit Costs
124
Operating Cost1 Breakdown in 2020
Labour 34%
Contractors and Consultants 13%
Operating Supplies 16%
Repairs and Maintenance Parts 19%
Energy 14%
Other 4%
Total 100%
Transportation
29%
Depreciation
and
Amortization
24%
Operating Costs
47%
Unit Costs1 in 2020
Setting Up for Strong Long-Term
Cash Flows in Steelmaking Coal
125
Executing on four pillars to transform cost
structure and optimize margins
1. Decline in strip ratio
2. Strategically replaced high-cost tonnes with
low-cost tonnes
3. RACE21TM transformation
‒ Lowering operating costs and increasing
EBITDA1 potential
4. Neptune capacity increase and third party logistics
contracts
‒ Lowering port costs, increase logistics chain
flexibility and improved reliability
82%
90%
92%
99%
101% 100%
103% 102%
105%
80%
85%
90%
95%
100%
105%
110%
2012 2013 2014 2015 2016 2017 2018 2019 2020
126
Truck Productivity4 (SHM%)
RACE21™ innovation-driven business
transformation
• Record 2020 haul truck productivity improvement
• Advanced plant analytics
• Autonomous haulage strategy
‒ Substantial completion of the autonomous
haulage pilot at Elkview Operations by year end
Mid-Point
2021 Production
Guidance2
Change Estimated Effect
on Annualized
Profit3
Estimated Effect
on Annualized
EBITDA3
Coal 26.0 Mt US$50/t C$950M C$1,500M
Strong cash flow generation1
Steelmaking Coal Continues To Deliver
Strong Returns
Sustain Production Capacity and Productivities
In Steelmaking Coal
Maintaining historical dollar per tonne
sustaining investment levels
2010-2016: Average spend of ~$11 per tonne1
• Swift at Fording River and Line Creek
• Reinvestment in 5 shovels, 50+ haul trucks
2017-2024: Average spend of ~$11-13 per tonne1
• Plant expansion at Elkview, mine life extension
projects and Neptune sustaining investments
• Reinvestment in equipment fleets and
infrastructure to increase mining productivity
and processing efficiencies
127
Sustaining capital is now inclusive of production capacity investments previously called Major Enhancement.
Sustaining Capital, Excluding Water Treatment1 ($/t)
Long term run rate for sustaining capital is ~$11-13 per tonne
SALES MIX
• ~40% quarterly contract price
• ~60% shorter than quarterly pricing mechanisms
(including “spot”)
PRODUCT MIX
• ~75% of production is high-quality HCC
• ~25% is a combination of SHCC, SSCC, PCI
• Varies quarter-to-quarter based on the mine plans
KEY FACTORS IMPACTING TECK’S AVERAGE
REALIZED PRICES
• Variations in our product mix
• Timing of sales
• Direction and underlying volatility of the daily price
assessments
• Spreads between various qualities of steelmaking coal
• Arbitrage between FOB Australia and CFR China pricing
Teck’s Steelmaking Coal Pricing Mechanisms
Sales book generally moves with the market
128
Quality and Basis Spreads
Impact on Teck’s average realized steelmaking coal prices
HCC Seaborne / China Domestic
Prices and Spread2 (US$/t)
HCC / SHCC Prices and Spread1 (US$/t)
129
0
25
50
75
100
0
50
100
150
200
250
300
350
Jun-16
Sep-16
Dec-16
Mar-17
Jun-17
Sep-17
Dec-17
Mar-18
Jun-18
Sep-18
Dec-18
Mar-19
Jun-19
Sep-19
Dec-19
Mar-20
Jun-20
Sep-20
Dec-20
Mar-21
HCC (LHS)
SHCC (LHS)
HCC / SHCC spread (RHS)
(100)
(80)
(60)
(40)
(20)
0
20
40
60
80
100
120
0
50
100
150
200
250
300
350
Jun-16
Sep-16
Dec-16
Mar-17
Jun-17
Sep-17
Dec-17
Mar-18
Jun-18
Sep-18
Dec-18
Mar-19
Jun-19
Sep-19
Dec-19
Mar-20
Jun-20
Sep-20
Dec-20
Mar-21
Seaborne HCC CFR China (LHS)
Domestic HCC CFR China (LHS)
Seaborne / Domestic spread (RHS)
West Coast Port Capacity
130
• Current capacity 35 Mtpa
• Teck contracted capacity, following expiry of our
current contract on March 31, 2021:
‒ 2021: 12.55-13.55 Mt, including ~5 Mt in Q1 2021
‒ From 2022: 5-7 Mtpa at fixed loading charges
‒ Total of 33 Mt over agreement term
WESTSHORE TERMINALS
• Current capacity 18 Mtpa
• Teck contract:
‒ January 2021 to December 2027
‒ Ramps up to 6 Mtpa over 2021
RIDLEY TERMINALS
Teck’s Contracted West Coast
Port Capacity (Nominal Mt)
Westshore Terminals
Neptune Coal Terminal
Ridley Terminals
6
5-7
>18.5
• World class design and equipment for enhanced reliability
• Capacity growth to >18.5 Mtpa
• ~$150M infrastructure investment in upstream
supply chain
• 100% ownership of coal capacity
NEPTUNE COAL TERMINAL
131
In the commissioning phase
• Ramp-up is continuing as planned
• Equipment performing according to, or better than, plan
• First steelmaking coal unloaded using the new
double rail car dumper on April 19th, 2021
• 18 vessels have been loaded with the new shiploader
to date
• Upstream rail infrastructure improvement to support
increased volumes are largely complete
Neptune Port Upgrade Update
Neptune secures a long-term, low-cost and reliable steelmaking coal supply chain
Photo: Lowering of shell for Ball Mill #3.
Endnotes: Steelmaking Coal
Slide 111: Steelmaking Coal Facts
1. Source: IEA.
2. Source: Wood Mackenzie (Long Term Outlook H2 2020).
3. Source: World Coal Association. Assumes all of the steel required is produced by blast furnace-basic oxygen furnace route.
4. Source: The Coal Alliance. Assumes all of the steel required is produced by blast furnace-basic oxygen furnace route.
Slide 112: Steelmaking Coal Market
1. Ten-year steelmaking coal prices are calculated from January 1, 2011. Inflation-adjusted prices are based on Statistics Canada’s Consumer Price Index. Source: Argus, Teck. As at May 13, 2021.
Slide 113: Steelmaking Coal Demand Growth Forecast
1. Source: Data compiled by Teck based on information from Wood Mackenzie (Short Term Outlook March 2021).
2. Source: Data compiled by Teck based on information from (Metallurgical Coal Market Outlook March 2021)
Slide 114: Indian Steelmaking Coal Imports
1. Source: Data compiled by Teck based on information from WSA and CRU (Crude Steel Market Outlook March 2021).
2. Source: Data compiled by Teck based on information from Global Trade Atlas and CRU (Metallurgical Coal Market Outlook March 2021). 2020 and 2021 are based on information from CRU.
Slide 115: Chinese Steelmaking Coal Imports – Australian Ban
1. Source: Data compiled by Teck based on information from NBS and Fenwei. 2021 is Q1 annualized for crude steel production and hot metal production and Fenwei estimate for coking coal production.
2. Source: Data compiled by Teck based on information from China Customs and Wood Mackenzie (Short Term Outlook January 2021). 2021 is based on information from Wood Mackenzie.
Slide 116: Chinese Steel Margins
1. Source: China HRC Gross Margins is estimated by Mysteel. China Domestic HCC Price is Liulin #4 price sourced from Sxcoal and is normalized to CFR China equivalent. Seaborne HCC Price (CFR China) is based on Argus Premium HCC
CFR China. Plotted to April 16, 2021.
Slide 117: Chinese Scrap Use Remains Low
1. Source: Bureau of International Recycling, BIR Global Facts and Figures, 11th Edition.
2. Source: Data compiled by Teck based on information from Bureau of International Recycling.
3. Source: Data compiled by Teck based on information from China Metallurgy Industry Planning and Research Institute.
4. Source: Data compiled by Teck based on information from Wood Mackenzie (Long Term Outlook H2 2020) and CRU (Crude Steel Market Outlook April 2021).
Slide 118: Steelmaking Coal Supply Growth Forecast
1. Source: Data compiled by Teck based on information from Wood Mackenzie (Short Term Outlook March 2021).
Slide 119: Australia and US Steelmaking Coal Exports
1. Source: Data compiled by Teck based on information from Global Trade Atlas, Wood Mackenzie (Short Term Outlook March 2021), and CRU (Metallurgical Coal Market Outlook April 2021).
2. Source: Data compiled by Teck based on information from Global Trade Atlas and Wood Mackenzie (Short Term Outlook March 2021).
Slide 120: Canadian & Mozambique Steelmaking Coal Exports
1. Source: Data compiled by Teck based on information from Global Trade Atlas, Wood Mackenzie (Short Term Outlook March 2021).
2. Source: Data complied by Teck based on information from Wood Makenzie. 2010-2020 are based on information from Wood Mackenzie (Long Term Outlook H2 2020). 2021 is based on information from Wood Mackenzie (Short Term Outlook
March 2021).
132
Endnotes: Steelmaking Coal
Slide 122: High Quality Steelmaking Coal Business
1. As at December 31, 2020, Teck portion, excluding oxide. Based on Teck’s 2020 Annual Information Form.
Slide 124: Steelmaking Coal Unit Costs
1. Steelmaking coal unit costs are reported in Canadian dollars per tonne. Non-GAAP financial measures. See “Non-GAAP Financial Measures” slides.
Slide 125: Setting Up for Strong Long-Term Cash Flows in Steelmaking Coal
1. EBITDA is a non-GAAP financial measure. See “Non-GAAP Financial Measures” slides.
Slide 126: Steelmaking Coal Continues to Deliver Strong Returns
1. As at February 17, 2021. The sensitivity of our annual profit attributable to shareholders and EBITDA to changes in the Canadian/U.S. dollar exchange rate and commodity prices, before pricing adjustments, based on our current balance sheet,
our 2021 mid-range production estimates, current commodity prices and a Canadian/U.S. dollar exchange rate of $1.30. See Teck’s Q1 2021 press release for further details.
2. All production estimates are subject to change based on market and operating conditions.
3. The effect on our profit attributable to shareholders and on EBITDA of commodity price and exchange rate movements will vary from quarter to quarter depending on sales volumes. Our estimate of the sensitivity of profit and EBITDA to changes
in the U.S. dollar exchange rate is sensitive to commodity price assumptions. EBITDA is a non-GAAP financial measure. See “Non-GAAP Financial Measures” slides.
4. Productivity reflects performance of Teck’s waste haul truck fleet against an internal baseline standard haulage model (SHM) that anticipates an expected rate of material movement per equipment operating hour taking into account size of truck
fleet, haul distance, grade and other road design elements.
Slide 127: Sustain Production Capacity and Productivities in Steelmaking Coal
1. Historical spend has not been adjusted for inflation or foreign exchange. 2021-2025 average spend assumes annualized average production of 27 million tonnes. All dollars referenced are Teck’s portion net of POSCAN credits for Greenhills
Operations at 80% and excludes the portion of sustaining capital relating to water treatment. Sustaining capital is now inclusive of production capacity investments previous called Major Enhancement. Excludes capital leases and growth capital.
Slide 128: Quality and Basis Spreads
1. HCC price is average of the Argus Premium HCC Low Vol, Platts Premium Low Vol and TSI Premium Coking Coal assessments, all FOB Australia and in US dollars. SHCC price is average of the Platts HCC 64 Mid Vol and TSI HCC
assessments, all FOB Australia and in US dollars. Source: Argus, Platts, TSI. Plotted to April 20, 2021.
2. Seaborne HCC CFR China price is average of the Argus Premium HCC Low Vol, Platts Premium Low Vol and TSI Premium Coking Coal assessments, all CFR China and in US dollars. Domestic HCC CFR China is Liulin #4 normalized to CFR
Jingtang Port in US dollars. Source: Argus, Platts, TSI, Sxcoal. Plotted to April 16, 2021.
133
Steelmaking Coal
Resilience
Steel is Essential for Economic Growth
In a Low-Carbon World
135
World’s largest metal
market today
Enables low-carbon
energy system
Suited for a circular
economy
Essential to lifting
global living standards
Steel is widely used and hard
to substitute
Growth continues to be driven
by decarbonization and
ongoing economic development
Fundamental to renewable
energy transition and
1.5°C target of Paris Accord
Steelmaking coal required
while alternatives evolve and
carbon abatement policy
advances
Easily recyclable (e.g., without
alloy issue of aluminum)
80%+ recycle rate of steel
scrap in developed economies2
Middle class expected to grow
by 2-3 billion people by 2050,
mostly in India and
South-East Asia (SEA)
Rural communities are moving
to cities, driving infrastructure
build
~25%
Lower CO2 footprint in steel
relative to cement1
>90%
Lower CO2 footprint of recycled
steel compared to new steel1
~165%
Increase in combined annual
demand growth for India and
SEA3 between 2019 and 2050
1,800
90 25
Steel Aluminum Copper
Global Production in 2019 (Mt)
All Steelmaking Technologies Play a Role
In Decarbonization
136
Scrap
Currently accounts for ~30% of global crude steel production, and while expected to grow,
availability will be limited in new growth regions
Natural Gas Direct Reduced Iron (DRI) + CCUS via Electric Arc Furnace (EAF)
Effective where there is low-cost & abundant natural gas (Americas, MENA1 and parts of Asia)
Blast Furnace + CCUS
Proven technology with favorable economics, and the best combination of speed and scale
for decarbonization
H2-Direct Reduced Iron (H2-DRI) via EAF
Expected to increase with technology development, and in regions with steady scrap supply,
cheap renewable power, and near end-of-life blast furnaces (e.g., Europe)
Blast Furnace + CCUS Will Lead
Large-Scale Decarbonization Adoption
137
Blast Furnace + CCUS adoption will lead through 20502
Blast Furnace + CCUS is adoption ready
Blast Furnace + CCUS is highly cost competitive
• Leverages >US$1 trillion of existing installed blast furnace fleet
• Ample global CCUS storage capacity of ~5 trillion tonnes CO2
1
Proven technology in hard-to-abate industries
• CCUS operates in power generation, refining, petrochemicals,
agrichemicals, and steel/iron industry
Accelerators to adoption
• Large-scale hub and cluster transportation and sequestration
infrastructure will support economies of scale
Fastest path to large-scale decarbonization
• Effective decarbonization of 80% of steel emissions
• Requires CO2 pricing to be > US$50/t CO2, and CO2 abatement
cost of US$50-100/t CO2
• Cost reductions with generational learning
2019 2050
2030 2040
NG-DRI + CCUS
100%
Scrap
BF + CCUS
H2-DRI
NG-DRI
BF
2.0 2.3
Total Steel Demand (Bt)
2.3 2.4
Blast Furnace + CCUS is the Most Cost Competitive
Decarbonization Technology Through 2050
138
Blast Furnace + CCUS is the only technology
that can be adopted with speed and scale
To produce hydrogen at a cost of US$1-2/kg for
scalable H2-DRI adoption requires:
Stable supply of renewable power <US$1.5c/KWh
• Significant investment in large-scale renewable infrastructure
development that does not exist today
• ~60% lower wind and solar costs
Low-cost, highly-efficient electrolyzers
• Decline in electrolyzer capex by ~80%
• High-capacity scale-up and utilization rates
• Sufficient H2 storage capacity to allow stable and
continuous supply
High-grade iron ore pellet availability
• Availability constraints on high-grade iron-ore pellets suitable
for DRI will limit H2-DRI adoption beyond 2030
1. Source: Teck. Production cost includes transportation and storage cost.
2. LCOE based on Solar PV.
3.2 2.1 1.4 1.1
Levelized Cost of Energy2 – China (US$c/kWh)
Total Cost of Ownership1 (US$/t liquid steel)
China (SDS – 1.7o scenario)
Brownfield BF + CCUS
750
800
2030
2020 2025 2035 2040 2045 2050
0
400
450
500
550
600
650
700
H2-DRI
Greenfield BF + CCUS
CCUS retrofit of brownfield blast furnaces
(Brownfield BF + CCUS) remains most competitive
Greenfield H2-Direct Reduced Iron
(H2-DRI) becomes more competitive
than Greenfield BF + CCUS after ~2040
Long-Term Demand for Steelmaking Coal
Is Expected to Decline…
139
Steelmaking Coal Demand1 (Mtpa)
• Seaborne HCC demand expected to
remain resilient due to steel demand
growth in regions that rely on lower-cost
seaborne hard coking coal (HCC) imports
(e.g., India and South-East Asia) for blast
furnace steelmaking
• Increased global scrap recycling
expected to reduce overall steelmaking
coal demand, with limited impact on
seaborne HCC
⎻ India and South-East Asia have little
scrap availability, and scrap use in
China is expected to reduce domestic
supply
185 240 200
820 770
380
2019 2030 2050
Seaborne HCC
Other
Steelmaking
Coal2
The magnitude
of steelmaking coal
demand will
ultimately be driven
by the pace of
decarbonization
…But Long-Term Demand for Seaborne Hard Coking
Coal Will Remain Robust
140
• Natural gas and H2-DRI expected to displace
some coking coal demand, but mainly after
2040
• Efficiency gains at blast furnaces are
expected to erode some coking coal demand
• Demand for premium hard coking coal
such as Teck’s product is expected to
remain resilient as it improves blast furnace
efficiency and lowers emissions
Seaborne
steelmaking coal
demand will benefit
from strong growth
in major importing
regions where blast
furnace steelmaking
will dominate
South-East Asia
2019 2030
India
Developed Asia
2050
China
Rest of World
185
240
200
Seaborne Steelmaking Coal Demand1 (Mtpa)
Teck’s Seaborne Steelmaking Coal Is Optimally
Positioned For a Decarbonizing Future
141
Highest quality HCC leading to
lowest CO2 emissions in
steelmaking
Teck’s HCC has amongst lowest
Scope 1 and Scope 2 emissions
relative to peers
Globally advantaged seaborne
logistics and cost position
• Teck’s emissions intensity is within the
lowest of the commodity range,
assisted by access to low carbon
sources of electricity in B.C.
• Teck mines will be even more cost
competitive with rising CO2 prices
globally
CO2 Coal Intensity Curve1
(t CO2e/t saleable coal)
• Teck HCC is amongst the highest
quality in the world
• Teck’s premium hard coking coal
improves blast furnace efficiency
and decreases CO2 emissions per
tonne of steel
• Proximity to the Pacific Ocean gives
direct access to Asia
• By 2050, forecast cost position in the
1st-2nd quartile due to scarce new projects
and high-cost for domestic suppliers
switching to export
150 300
50 200 250
100
Simplified 2030 Seaborne HCC
Supply Curve2
Cumulative production (Mt)
Teck
0
Cumulative production (Mt)
150
50 200 250
100
Low
Phosphorus
Teck
Future High
Strength
Low
Sulphur
Low
Ash
Teck’s High Quality Seaborne Steelmaking Coal Will
Continue To Be A Key Resource In The Low-Carbon Transition
142
Blast Furnace + Carbon
Capture, Utilization and
Storage (CCUS) is the
most cost competitive and
commercially viable solution
for large-scale adoption
Leverages sunk cost of more
than US$1 trillion of young blast
furnaces, which will last well into
the second half of this century
Unlike other technologies, Blast
Furnace + CCUS is commercially
and technologically ready for
near-term adoption
Global steel industry emits
7-10% of total greenhouse
gas emissions
Meeting the objective of the
Paris Accord will rely on a range
of steelmaking abatement
technologies
Together they can reduce
steelmaking emissions by
more than 80% by 2050
Blast Furnace + CCUS is the
only abatement technology
capable of decarbonizing
the steelmaking industry
at the rate and scale
required by 2050
70% of the world’s steelmaking
today uses blast furnaces
Blast Furnace + CCUS will lead
large-scale steelmaking
decarbonization through 2050
Blast Furnace + CCUS
steelmaking will drive
continued demand for
Teck’s high quality seaborne
hard coking coal
Teck’s high quality seaborne
steelmaking coal will benefit from
demand growth in the major
importing regions of India and
South-East Asia where blast
furnace steelmaking will dominate
Endnotes: Steelmaking Coal Resilience
Slide 135: Steel is Essential for Economic Growth In a Low-Carbon World
1. Source: Teck.
2. Source: WSA, IEA.
3. India (from ~100 Mt in 2019 to 300 Mt in 2050) and South-East Asia (from ~100 Mt in 2019 to ~230 Mt in 2050) IEA SDS Scenario assumptions on CO2 pricing (~US$0/t CO2 in 2020 to ~US$160/t in 2050).
Slide 136: All Steelmaking Technologies Play a Role In Decarbonization
1. Middle East and North Africa.
2. Under the IEA Sustainable Development Scenario (SDS) +1.7°C.
Slide 137: Blast Furnace + CCUS Will Lead Large-Scale Decarbonization Adoption
1. Global CCUS Institute estimates.
2. Under the IEA Sustainable Development Scenario (SDS) +1.7°C.
Slide 138: Blast Furnace + CCUS is the Most Cost Competitive Decarbonization Technology Through 2050
1. IEA forecast and internal analysis, Sustainable Development Scenario (SDS) +1.7°C.
Slide 140: …But Long-Term Demand for Seaborne Hard Coking Coal Will Remain Robust
1. Comprised of landborne hard coking coal and global semi-soft coking coal.
Slide 141: Teck’s Seaborne Steelmaking Coal Is Optimally Positioned For a Decarbonizing Future
1. Source: Skarn Associates, 2019.
2. 2050 HCC operating cost, including royalty and price differential, $/t, FOB, real 2020$), MineSpans, 2021.
143
Energy
Business Unit & Markets
Energy Benchmark Pricing
Calendar NYMEX WTI Price1 , WTI/WCS Basis Differential at Hardisty2
and WTI/WCS Basis Differential at the US Gulf Coast3 (US$/bbl)
145
(10)
-
10
20
30
40
50
60
70
80
(10)
0
10
20
30
40
50
60
70
80
Jan-17 May-17 Sep-17 Jan-18 May-18 Sep-18 Jan-19 May-19 Sep-19 Jan-20 May-20 Sep-20 Jan-21 May-21
Calendar NYMEX WTI Price WTI/WCS Basis Differential at Hardisty WTI/WCS Basis Differential at the USGC
Production @ 100%
(kbpd)
Fort Hills is A Modern Oil Sands Mine
146
De-bottleneck potential
Best monthly
production rate
(201 kbpd)
• Higher quality, partially de-carbonized Paraffinic
Froth Treatment (PFT) product = lower
greenhouse gas (GHG) emissions
• Starting to ramp-up production in June, with full
production rates1 expected in Q4 2021
• Government of Alberta production limits relaxed
in Q4 20202
• Focused on operational excellence to reduce
operating costs and capital efficiency
Temporarily reduced
production due to
COVID-19 and low
WCS prices
Fort Hills is a quality asset with significant upside potential
0
50
100
150
200
250
Q1 Q2 Q3 Q4 Q1 Q2 Q3 Q4 Q1 Q2 Q3 Q4 Q1
2018 2019 2020 2021
Start-up Curtailed
147
0
20
40
60
80
Yale’s Environmental Performance Index
Of Top 10 Oil Reserve Countries
World Oil Producers
Ranked By Corruption and Volume1
Canada is a Leader in ESG
The world benefits from Canada’s sustainable production during transition to renewables
Canada should be a supplier of choice
Best In Class Low Carbon Intensity Production
Our Fort Hills blend can displace carbon intensive crudes
148
• Emissions intensity of Canadian oil sands
has declined by 25%; estimated reduction
of 15% to 20% by 2030
• PFT bitumen emissions from mining
significantly lower than others
• Fort Hills PFT currently the new bar
for low emissions
• Fort Hills will displace barrels of crude
from higher emitters
Source: Bloomberg, BMO Capital Markets
Total Life Cycle Emissions Intensity
(kg CO2e/bbl refined product – gasoline/diesel)
Lower carbon intensity than 50% of the US refined barrels of oil
Continuous Improvement in Emissions Intensity
Fort Hills emissions performance has been outstanding to date
149
• Recent analysis by IHS Markit shows
15% improvement in emissions intensity
of mined dilbit PFT in 2018
- Includes emissions during Fort Hills
ramp-up to full production where
emissions are typically higher
- Fort Hills total life cycle emissions
1.6% lower than the average crude oil
refined in the US
• Fort Hills performance in 2019 was
13% better than 2018 despite Alberta
Government curtailment
Fort Hills emissions are decreasing year-over-year
Fort Hills GHG Emissions
Emissions Boundaries
150
Well to Wheels
Upstream (Direct) Emissions
Source: IHS Markit, Teck.
Downstream (Indirect) Emissions
Fort Hills Blend Widely Accepted In Market
A preferred feedstock and supplier of choice
We produce a high quality refinery feedstock
• Low GHG intensity: <50% of US crude supply
• Including in-situ and upgraded synthetic
Our sales mix provides diverse market access
• Pipeline connected with rail loading as needed
• Hardisty and US Gulf Coast core markets
151
8.0
28.5 Hardisty/US Gulf Coast Monthly Sales
Hardisty: Term Contracts
Teck Blend:
36.5 kbpd
Teck’s Expected Commercial Activities In 2021
Bitumen production 28.0 kbpd1
+ Diluent acquisition 8.5 kbpd
= Bitumen blend sales 36.5 kbpd
Teck’s Delivery Location (kbpd)
We are well positioned for future opportunities
Sufficient Pipeline Capacity as of 2022/2023
Narrow differentials expected with incremental export capacity
152
3
4
5
6
2019 2020 2021 2022 2023 2024 2025
Total Available Supply
Current Market
Access
Pipe Optimization
Enbridge Line 3
TransMountain TMX
Rail
Near term:
• Rail shipments reduced in 2020 on
shut-in production, higher in 2021
Pipeline development progressing:
• Enbridge: 370 kbpd (Q4 2021)
• TMX: 600 kbpd (Q4 2022)
Longer term:
• Global heavy refining capacity increase
• US, India and China largest heavy importers
Western Canada Crude Oil
Takeaway Capacity1
Endnotes: Energy
Slide 145: Energy Benchmark Pricing
1. The WTI CMA is an average of the daily settle quoted price for WTI prices for future deliveries for the trading days during a calendar month. Source: CME Group. As at April 28, 2021.
2. WCS at Hardisty: an index value determined during the trading period, which is typically the first 9 to 11 business days of the month prior to the month of delivery and does not include trades done after this trading period or during the month of
delivery. Sources: Net Energy and CalRock. As at April 28, 2021.
3. Source: Link, PVM and Platts. A simple average of Link brokerage, PVM and Platts assessments for the month of delivery during the trading period, which is typically the 25th of two months prior to the month of delivery to the 25th of the month
prior to the month of delivery. As April 28, 2021.
Slide 146: Fort Hills is a Modern Oil Sands Mine
1. Full production rates in Q4 2021 refers to 175,000 – 185,000 barrels per day
2. On, October 23, 2020, the Government of Alberta announced that it will not issue monthly production limits effective December 2020 production month. Since December 2020, operators will be able to produce above their previously issued
production limits without having to purchase curtailment credits or apply for Special Production Allowances. The curtailment rules have been extended to December 31, 2021, however, the Government of Alberta, will only issue Ministerial
Orders to limit production when they feel it is needed. If required, Ministerial Orders will be issued with 30-60 days’ notice to allow time for curtailed producers to respond and plan accordingly. The Fort Hills Partners continue to monitor the
business environment and assess plans to maximize cash flow, including the potential to increase production.
Slide 147: Canada is a Leader in ESG
1. Source: Transparency International Corruption Perceptions Index 2017 (y-axis). BP Statistical Review 2017 (x-axis).
Slide 148: Best in Class Low Carbon Intensity Production
1. Bitumen production assumes the mid-point of our 2021 production guidance range.
Slide 152: Sufficient Pipeline Capacity as of 2022/2023
1. Source: IHSMarkit, Teck.
153
Non-GAAP
Financial Measures
Non-GAAP Financial Measures
155
Our financial results are prepared in accordance with International Financial Reporting Standards (IFRS) as issued by the International Accounting Standards Board. This document refers to a number of Non-GAAP Financial
Measures which are not measures recognized under IFRS and do not have a standardized meaning prescribed by IFRS or Generally Accepted Accounting Principles (GAAP) in the United States.
The Non-GAAP Measures described below do not have standardized meanings under IFRS, may differ from those used by other issuers, and may not be comparable to such measures as reported by others. These measures have
been derived from our financial statements and applied on a consistent basis as appropriate. We disclose these measures because we believe they assist readers in understanding the results of our operations and financial position
and are meant to provide further information about our financial results to investors. These measures should not be considered in isolation or used in substitute for other measures of performance prepared in accordance with IFRS.
Adjusted profit attributable to shareholders – For adjusted profit, we adjust profit attributable to shareholders as reported to remove the after-tax effect of certain types of transactions that reflect measurement changes on our
balance sheet or are not indicative of our normal operating activities. We believe adjusted profit helps us and readers better understand the results of our core operating activities and the ongoing cash generating potential of our
business.
Adjusted basic earnings per share – Adjusted basic earnings per share is adjusted profit divided by average number of shares outstanding in the period.
Adjusted diluted earnings per share – Adjusted diluted earnings per share is adjusted profit divided by average number of fully diluted shares in a period.
EBITDA – EBITDA is profit before net finance expense, provision for income taxes, and depreciation and amortization.
Adjusted EBITDA – Adjusted EBITDA is EBITDA before the pre-tax effect of the adjustments that we make to adjusted profit attributable to shareholders as described above.
The adjustments described above to profit attributable to shareholders and EBITDA highlight items and allow us and readers to analyze the rest of our results more clearly. We believe that disclosing these measures assists readers
in understanding the ongoing cash generating potential of our business in order to provide liquidity to fund working capital needs, service outstanding debt, fund future capital expenditures and investment opportunities, and pay
dividends.
Gross profit before depreciation and amortization – Gross profit before depreciation and amortization is gross profit with the depreciation and amortization expense added back. We believe this measure assists us and readers to
assess our ability to generate cash flow from our business units or operations.
Gross profit margins before depreciation – Gross profit margins before depreciation are gross profit before depreciation and amortization, divided by revenue for each respective business unit. We believe this measure assists us
and readers to compare margins on a percentage basis among our business units.
Unit costs – Unit costs for our steelmaking coal operations are total cost of goods sold, divided by tonnes sold in the period, excluding depreciation and amortization charges. We include this information as it is frequently requested
by investors and investment analysts who use it to assess our cost structure and margins and compare it to similar information provided by many companies in the industry.
Adjusted site cash cost of sales – Adjusted site cash cost of sales for our steelmaking coal operations is defined as the cost of the product as it leaves the mine excluding depreciation and amortization charges, out-bound
transportation costs and any one-time collective agreement charges and inventory write-down provisions.
Total cash unit costs – Total cash unit costs for our copper and zinc operations includes adjusted cash costs of sales, as described above, plus the smelter and refining charges added back in determining adjusted revenue. This
presentation allows a comparison of total cash unit costs, including smelter charges, to the underlying price of copper or zinc in order to assess the margin for the mine on a per unit basis.
Net cash unit costs – Net cash unit costs of principal product, after deducting co-product and by-product margins, are also a common industry measure. By deducting the co- and by-product margin per unit of the principal product,
the margin for the mine on a per unit basis may be presented in a single metric for comparison to other operations. Readers should be aware that this metric, by excluding certain items and reclassifying cost and revenue items,
distorts our actual production costs as determined under IFRS.
Adjusted cash cost of sales – Adjusted cash cost of sales for our copper and zinc operations is defined as the cost of the product delivered to the port of shipment, excluding depreciation and amortization charges, any one-
time collective agreement charges or inventory write-down provisions and by-product cost of sales. It is common practice in the industry to exclude depreciation and amortization as these costs are non-cash and discounted cash
flow valuation models used in the industry substitute expectations of future capital spending for these amounts.
Adjusted operating costs – Adjusted operating costs for our energy business unit is defined as the costs of product as it leaves the mine, excluding depreciation and amortization charges, cost of diluent for blending to transport
our bitumen by pipeline, cost of non-proprietary product purchased and transportation costs of our product and non-proprietary product and any one-time collective agreement charges or inventory write-down provisions.
Non-GAAP Financial Measures
156
Cash margins for by-products – Cash margins for by-products is revenue from by- and co-products, less any associated cost of sales of the by and co-product. In addition, for our copper operations, by-product cost of sales also
includes cost recoveries associated with our streaming transactions.
Adjusted revenue – Adjusted revenue for our copper and zinc operations excludes the revenue from co-products and by-products, but adds back the processing and refining charges to arrive at the value of the underlying payable
pounds of copper and zinc. Readers may compare this on a per unit basis with the price of copper and zinc on the LME.
Adjusted revenue for our energy business unit excludes the cost of diluent for blending and non-proprietary product revenues, but adds back crown royalties to arrive at the value of the underlying bitumen.
Blended bitumen revenue – Blended bitumen revenue is revenue as reported for our energy business unit, but excludes non-proprietary product revenue, and adds back crown royalties that are deducted from revenue.
Blended bitumen price realized – Blended bitumen price realized is blended bitumen revenue divided by blended bitumen barrels sold in the period.
Operating netback – Operating netbacks per barrel in our energy business unit are calculated as blended bitumen sales revenue net of diluent expenses (also referred to as bitumen price realized), less crown royalties,
transportation and operating expenses divided by barrels of bitumen sold. We include this information as investors and investment analysts use it to measure our profitability on a per barrel basis and compare it to similar information
provided by other companies in the oil sands industry.
The debt-related measures outlined below are disclosed as we believe they provide readers with information that allows them to assess our credit capacity and the ability to meet our short and long-term financial obligations.
Net debt – Net debt is total debt, less cash and cash equivalents.
Debt to debt-plus-equity ratio – debt to debt-plus-equity ratio takes total debt as reported and divides that by the sum of total debt plus total equity, expressed as a percentage.
Net debt to net debt-plus-equity ratio – net debt to net debt-plus-equity ratio is net debt divided by the sum of net debt plus total equity, expressed as a percentage.
Debt to Adjusted EBITDA ratio – debt to adjusted EBITDA ratio takes total debt as reported and divides that by adjusted EBITDA for the twelve months ended at the reporting period, expressed as the number of times adjusted
EBITDA needs to be earned to repay all of the outstanding debt.
Net debt to Adjusted EBITDA ratio – net debt to adjusted EBITDA ratio is the same calculation as the debt to adjusted EBITDA ratio, but using net debt as the numerator.
Net debt to capitalization ratio – net debt to capitalization ratio is net debt divided by the sum of total debt plus equity attributable to shareholders. The ratio is a financial covenant under our revolving credit facility.
Non-GAAP Financial Measures
157
Reconciliation of Profit (Loss) and Adjusted Profit
(C$ in millions)
Three months ended
March 31, 2021
Three months ended
March 31, 2020
Profit (loss) attributable to shareholders $ 305 $ (312)
Add (deduct) on an after-tax basis:
Asset impairments - 474
COVID-19 costs - 22
Environmental costs (33) (87)
Inventory write-downs (reversals) (6) 27
Share-based compensation 10 (22)
Commodity derivative losses 15 15
Taxes and other 35 (23)
Adjusted profit attributable to shareholders $ 326 $ 94
Adjusted basic earnings per share $ 0.61 $ 0.17
Adjusted diluted earnings per share $ 0.61 $ 0.17
Non-GAAP Financial Measures
158
(Per share amounts)
Three months ended
March 31, 2021
Three months ended
March 31, 2020
Basic earnings (loss) per share $ 0.57 $ (0.57)
Add (deduct):
Asset impairments - 0.87
COVID-19 costs - 0.04
Environmental costs (0.06) (0.16)
Inventory write-downs (reversals) (0.01) 0.05
Share-based compensation 0.02 (0.04)
Commodity derivative losses 0.03 0.03
Other 0.06 (0.05)
Adjusted basic earnings per share $ 0.61 $ 0.17
Reconciliation of Basic Earnings (Loss) Per Share to Adjusted Basic Earnings (Loss) Per Share
Non-GAAP Financial Measures
159
(Per share amounts)
Three months ended
March 31, 2021
Three months ended
March 31, 2020
Diluted earnings (loss) per share $ 0.57 $ (0.57)
Add (deduct):
Asset impairments - 0.87
COVID-19 costs - 0.04
Environmental costs (0.06) (0.16)
Inventory write-downs (reversals) (0.01) 0.05
Share-based compensation 0.02 (0.04)
Commodity derivative losses 0.03 0.03
Other 0.06 (0.05)
Adjusted diluted earnings per share $ 0.61 $ 0.17
Reconciliation of Diluted Earnings (Loss) Per Share to Adjusted Diluted Earnings Per Share
(C$ in millions)
(A)
Twelve months ended
December 31, 2020
(B)
Three months ended
March 31, 2020
(C)
Three months ended
March 31, 2021
(A-B+C)
Twelve months ended
March 31, 2021
Profit (loss) $ (944) $ (311) $ 292 $ (341)
Finance expense net of finance income 268 47 51 272
Provision for (recovery of) income taxes (192) (69) 209 86
Depreciation and amortization 1,510 378 378 1,510
EBITDA $ 642 $ 45 $ 930 $ 1,527
Add (deduct):
Asset impairments 1,244 647 - 597
COVID-19 costs 336 44 - 292
Environmental costs 270 (121) (46) 345
Inventory write-downs (reversals) 134 36 (10) 88
Share-based compensation 47 (30) 14 91
Commodity derivative losses (gains) (62) 21 20 (63)
Other (41) (34) 59 52
Adjusted EBITDA (D) $ 2,570 $ 608 $ 967 (E) $ 2,929
Non-GAAP Financial Measures
160
Reconciliation of Net Debt to Adjusted EBITDA Ratio
(C$ in millions)
(A)
Twelve months ended
December 31, 2020
(B)
Three months ended
March 31, 2020
(C)
Three months ended
March 31, 2021
(A-B+C)
Twelve months ended
March 31, 2021
Total debt at period end (F) $ 6,947 (G) $ 7,385
Less: cash and cash equivalents at period end (450) (369)
Net debt (H) $ 6,497 (I) $ 7,016
Debt to adjusted EBITDA ratio (F/D) 2.7 (G/E) 2.5
Net debt to adjusted EBITDA ratio (H/D) 2.5 (I/E) 2.4
Equity attributable to shareholders of the company (J) 20.039 (K) 20.372
Obligation to Neptune Bulk Terminals (L) 138 (M) 150
Adjusted net debt to capitalization ratio (H+L)/(F+J+L) 0.24 (I+M)/(G+K+M) 0.26
Non-GAAP Financial Measures
We include net debt measures as we believe they provide readers with information that allows them to assess our credit capacity and the ability to meet
our short and long-term financial obligations, as well as providing a comparison to our peers. 161
Reconciliation of Net Debt to Adjusted EBITDA Ratio - Continued
Non-GAAP Financial Measures
162
(C$ in millions)
Three months ended
March 31, 2021
Three months ended
March 31, 2020
Profit (loss) $ 292 $ (311)
Finance expense net of finance income 51 47
Provision for (recovery of) income taxes 209 (69)
Depreciation and amortization 378 378
EBITDA $ 930 $ 45
Add (deduct):
Asset impairments - 647
COVID-19 costs - 44
Environmental costs (46) (121)
Inventory write-downs (reversals) (10) 36
Share-based compensation 14 (30)
Commodity derivative losses 20 21
Taxes and other 59 (34)
Adjusted EBITDA $ 967 $ 608
Reconciliation of EBITDA and Adjusted EBITDA
Non-GAAP Financial Measures
163
Reconciliation of Gross Profit Before Depreciation and Amortization
(C$ in millions)
Three months ended
March 31, 2021
Three months ended
March 31, 2020
Gross profit $ 654 $ 398
Depreciation and amortization 378 378
Gross profit before depreciation and amortization $ 1,032 $ 776
Reported as:
Copper
Highland Valley Copper $ 202 $ 77
Antamina 202 123
Carmen de Andacollo 47 60
Quebrada Blanca 11 3
Other - (1)
462 262
Zinc
Trail Operations 43 11
Red Dog 125 158
Other 3 14
171 183
Steelmaking coal 412 421
Energy (13) (90)
Gross profit before depreciation and amortization $ 1,032 $ 776
Non-GAAP Financial Measures
164
(C$ in millions)
Three months ended
March 31, 2021
Three months ended
March 31, 2020
Revenues
Copper (A) $ 767 $ 570
Zinc (B) 570 608
Steelmaking coal (C) 1,047 1,023
Energy (D) 163 176
Total $ 2,547 $ 2,377
Gross profit (loss) before depreciation and amortization
Copper (E) $ 462 $ 262
Zinc (F) 171 183
Steelmaking coal (G) 412 421
Energy (H) (13) (90)
Total $ 1,032 $ 776
Gross profit margins before depreciation
Copper (A/E) 60% 46%
Zinc (B/F) 30% 30%
Steelmaking coal (C/G) 39% 41%
Energy (D/H) (8)% (51)%
Reconciliation of Gross Profit (Loss) Margins Before Depreciation
Non-GAAP Financial Measures
1. Average period exchange rates are used to convert to US$ per pound equivalent.
We include unit cost information as it is frequently requested by investors and investment analysts who use it to assess our cost structure and margins
and compare it to similar information provided by many companies in our industry. 165
(C$ in millions, except where noted)
Three months ended
March 31, 2021
Three months ended
March 31, 2020
Revenue as reported $ 767 $ 570
By-product revenue (A) (85) (77)
Smelter processing charges (B) 30 37
Adjusted revenue $ 712 $ 530
Cost of sales as reported $ 401 $ 414
Less:
Depreciation and amortization (96) (106)
By-product cost of sales (C) (20) (20)
Adjusted cash cost of sales (D) $ 285 $ 288
Payable pounds sold (millions) (E) 143.4 155.8
Per unit amounts (C$/lb)
Adjusted cash cost of sales (D/E) $ 1.99 $ 1.85
Smelter processing charges (B/E) 0.21 0.24
Total cash unit costs (C$/lb) $ 2.20 $ 2.09
Cash margin for by-products (C$/lb) ((A-C)/E) (0.45) (0.37)
Net cash unit costs (C$/lb) $ 1.75 $ 1.72
US$ AMOUNTS1
Average exchange rate (C$/US$) $ 1.27 $ 1.34
Per unit amounts (US$/lb)
Adjusted cash cost of sales $ 1.57 $ 1.38
Smelter processing charges 0.16 0.18
Total cash unit costs (US$/lb) $ 1.73 $ 1.56
Cash margin for by-products (US$/lb) (0.35) (0.28)
Net cash unit costs (US$/lb) $ 1.38 $ 1.28
Copper Unit Cost Reconciliation
Non-GAAP Financial Measures
We include unit cost information as it is frequently requested by investors and investment analysts who use it to assess our cost structure and margins
and compare it to similar information provided by many companies in our industry. 166
(C$ in millions, except where noted)
Three months ended
March 31, 2021
Three months ended
March 31, 2020
Revenue as reported $ 570 $ 608
Less:
Trail Operations revenues as reported (461) (452)
Other revenues as reported (2) (2)
Add back: Intra-segment revenues as reported 130 96
$ 237 $ 250
By-product revenue (A) (2) (2)
Smelter processing charges (B) 75 77
Adjusted revenue $ 310 $ 325
Cost of sales as reported $ 445 $ 489
Less:
Trail Operations cost of sales as reported (439) (463)
Other costs of sales as reported 1 12
Add back: Intra-segment as reported 130 96
$ 137 $ 134
Less:
Depreciation and amortization (25) (42)
Royalty costs (36) (13)
By-product cost of sales (C) - -
Adjusted cash cost of sales (D) $ 76 $ 79
Zinc Unit Cost Reconciliation (Mining Operations)
Non-GAAP Financial Measures
167
Zinc Unit Cost Reconciliation (Mining Operations) - Continued
(C$ in millions, except where noted)
Three months ended
March 31, 2021
Three months ended
March 31, 2020
Payable pounds sold (millions) (E) 195.3 251.3
Per unit amounts (C$/lb)
Adjusted cash cost of sales (D/E) $ 0.39 $ 0.31
Smelter processing charges (B/E) 0.38 0.31
Total cash unit costs (C$/lb) $ 0.77 $ 0.62
Cash margin for by-products (C$/lb) ((A-C)/B) (0.01) (0.01)
Net cash unit costs (C$/lb) $ 0.76 $ 0.61
US$ AMOUNTS1
Average exchange rate (C$/US$) $ 1.27 $ 1.34
Per unit amounts (US$/lb)
Adjusted cash cost of sales $ 0.31 $ 0.23
Smelter processing charges 0.30 0.23
Total cash unit costs (US$/lb) $ 0.61 $ 0.46
Cash margin for by-products (US$/lb) (0.01) (0.01)
Net cash unit costs (US$/lb) $ 0.60 $ 0.45
1. Average period exchange rates are used to convert to US$ per tonne equivalent.
We include unit cost information as it is frequently requested by investors and investment analysts who use it to assess our cost structure and margins
and compare it to similar information provided by many companies in our industry.
Non-GAAP Financial Measures
1. Average period exchange rates are used to convert to US$ per tonne equivalent.
We include unit cost information as it is frequently requested by investors and investment analysts who use it to assess our cost structure and margins
and compare it to similar information provided by many companies in our industry. 168
(C$ in millions, except where noted)
Three months ended
March 31, 2021
Three months ended
March 31, 2020
Cost of sales as reported $ 851 $ 777
Less:
Transportation costs (256) (242)
Depreciation and amortization (216) (175)
Inventory (write-down) reversal 10 5
Adjusted site cash cost of sales $ 389 $ 365
Tonnes sold (millions) 6.2 5.7
Per unit amounts (C$/t)
Adjusted site cash cost of sales $ 63 $ 64
Transportation costs 41 43
Inventory write-downs (2) (1)
Unit costs (C$/t) $ 102 $ 106
US$ AMOUNTS1
Average exchange rate (C$/US$) $ 1.27 $ 1.34
Per unit amounts (US$/t)
Adjusted site cash cost of sales $ 49 $ 48
Transportation costs 33 32
Inventory write-downs (reversals) (2) (1)
Unit costs (US$/t) $ 80 $ 79
Steelmaking Coal Unit Cost Reconciliation
Non-GAAP Financial Measures
1. Reflects adjustments for costs not directly attributed to the production of Fort Hills bitumen, including transportation for non-proprietary product purchased. 169
(C$ in millions, except where noted)
Three months ended
March 31, 2021
Three months ended
March 31, 2020
Revenue as reported $ 163 $ 176
Less:
Cost of diluent for blending (54) (97)
Non-proprietary product revenue (28) (7)
Add back: Crown royalties (D) 1 3
Adjusted revenue (A) $ 82 $ 75
Cost of sales as reported $ 196 $ 298
Less:
Depreciation and amortization (20) (33)
Bitumen and diluent inventory write-downs - (23)
Cash cost of sales $ 176 $ 242
Less:
Cost of diluent for blending (54) (97)
Cost of non-proprietary product purchased (25) (3)
Transportation costs for non-proprietary product
purchased1 (4) (1)
Transportation costs for FRB (C) (24) (29)
Adjusted operating costs (E) $ 69 $ 112
Blended bitumen barrels sold (000’s) 2,275 4,419
Less: diluent barrels included in blended bitumen (000’s) (598) (1,177)
Bitumen barrels sold (000’s) (B) 1,677 3,242
Energy Operating Netback, Bitumen & Blended Bitumen Price Realized Reconciliations
Non-GAAP Financial Measures
1. Bitumen price realized represents the realized petroleum revenue (blended bitumen sales revenue) net of diluent expense, expressed on a per barrel
basis. Blended bitumen sales revenue represents revenue from our share of the heavy crude oil blend known as Fort Hills Reduced Carbon Life Cycle
Dilbit Blend (FRB), sold at the Hardisty and U.S. Gulf Coast market hubs. FRB is comprised of bitumen produced from Fort Hills blended with purchased
diluent. The cost of blending is affected by the amount of diluent required and the cost of purchasing, transporting and blending the diluent. A portion of
diluent expense is effectively recovered in the sales price of the blended product. Diluent expense is also affected by Canadian and U.S. benchmark
pricing and changes in the value of the Canadian dollar relative to the U.S. dollar.
2. Reflects adjustments for costs not directly attributed to the production of Fort Hills bitumen, including transportation for non-proprietary product purchased.
We include unit cost information as it is frequently requested by investors and investment analysts who use it to assess our cost structure and margins and
compare it to similar information provided by many companies in our industry. 170
Energy Operating Netback, Bitumen & Blended Bitumen Price Realized Reconciliations - Continued
(C$ in millions, except where noted)
Three months ended
March 31, 2021
Three months ended
March 31, 2020
Per barrel amounts (C$)
Bitumen price realized1 (A/B) $ 49.59 $ 23.12
Crown royalties (D/B) (0.88) (0.92)
Transportation costs for FRB2 (C/B) (14.53) (8.81)
Adjusted operating costs (E/B) (40.68) (34.88)
Operating netback (C$/barrel) $ (6.50) $ (21.49)
Revenue as reported $ 163 $ 176
Less: Non-proprietary product revenue (28) (7)
Add back: Crown royalties 1 3
Blended bitumen revenue (A) $ 136 $ 172
Blended bitumen barrels sold (000s) (B) 2.275 4,419
Blended bitumen price realized1 (C$) (A/B)=D $ 60.27 $ 38.87
Average exchange rate (C$ per US$1) (C) 1.27 1.34
Blended bitumen price realized (US$/barrel) (D/C) $ 47.58 $ 28.92
Non-GAAP Financial Measures
171
Reconciliation of Free Cash Flow
(C$ in millions) 2003 to Q1 2021
Cash Flow from Operations $48,735
Debt interest paid (5,933)
Capital expenditures, including capitalized stripping costs (29,605)
Payments to non-controlling interests (NCI) (652)
Free Cash Flow $12,545
Dividends paid $4,514
Payout ratio 36%
Global Basic Materials
Conference
June 10, 2021
Don Lindsay
President and Chief Executive Officer

Deutsche Bank Global Basic Materials Conference

  • 1.
    Global Basic Materials Conference June10, 2021 Don Lindsay President and Chief Executive Officer
  • 2.
    Caution Regarding Forward-LookingStatements 2 Both these slides and the accompanying oral presentations contain certain forward-looking statements within the meaning of the United States Private Securities Litigation Reform Act of 1995 and forward-looking information within the meaning of the Securities Act (Ontario) and comparable legislation in other provinces (collectively referred to herein as forward-looking statements). Forward-looking statements can be identified by the use of words such as “plans”, “expects” or “does not expect”, “is expected”, “budget”, “scheduled”, “estimates”, “forecasts”, “intends”, “anticipates” or “does not anticipate”, or “believes”, or variation of such words and phrases or state that certain actions, events or results “may”, “could”, “should”, “would”, “might” or “will” be taken, occur or be achieved. Forward-looking statements involve known and unknown risks, uncertainties and other factors which may cause the actual results, performance or achievements of Teck to be materially different from any future results, performance or achievements expressed or implied by the forward-looking statements. These statements speak only as of the original date of this presentation. These forward-looking statements include, but are not limited to, statements concerning: the potential impact of the COVID-19 on our business and operations, including our ability to continue operations at our sites; our ability to manage challenges presented by COVID-19; our long-term strategy, including but not limited to copper growth strategy; doubling of copper production by 2023 through QB2; all expectations regarding future copper, zinc and steelmaking coal demand and how Teck is positioned to benefit; Teck’s strategy ensuring we are well-positioned for changes in demand for commodities; expectation that Teck is well positioned for the low-carbon economy; our goal of carbon neutrality and the steps to achieve that goal; expectations of copper production growth; our green metals growth strategy and the components of that strategy, including but not limited to accelerating growth in copper, and maximizing cash flow from operations to fund copper growth; our climate action strategy and goals; all projections and forecasts about QB2 and QB3 or based on QB2 or QB3, including but not limited to life of the deposit, copper growth, C1 cash costs and AISC costs, strip ratio, throughput rate and potential to become a top five global copper producer, reserve and resource estimates, first production expectation, and all other projections included in the “Quebrada Blanca 2” Appendix; statement that Teck is positioned to realize value from a robust pipeline of copper projects; our ability to develop our copper growth projects; expectation that our copper growth projects will be approved for development; all potential project economics of our copper projects, including but not limited to NPV, C1 cash costs; all potential production from our copper projects; goals to maximize shareholder returns and maintain a strong balance sheet; goal of maintaining investment grade metrics; goal of balancing growth and capital returns; long-term zinc optionality; all economic and other projections for our copper growth projects, including but not limited to IRR, payback period, construction period, capex and mine life; impact of commodity price change on annualized EBITDA and annualized profit; liquidity and availability of borrowings under our credit facilities and the QB2 project finance facility; objectives and components of Teck's capital allocation framework, including a base dividend and potential supplemental shareholder distribution and maintenance of solid investment grade metrics; sustainability goals; statement we are poised for growth; expectation that QB2 will be a long-life, low-cost operation with significant expansion potential, the impact of QB2 on Teck’s portfolio balance and QB; QB2 capital estimate and estimated COVID-19 impacts on costs at QB2; timing of first production at QB2; growth options and opportunities in copper, zinc and steelmaking coal; all guidance appearing in this document including but not limited to the production, sales, cost, unit cost, capital expenditure, cost reduction and other guidance; climate action goals and the expectation that we will achieve these goals; water management goals and expectation that we will achieve those goals; Elk Valley water treatment projections; benefits and impact of our RACE21TM program; long term annual steelmaking coal production of 26 to 27 million tonnes, and expectations of stable long term strip ratio; benefits of the Neptune facility upgrade; expectation of strong long-term cash flows in steelmaking coal; projected steelmaking coal sustaining capital; expectation that Teck’s coal is optimally positioned for a decarbonizing future; long-term sustaining capital expenditure projection in copper; long-term sustaining capital expenditure projection in zinc; expectations for Red Dog extension; Fort Hills debottlenecking potential; expectation of sufficient pipeline capacity for our energy business; the benefits of our innovation strategy and initiatives described under the “Technology and Innovation” Appendix and elsewhere; mine lives and duration of operations at our various mines and operations; expectations and forecasts for our products, business units and individual operations and projects; and forecasts for supply and demand for copper, zinc, steelmaking coal and oil. The forward-looking statements are based on and involve numerous assumptions, risks and uncertainties and actual results may vary materially. These statements are based on assumptions, including, but not limited to, general business and economic conditions, interest rates, the supply and demand for, deliveries of, and the level and volatility of prices of, zinc, copper, coal, blended bitumen, and other primary metals, minerals and products as well as steel, oil, natural gas, petroleum, and related products, the timing of the receipt of regulatory and governmental approvals for our development projects and other operations and new technologies, our costs of production and production and productivity levels, as well as those of our competitors, power prices, continuing availability of water and power resources for our operations, market competition, the accuracy of our reserve estimates (including with respect to size, grade and recoverability) and the geological, operational and price assumptions on which these are based, conditions in financial markets, the future financial performance of the company, our ability to successfully implement our technology and innovation strategy, the performance of new technologies in accordance with our expectations, our ability to attract and retain skilled staff, our ability to procure equipment and operating supplies, positive results from the studies on our expansion projects, our coal and other product inventories, our ability to secure adequate transportation for our products, our ability to obtain permits for our operations and expansions, our ongoing relations with our employees and business partners and joint venturers, our expectations with respect to the carbon intensity of our operations, assumptions regarding returns of cash to shareholders include assumptions regarding our future business and prospects, other uses for cash or retaining cash. Our sustainability goals are based on a number of additional assumptions, including regarding the availability and effectiveness of technologies needed to achieve our sustainability goals and priorities; the availability of clean energy sources and zero-emissions alternatives for transportation on reasonable terms; our ability to implement new source control or mine design strategies and transition to seawater or low-quality water on commercially reasonable terms without impacting production objectives; our ability to successfully implement our technology and innovation strategy; and the performance of new technologies in accordance with our expectations. In addition, assumptions regarding the Elk Valley Water Quality Plan include assumptions that additional treatment will be effective at scale, and that the technology and facilities operate as expected. Reserve and resource life estimates assume the mine life of longest lived resource in the relevant commodity is achieved, assumes production at planned rates and in some cases development of as yet undeveloped projects. Assumptions regarding the benefits of the Neptune Bulk Terminals expansion and other projects include assumptions that the project is constructed and operated in accordance with current expectations. Capital allocation decisions, and decisions regarding the payment of dividends, are in the discretion of the board of directors. Assumptions regarding QB2 include assumption of completion based on current project assumptions and assumptions regarding the final feasibility study; assumptions regarding QB3 include assumptions regarding the receipt of permits. Assumptions regarding QB2 include current project assumptions and assumptions regarding the final feasibility study, CLP/USD exchange rate of 775, as well as there being no unexpected material and negative impact to the various contractors, suppliers and subcontractors for the QB2 project relating to COVID-19 or otherwise that would impair their ability to provide goods and services as anticipated during the suspension period or ramp-up of construction activities. Assumptions regarding the benefits of the Neptune Bulk Terminals expansion include assumptions that the project is constructed and operated in
  • 3.
    Caution Regarding Forward-LookingStatements 3 accordance with current expectations, and upstream infrastructure is in place to support the additional capacity. Statements regarding the availability of our credit facilities and project financing facility are based on assumptions that we will be able to satisfy the conditions for borrowing at the time of a borrowing request and that the facilities are not otherwise terminated or accelerated due to an event of default. Statements concerning future production costs or volumes are based on numerous assumptions of management regarding operating matters and on assumptions that demand for products develops as anticipated, that customers and other counterparties perform their contractual obligations, that operating and capital plans will not be disrupted by issues such as mechanical failure, unavailability of parts and supplies, labour disturbances, interruption in transportation or utilities, adverse weather conditions, and that there are no material unanticipated variations in the cost of energy or supplies. Statements regarding anticipated steelmaking coal sales volumes and average steelmaking coal prices depend on, among other things, timely arrival of vessels and performance of our steelmaking coal-loading facilities, as well as the level of spot pricing sales. The foregoing list of assumptions is not exhaustive. Events or circumstances could cause actual results to vary materially. Assumptions are also included in the footnotes to the slides. Factors that may cause actual results to vary materially include, but are not limited to: extended COVID-19 related suspension of activities and negative impacts on our suppliers, contractors, employees and customers; extended delays in return to normal operations due to COVID-19 related challenges; changes in commodity and power prices, changes in market demand for our products; changes in interest and currency exchange rates; acts of governments and the outcome of legal proceedings; inaccurate geological and metallurgical assumptions (including with respect to the size, grade and recoverability of mineral reserves and resources); unanticipated operational difficulties (including failure of plant, equipment or processes to operate in accordance with specifications or expectations, cost escalation, unavailability of materials and equipment, government action or delays in the receipt of government approvals, industrial disturbances or other job action, adverse weather conditions and unanticipated events related to health, safety and environmental matters); union labour disputes; political risk; social unrest; failure of customers or counterparties (including logistics suppliers) to perform their contractual obligations; changes in our credit ratings; unanticipated increases in costs to construct our development projects, difficulty in obtaining or retaining permits; inability to address concerns regarding permits or environmental impact assessments; current and new technologies relating to our Elk Valley water treatment efforts and other sustainability goals and targets may not perform as anticipated or may not be available, and ongoing monitoring may reveal unexpected environmental conditions requiring additional remedial measures; and changes or further deterioration in general economic conditions. Development of future reserves and resources is dependent on, among other factors, receipt of permits. Current and new technologies relating to our Elk Valley water treatment efforts may not perform as anticipated, and ongoing monitoring may reveal unexpected environmental conditions requiring additional remedial measures. QB2 costs, construction progress and timing of first production is dependent on, among other matters, our continued ability to successfully manage through the impacts of COVID-19. QB2 costs may also be affected by claims and other proceedings that might be brought against us relating to costs and impacts of the COVID-19 pandemic. Red Dog production may also be impacted by water levels at site. The forward-looking statements in this presentation and actual results will also be impacted by the effects of COVID-19 and related matters. The overall effects of COVID-19 related matters on our business and operations and projects will depend on how the ability of our sites to maintain normal operations, and on the duration of impacts on our suppliers, customers and markets for our products, all of which are unknown at this time. Continuing operating activities is highly dependent on the progression of the pandemic and the success of measures taken to prevent transmission, which will influence when health and government authorities remove various restrictions on business activities. We assume no obligation to update forward-looking statements except as required under securities laws. Further information concerning risks and uncertainties associated with these forward-looking statements and our business can be found in our Annual Information Form for the year ended December 31, 2020, filed under our profile on SEDAR (www.sedar.com) and on EDGAR (www.sec.gov) under cover of Form 40-F, as well as subsequent filings, including but not limited to our quarterly reports. QB2 Project Disclosure All economic analysis with respect to the QB2 project based on a development case which includes inferred resources within the life of mine plan, referred to as the Sanction Case, which is the case on which Teck based its development decision for the QB2 project. Inferred resources are considered too speculative geologically to have the economic considerations applied to them that would enable them to be categorized as mineral reserves. Inferred resources are subject to greater uncertainty than measured or indicated resources and it cannot be assumed that they will be successfully upgraded to measured and indicated through further drilling. Nonetheless, based on the nature of the mineralization, Teck has used a mine plan including inferred resources as the development mine plan for the QB2 project. The economic analysis of the Sanction Case, which includes inferred resources, may be compared to economic analysis regarding a hypothetical mine plan which does not include the use of inferred resources as mill feed, referred to as the Reserve Case, and which is set out in Appendix slides “QB2 Project Economics Comparison” and “QB2 Reserves and Resources Comparison”. The scientific and technical information regarding the QB2 project and Teck's other material properties was prepared under the supervision of Rodrigo Marinho, P. Geo, who is an employee of Teck. Mr. Marinho is a qualified person, as defined under National Instrument 43-101.
  • 4.
    Overview A Focused Strategy Poisedfor Growth Photo: Lowering shell for ball mill #3 at QB2
  • 5.
    High-quality assets inthe Americas Proven operational excellence underpinning cost competitiveness Doubling of copper production by 2023 through QB21 Significant value potential from a portfolio of green metals Recognized industry leader in ESG performance Strong balance sheet and rigorous capital allocation framework 5 Strong safety performance with stringent COVID-19 prevention protocols in place across the business Among the world’s lowest carbon intensity producers of copper, zinc and steelmaking coal Experienced leadership team with proven track record of project execution and operational excellence One of Canada’s leading mining companies, headquartered in Vancouver, British Columbia Operations & Major Projects Copper Zinc Energy Steelmaking Coal Operation Project About Teck
  • 6.
    Copper Zinc Seaborne Steelmaking Coal By2050 we expect:1 2.3x demand2 2.1x demand2 1.0x demand2 Driven by: Green technologies, electrification and improved energy efficiency require large amounts of copper – essential for decarbonization technologies Galvanizing to protect steel, batteries, renewables, infrastructure, industrial and health needs support strong demand Enduring demand for high quality seaborne steelmaking coal as coastal blast furnaces decarbonize and continue to meet steel demand from population growth, urbanization and a growing middle class How Teck is positioned to benefit: Doubling production by 20233 Largest net zinc miner Second largest seaborne steelmaking coal supplier and lowest carbon intensity 6 • Strong demand for metals and minerals driven by decarbonization, population growth and a rising middle class • Unprecedented pandemic monetary and fiscal stimulus • Forecast economic recovery as the COVID-19 vaccine is rolled out • Current stockpiles of essential minerals at historically low levels Accelerated Need for Essential Metals And Minerals for a Low-Carbon World
  • 7.
    Teck and theLow-Carbon Transition 7 We believe Teck’s strategy will ensure we are well-positioned for changes in demand for mining commodities driven by the transition to a low-carbon world • Build on our low carbon head start ‒ Among the world’s lowest carbon intensities for our copper, refined zinc and lead, and steelmaking coal production1 • Transition to renewable power = ~1 Mtpa GHG reduction ‒ Sourcing 100% renewable energy at Carmen de Andacollo from 2020 ‒ Sourcing >50% of operational energy at QB2 from renewable sources • Build QB2, which will double our consolidated copper production by 2023 • Explore options to realize value from our oil sands assets • Continue to produce the high-quality steelmaking coal required for the low-carbon transition • Reduce carbon as a proportion of our total business • Meet our milestone goals for 2030, in support of our carbon neutrality goal: ‒ Source 100% of all power needs in Chile from renewable power ‒ Reduce the carbon intensity of our operations by 33% ‒ Shift to low-emissions mining fleets • Work with our customers and transportation providers to reduce downstream emissions Carbon neutrality by 2050 1 Today Focus on copper growth to transition our portfolio to green metals 2 10+ Years Prudently growing our green metals business in areas essential to the transition to a low-carbon world 3 20+ Years Leading green metals producer supplying essential metals for a low-carbon world
  • 8.
    Industry Leading CopperGrowth 8 WoodMac: Consolidated Copper Production Growth1 Teck2 vs. Peers3 2021E-2023E Peru 86 kt Copper peers: Antofagasta, First Quantum, Freeport, Hudbay, Lundin and Southern Copper. Diversified peers: Anglo American, BHP, Glencore, Rio Tinto. Teck provides investors exposure to industry leading copper growth and valuation unlock 102% 11% 21% 0% 20% 40% 60% 80% 100% 120% Teck Copper Peer Average Diversified Peer Average
  • 9.
    Overview A Focused Strategy Poisedfor Growth Photo: QB2 concentrator - Flotation to concentrate thickeners
  • 10.
    Prudent Green MetalsGrowth Strategy 10 Canada 156 kt Peru 86 kt Chile 227 kt Accelerate growth in copper Maximize cash flows from operations to fund copper growth Strengthen existing high-quality assets through RACE21TM Discipline in capital allocation Leadership in sustainability
  • 11.
    276 276 290 2020A ProForma QB2 Consolidated (100%) Teck 2020 Actual Teck's Consolidated Copper Production1 (kt Cu) Accelerate Growth in Copper Focus on near term growth in copper production 11 • Solid base of current operations • QB2 project will double our consolidated copper production by 2023 • Significant longer term growth potential at Quebrada Blanca • Reserve and resource increase of 20%2 for Quebrada Blanca in the past year; orebody remains open in multiple directions ~100% Based on Sanction Case (Including 199 Mt Inferred Resources) Refer to “QB2 Project Economics Comparison” and “QB2 Reserves and Resources Comparison” slides for Reserve Case (Excluding Inferred Resources) The description of the QB2 project Sanction Case includes inferred resources that are considered too speculative geologically to have the economic considerations applied to them that would enable them to be categorized as mineral reserves. Inferred resources are subject to greater uncertainty than measured or indicated resources and it cannot be assumed that they will be successfully upgraded to measured and indicated through further drilling.
  • 12.
    Accelerate Growth inCopper QB2 project is over 50% complete 12 QB2’s Low Strip Ratio Is the Driver For Low All-in Sustaining Costs Vast, long-life deposit in Chile (~100 year resource) QB2 only uses ~18% of the 2020 reserve and resource tonnage1 Low C1 cash cost and All-in Sustaining Costs (AISC), of US$1.28/lb2 and US$1.38/lb3, respectively, in the first 5 full years Expected to initially be a top 20 global copper producer Project progressing well and surpassed the halfway point, with strict COVID-19 protocols in place Potential to become a top 5 producer with QB3 QB2 (0.7:1) Antamina (3.0:1)4 Collahuasi (3.7:1)4 Escondida (2.6:1)4 Based on Sanction Case (Including 199 Mt Inferred Resources) Refer to “QB2 Project Economics Comparison” and “QB2 Reserves and Resources Comparison” slides for Reserve Case (Excluding Inferred Resources) The description of the QB2 project Sanction Case includes inferred resources that are considered too speculative geologically to have the economic considerations applied to them that would enable them to be categorized as mineral reserves. Inferred resources are subject to greater uncertainty than measured or indicated resources and it cannot be assumed that they will be successfully upgraded to measured and indicated through further drilling. See a video and a photo gallery of our latest progress on QB2 at teck.com/investors
  • 13.
    Portfolio of CopperGrowth Options Well understood resource base creates multiple options 13 • High quality resources in very attractive mineral districts ‒ Including ~22 million ounces1 of measured and indicated gold resources, and ~10 million ounces1 in inferred gold resources in our copper growth options1 • Prudent investment to further define path to value, e.g. conversion of resources to reserves • Leveraging exploration, development and commercial expertise • Sustainability and community focus Teck’s Consolidated Copper Asset Reserves and Resources (CuEq Mt)2 7 8 16 31 13 15 29 56 18 12 18 48 Copper Operations QB Copper Growth Options Total Proven and Probable Reserves Measured & Indicated Resources Inferred Resources 1
  • 14.
    Portfolio of CopperGrowth Options Optionality to realize value through production or M&A Teck is positioned to realize value from a robust pipeline of copper projects • Investment in exploration and strategic M&A over the last 20 years have secured various opportunities • Focus on technical, social, environmental and commercial de-risking of opportunities • Leadership, experience and systems in place to fulfill strategy Seek to maximize shareholder returns and maintain a strong balance sheet • Reduce Teck’s equity requirements through partnering, streams, infrastructure carve-outs and project financing • Maintain investment grade metrics to support strong liquidity • Rigorous capital allocation framework to balance growth and cash returns 14 QB2 Case Study De-risked at project sanction: • ~80% engineered and >70% procured • Key permits approved Reduced equity requirements: • US$1.2B transaction payment received • Partnership further reduced Teck’s funding • US$2.5B project finance Right sized balance sheet: • Repaid US$4B in debt1 and regained investment grade rating Return of capital to shareholders: • C$1.2B of share buy backs and ~C$700M in dividends2 Total Capex Partner Project Finance Teck
  • 15.
    QB2 Zafranal San Nicolás QB3 Galore Creek Mesaba Schaft Creek NuevaUnión -5.0% 50.0% 105.0% 1.5 3.55.5 Portfolio of Copper Growth Options Value optionality guided by commercial discipline Bubble size reflects LOM average annual CuEq production1 (shown on a 100% project basis). QB3 shown as incremental to QB2. 15 Medium-term Options Framing Options Near-term Options Delivering Value Deliberate risk-adjusted capital allocation process Investment Return Potential Early Stage Options Investment | Execution
  • 16.
    16 3 4 2 1 5 6 7 Portfolio of CopperGrowth Options High quality copper options Near Term Options 1 Zafranal (Cu-Au), Peru1,2 80% (MMC) Feasibility Study complete; SEIA submission in Q2 2021 First five years: 133 ktpa CuEq; C1 Costs US$1.18/lb Cu. US$1.2B capex; NPV8 US$1,026M; IRR 23.3% 2 San Nicolás (Cu-Zn-Au-Ag), Mexico1,2 100% Prefeasibility Study complete Q1 2021 First five years: 125 ktpa CuEq; C1 Costs (US$0.18)/lb Cu. US$0.8B capex; NPV8 US$1,499M; IRR 34.0% Medium Term Options 3 QB3 (Cu-Ag-Mo), Chile1,3 60% (SMM/SC) Prefeasibility Study stage; Doubling scenario: Potential 465ktpa CuEq; C1 Costs of US$1.15-1.25/lb Cu 4 Galore Creek (Cu-Au-Ag), BC, Canada1 50% (Newmont) Prefeasibility Study stage; Potential 230 ktpa CuEq; C1 Costs of US$0.65-0.75/lb Cu Future Potential 5 NuevaUnión (Cu-Au-Ag-Mo), Chile1 50% (Newmont) Feasibility Study being optimized; Potential 254 ktpa CuEq; C1 Costs of US$1.00-1.10/lb Cu 6 Mesaba (Cu-Ni, PGM-Co), Minnesota, USA1 100% Scoping study (incl. baseline studies) complete; Potential 239 ktpa CuEq; C1 Costs US$0.80-0.90/lb Cu 7 Schaft Creek (Cu-Mo-Au-Ag), BC, Canada1 75% (Copper Fox) Scoping Study being updated; Potential 161 ktpa CuEq; C1 Costs US$0.60-0.70/lb Cu This slide discloses the results of economic analysis of mineral resources. Mineral resources that are not mineral reserves and do not have demonstrated economic viability. Projections for QB3, Galore Creek, Mesaba and Schaft Creek include inferred resources that are considered too speculative geologically to have the economic considerations applied to them that would enable them to be categorized as mineral reserves. Inferred resources are subject to greater uncertainty than measured or indicated resources and it cannot be assumed that they will be successfully upgraded to measured and indicated through further drilling.
  • 17.
    Maximize Cash FlowsFrom Operations To Fund Copper Growth 17 COPPER • Foundation of stable operations with three large operating mines • Among the lowest carbon intensity copper producers • 10-year average gross profit margin 47%1 ZINC • Galvanizing extends the life of infrastructure supporting decarbonization • Red Dog is one of the largest high grade, low-cost zinc mines globally • Long-term optionality through Teena, Cirque, Aktigiruq, and Anarraaq • Red Dog 10-year average gross profit margin 53%1 STEELMAKING COAL • Stable operations with four operating mines in the Elk Valley, BC • Focus on growing margins, not volume • Enhanced logistics capability to strengthen long-term, low-cost and reliable supply chain • 10-year average gross profit margin 49%1
  • 18.
    Strengthen Existing High-QualityAssets Through RACE21TM 18 Transformational safety impact Step-change impact to operational efficiency Increased productivity through technology and innovation Increased margins Advanced data analytics and artificial intelligence to reduce risk of heavy vehicle / light vehicle interactions Increased copper throughput by ~7% and recovery by ~2% at Highland Valley Copper Record haul truck productivities at our coal sites, up 0.5% versus same period last year Improved zinc feed margins by $5 per tonne processed at our Trail Operations RACE21TM is driving operational improvements and transforming our business through technology and innovation Focus Examples
  • 19.
    Discipline in CapitalAllocation A transparent framework, rigorously applied 19 BASE DIVIDEND COMMITTED GROWTH CAPITAL CAPITAL STRUCTURE SUSTAINING CAPITAL (including stripping) SUPPLEMENTAL SHAREHOLDER DISTRIBUTIONS Plus at Least 30% Available Cash Flow1 Additional cash returns to shareholders Build on C$6.8 billion2 of dividends and share buybacks since 2003 Further green metals growth opportunities No growth in carbon assets 1. For this purpose, we define available cash flow as cash flow from operating activities after interest and finance charges, lease payments and distributions to non-controlling interests less: (i) sustaining capital and capitalized stripping; (ii) committed growth capital; (iii) any cash required to adjust the capital structure to maintain solid investment grade credit metrics; and (iv) our base $0.20 per share annual dividend. Proceeds from any asset sales may also be used to supplement available cash flow. Any additional cash returns will be made through share repurchases and/or supplemental dividends depending on market conditions at the relevant time. 2. As at March 31, 2021. FCF is free cash flow. Free cash flow is a non-GAAP financial measure. See “Non-GAAP Financial Measures” slides. C$4.5 billion2 in dividends (36% of FCF) C$2.3 billion2 in buybacks (18% of FCF) { Optimizing how we deploy Available Cash Flow1: Balancing between returning cash to shareholders and investing in green metals growth AND
  • 20.
    Leadership in Sustainability 20 Topranked diversified metals mining company “A” rating since 2013 Outperforming 4 of 5 largest peers Top-ranked mining company 2020 World & North American Indices Gold Class Award 2021 Carbon and water goals that address the climate challenge • Paris-aligned commitment to be carbon neutral by 2050; reducing carbon intensity by 33% by 2030 • Transitioning to sea or sustainable water sources in all water-scarce regions by 2040 • Lowest GHG intensity miner1 (tCO2e/t CuEq, 2017) Employer of choice, neighbor of choice • Enhancing critical control verification to drive further improvements in safety • Strong relationships with our communities and Indigenous Peoples Sustainable governance • Sustainability oversight & direction by dedicated Board and management committees • Health & safety and sustainability performance linked to compensation program 1. Source: Barclays Research, Teck.
  • 21.
    Overview A Focused Strategy Poisedfor Growth Photo: New double rail car dumper at Neptune
  • 22.
    Industry leading copper growth, strengthening existinghigh-quality, low carbon assets Right Approach Highest standards of sustainability in everything we do, operational excellence, RACE21TM Our people deliver the optimal mix of industry leading technical, digital, sustainability, commercial and financial leadership Right Opportunities Strong demand for our metals and minerals, led by growth and decarbonization Right Assets Poised for Growth 22 Providing essential metals and minerals for a low-carbon world Right Team
  • 23.
  • 24.
    Endnotes Slide 5: AboutTeck 1. On a consolidated basis. Slide 6: Accelerated Need for Essential Metals and Minerals for a Low-Carbon World 1. Modelled forecast under International Energy Agency (IEA) Rapid Transition Sustainable Development Scenario (SDS) for 1.5ºC (1.5oC). 2. Source: McKinsey. 3. On a consolidated basis. Slide 7: Teck and the Low-Carbon Transition 1. Barclays Research; Teck. 2017. Slide 8: Industry Leading Copper Growth 1. Source: Wood Mackenzie base case (attributable) copper production dataset. Consolidated production estimates were derived based on accounting standards for consolidation for Teck and its peers. 2. Teck growth estimate uses 2020 actual production and Wood Mackenzie data for 2023. 3. Copper peers: Antofagasta, First Quantum, Freeport, Hudbay, Lundin, Southern Copper. Diversified peers: Anglo American, BHP, Glencore, Rio Tinto. Peer production metrics for 2020 and 2023 are from Wood Mackenzie. Peer production metrics for 2020 and 2023 are from Wood Mackenzie. Peer averages are the simple averages. Slide 11: Accelerate Growth in Copper - Focus on near-term growth in copper production 1. We include 100% of production from our Quebrada Blanca and Carmen de Andacollo mines in our production and sales volumes, even though we do not own 100% of these operations, because we fully consolidate their results in our financial statements. We include 22.5% of production from Antamina, representing our proportionate ownership interest in the operation. QB2 is on a consolidated basis and is based on the QB2 Sanction Case first five full years of copper production. 2. Contained metal. Based on Teck’s 2020 Annual Information Form. Slide 12: Accelerate Growth in Copper - QB2 project is over 50% complete 1. Resources figures are based on Teck’s 2020 Annual Information Form. Resources are reported separately from, and do not include that portion of resources classified as reserves. See “QB2 Reserves and Resources Comparison” slide for further details. 2. C1 cash costs (also known as net cash unit costs) are presented after by-product credits assuming US$10.00/lb molybdenum and US$18.00/oz silver. C1 cash costs for QB2 include stripping costs during operations. See “QB2 Reserves and Resources Comparison” slide for further details. Net cash unit costs and C1 cash costs are non-GAAP financial measures. See “Non-GAAP Financial Measures” slides. 3. All-in sustaining costs (AISC) are net cash unit costs (also known as C1 cash costs) plus sustaining capital expenditures. Net cash unit costs are calculated after cash margin by-product credits assuming US$10.00/lb molybdenum and US$18.00/oz silver. Net cash unit costs for QB2 include stripping costs during operations. See “QB2 Reserves and Resources Comparison” slide for further details. AISC, net cash unit cost and cash margins for by-products are non-GAAP financial measures. See “Non-GAAP Financial Measures” slides. 4. Source: Wood Mackenzie. Average 2021-2040. Slide 13: Portfolio of Copper Growth Options - Well understood resource base creates multiple options 1. Contained equivalent copper metal at 100% basis for all projects. Copper growth assets are: Zafranal, San Nicolás, NuevaUnión, Mesaba, Schaft Creek, Galore Creek. See Teck’s 2020 AIF for further information, including the grade and quantity, regarding the gold reserves and resources for these projects and the grade of the other metals used to determine the copper equivalent. 2. Contained equivalent copper metal at 100% basis for all projects. CuEq calculated with price assumptions: US$3.50/lb Cu; US$1.15/lb Zn; US$6.90/lb Ni; US$21/lb Co; US$10/lb Mo; US$1,400/oz Au; US$18/oz Ag; US$1,300/oz Pd; US$1,200/oz Pt. Slide 14: Portfolio of Copper Growth Options - Optionality to realize value through production or M&A 1. Total debt repayment between Q4 2015 and Q3 2019. 2. Share buybacks and dividends since Q4 2017 (one year prior to project sanction). Slide 15: Portfolio of Copper Growth Options - Value optionality guided by commercial discipline 1. CuEq calculated with price assumptions: US$3.50/lb Cu; US$1.15/lb Zn; US$6.90/lb Ni; US$21/lb Co; US$10/lb Mo; US$1,400/oz Au; US$18/oz Ag; US$1,300/oz Pd; $1,200/oz Pt. Averages exclude first and last partial years of production. 24
  • 25.
    Endnotes Slide 16: Portfolioof Copper Growth Options - High quality copper options 1. Financials and CuEq calculated with price assumptions: US$3.50/lb Cu; US$1.15/lb Zn; US$6.90/lb Ni; US$21/lb Co; US$10/lb Mo; US$1,400/oz Au; US$18/oz Ag; US$1,300/oz Pd; US$1,200/oz Pt. C1 cash cost are shown net of by-product credits. All averages exclude first and last partial years of production. 2. Financial summary based on At-Sanction Economic Assessment. Go-forward costs of Prefeasibility, Detailed Engineering, Permitting and Project Set-up costs not included. 3. Various paths to expansion including 50% increase, doubling and tripling of throughput. Slide 17: Maximize Cash Flows from Operations to Fund Copper Growth 1. Gross profit margins before depreciation from January 1, 2011 to December 31, 2020. Gross profit margins before depreciation are a non-GAAP financial measure. See “Non-GAAP Financial Measures” slides. 25
  • 26.
  • 27.
    Global Customer Base Revenuecontribution from diverse markets 27 2020 Revenue by Business Unit Copper 27% Zinc 30% Steelmaking coal 38% Energy 5% 2020 Gross Profit Before Depreciation and Amortization1 by Business Unit Copper 44% Zinc 29% Steelmaking coal 35% Energy -8% 2020 Revenue by Geography India 6% China 21% Asia (ex. China/India) 33% North America 25% Latin America 2% Europe 13%
  • 28.
    Disciplined Approach toM&A 28 CdA Gold Stream1, $206M Project Corridor /Nueva Union, $0 Antamina Silver Stream2 $795M Osisko Royalty Package, $28M Sandstorm Royalty Package3 $32M HVC Minority, ($33M) Teena Minority4, ($11M) AQM Copper, ($25M) Wintering Hills, $59M San Nic Minority5, ($65M) IMSA’s stake in QB, ($208M) Waneta Dam, $1,200M6 QB2 Divestment (30%)7 $1,072M ($500) $0 $500 $1,000 $1,500 July 10 Aug 27 Oct 7 Oct 25 Jan 19 July 5 Oct 18 Nov 21 Jan 26 Oct 18 Apr 4 Jul 26 Mar 29 2015 2016 2017 2018 2019 Total net proceeds of C$3.1B: • Balance sheet strengthened by divestment of non-core assets at high EBITDA8 multiples • Modest ‘prudent housekeeping’ acquisitions to consolidate control of attractive copper and zinc development assets Recent Transaction History Net Proceeds (Cost) (C$M)
  • 29.
    Production Guidance 29 Units in000’s tonnes (excluding steelmaking coal, molybdenum, and bitumen) 2020 2021 Guidance1 3-Year Guidance1 (2022-2024) Copper2,3,4 Highland Valley 119.3 128-133 135-165 Antamina 85.6 91-95 90 Carmen de Andecollo 57.4 46-51 50-60 Quebrada Blanca6 13.4 10-11 - Total copper 275.7 275-290 275-315 Zinc2,3,5 Red Dog 490.7 490-510 510-550 Antamina 96.3 95-100 80-100 Total zinc 587.0 580-610 590-650 Refined zinc Trail 305.1 300-310 305-315 Steelmaking coal (Mt) 21.1 25.5-26.5 26.0-27.0 Bitumen3 (Mbbl) Fort Hills 8.4 8.6-12.1 14 Lead2 Red Dog 97.5 85-95 80-90 Molybdenum2,3 (Mlbs) Highland Valley 3.8 1.2-1.8 3.0-4.5 Antamina 1.5 1.0-1.4 2.0-3.0 Total molybdenum 5.1 2.2-3.2 5.0-7.5
  • 30.
    Sales and UnitCost Guidance 30 Unit Costs 2020 2021 Guidance1 Copper3 Total cash unit costs7 (US$/lb) $1.57 $1.65-1.75 Net cash unit costs4,7 (US$/lb) 1.28 1.30-1.40 Zinc5 Total cash unit costs7 (US$/lb) 0.53 $0.54-0.59 Net cash unit costs4,7 (US$/lb) 0.36 0.40-0.45 Steelmaking coal6 Adjusted site cash cost of sales7 $64 $59-64 Transportation costs 41 36-39 Inventory write-down 3 - Unit costs7 (C$/tonne) $108 $95-103 Bitumen Adjusted operating costs7 (C$/barrel) C$31.96 C$28-32 Sales Q1 2020 Q2 2022 Guidance1 Zinc2 Red Dog (kt) 104 35-45 Steelmaking coal (Mt) 6.2 6.0-6.4
  • 31.
    Capital Expenditures Guidance 31 (Teck’sshare in CAD$ millions) 2020 2021 Guidance1 Sustaining Copper $ 161 $ 160 Zinc 188 155 Steelmaking coal2 571 430 Energy 91 85 Corporate 12 - Total sustaining $ 1,023 $ 830 Growth3 Copper4 $ 41 $ 125 Zinc 7 25 Steelmaking coal 411 390 Corporate 4 5 $ 463 $ 545 Total Copper $ 202 $ 285 Zinc 195 180 Steelmaking coal 982 820 Energy 91 85 Corporate 16 5 $ 1,486 $ 1,375 (Teck’s share in CAD$ millions) 2020 2021 Guidance1 QB2 capital expenditures $ 1,643 $ 2,500 Total before SMM/SC contributions 3,129 3,875 Estimated SMM/SC contributions (660) (440) Estimated QB2 project financing draw to capex (983) (1,425) Total, net of partner contributions and project financing $ 1,486 $ 2,010 QB2 (Teck’s share in CAD$ millions) 2020 2021 Guidance1 Capitalized Stripping Copper $ 145 $ 205 Zinc 51 70 Steelmaking coal 303 295 $ 499 $ 570 Capitalized Stripping Sustaining and Growth Capital
  • 32.
    Commodity Price Leverage1 32 2021Mid-Range Production Estimates2,5 Change Estimated Effect on Annualized Profit3 ($M) Estimated Effect on Annualized EBITDA3 ($M) US$ exchange C$0.01 $45 $70 Copper (kt) 282.5 US$0.01/lb $5 $8 Zinc4 (kt) 902.5 US$0.01/lb $9 $12 Steelmaking coal (Mt) 26.0 US$1/tonne $19 $30 WCS5 (Mbbl) 10.4 US$1/bbl $9 $13 WTI6 US$1/bbl $6 $8
  • 33.
    Tax-Efficient Earnings inCanada and Chile 33 Canada: ~C$4.5 billion in available tax pools at December 31, 2020 • Includes: ‒ $3.8 billion in Canadian federal net operating loss carryforwards ‒ $0.3 billion in Canadian Development Expenses (30% declining balance p.a.) ‒ $0.4 billion in allowable capital loss carryforwards • Applies to cash income taxes in Canada • Does not apply to: ‒ Resource taxes in Canada ‒ Cash taxes in foreign jurisdictions Chile: ~C$800 million in available tax pools at December 31, 2020 • Chilean net operating loss carryforwards • Applies to cash income taxes for QB2
  • 34.
    Share Structure &Principal Shareholders 34 Shares Held Percent Voting Rights Class A Shareholdings Temagami Mining Company Limited 4,300,000 55.4% SMM Resources Inc (Sumitomo) 1,469,000 18.9% Other 1,996,503 25.7% 7,765,503 100.0% Class B Shareholdings Temagami Mining Company Limited 725,000 0.1% SMM Resources Inc (Sumitomo) 295,800 0.1% China Investment Corporation (Fullbloom) 59,304,474 11.3% Other 463,056,146 88.5% 523,381,420 100.0% Total Shareholdings Temagami Mining Company Limited 5,025,000 0.9% 33.1% SMM Resources Inc (Sumitomo) 1,764,800 0.3% 11.3% China Investment Corporation (Fullbloom) 59,304,474 11.2% 4.6% Other 465,052,649 87.6% 51.0% 531,146,923 100.0% 100.0% Teck Resources Limited at December 31, 2020
  • 35.
    Collective Agreements Operation ExpiryDates Elkview October 31, 2020 Fording River April 30, 2021 Antamina July 31, 2021 Highland Valley Copper September 30, 2021 Trail Operations May 31, 2022 Cardinal River June 30, 2022 Quebrada Blanca January 31, 2022 March 31, 2022 November 20, 2022 Carmen de Andacollo September 30, 2022 December 31, 2022 Line Creek May 31, 2024 35
  • 36.
    Endnotes: Overview Slide 27:Global Customer Base 1. Gross profit before depreciation and amortization is a non-GAAP financial measure. See “Non-GAAP Financial Measures” slides. Slide 28: Disciplined Approach to M&A 1. Carmen de Andacollo gold stream transaction occurred in USD at US$162 million. 2. Antamina silver stream transaction occurred in USD at US$610 million. 3. Sandstorm royalty transaction occurred in USD at US$22 million. 4. Teena transaction occurred in AUD at A$10.6 million. 5. San Nicolàs transaction occurred in USD at US$50 million. 6. Waneta Dam transaction closed July 26, 2018 for C$1.2 billion. 7. QB2 Partnership (sale of 30% interest of project to Sumitomo; SMM and SC) for total consideration of US$1.2 billion, including US$800 million earn-in and US$400 million matching contribution; converted at FX of 1.34 on March 29, 2019. 8. EBITDA is a non-GAAP financial measure. See “Non-GAAP Financial Measures” slides. Slide 29: Production Guidance 1. As at April 27, 2021. See Teck’s Q1 2021 press release for further details. 2. Metal contained in concentrate. 3. We include 100% of production and sales from our Quebrada Blanca and Carmen de Andacollo mines in our production and sales volumes, even though we do not own 100% of these operations, because we fully consolidate their results in our financial statements. We include 22.5% and 21.3% of production and sales from Antamina and Fort Hills, respectively, representing our proportionate ownership interest in these operations. 4. Copper production includes cathode production at Quebrada Blanca and Carmen de Andacollo. 5. Total zinc includes co-product zinc production from our 22.5% proportionate interest in Antamina. 6. Three-year guidance 2022-2024 excludes production from QB2. Slide 30: Sales and Unit Cost Guidance 1. As at April 27, 2021. See Teck’s Q1 2021 press release for further details. 2. Metal contained in concentrate. 3. Copper unit costs are reported in U.S. dollars per payable pound of metal contained in concentrate. Copper net cash unit costs include adjusted cash cost of sales and smelter processing charges, less cash margins for by-products including co-products. Guidance for 2021 assumes a zinc price of US$1.22 per pound, a molybdenum price of US$8.50 per pound, a silver price of US$20 per ounce, a gold price of US$2,000 per ounce and a Canadian/U.S. dollar exchange rate of $1.30. 4. After co-product and by-product margins. 5. Zinc unit costs are reported in U.S. dollars per payable pound of metal contained in concentrate. Zinc net cash unit costs are mine costs including adjusted cash cost of sales and smelter processing charges, less cash margins for by-products. Guidance for 2021 assumes a lead price of US$0.85 per pound, a silver price of US$20 per ounce and a Canadian/U.S. dollar exchange rate of $1.30. By-products include both by-products and co-products. 6. Steelmaking coal unit costs are reported in Canadian dollars per tonne. 7. Non-GAAP financial measure. See “Non-GAAP Financial Measures” slides. 36
  • 37.
    Endnotes: Overview Slide 31:Capital Expenditures Guidance 1. As at April 27, 2021. See Teck’s Q1 2021 press release for further details. 2. Steelmaking coal sustaining capital guidance for 2021 includes $255 million of water treatment capital. 2020 includes $267 million of water treatment capital. 3. Growth expenditures include RACE21TM capital expenditures for 2021 of $120 million, of which $80 million relates to steelmaking coal, $30 million relates to copper, $5 million relates to zinc and $5 million relates to corporate projects. 4. Copper growth guidance for 2021 includes studies for HVC 2040, Antamina, QB3, Zafranal, San Nicolás and Galore Creek. Slide 32: Commodity Price Leverage 1. As at April 27, 2021. The sensitivity of our annual profit attributable to shareholders and EBITDA to changes in the Canadian/U.S. dollar exchange rate and commodity prices, before pricing adjustments, based on our current balance sheet, our 2021 mid-range production estimates, current commodity prices and a Canadian/U.S. dollar exchange rate of $1.30. See Teck’s Q1 2021 press release for further details. 2. All production estimates are subject to change based on market and operating conditions. 3. The effect on our profit attributable to shareholders and on EBITDA of commodity price and exchange rate movements will vary from quarter to quarter depending on sales volumes. Our estimate of the sensitivity of profit and EBITDA to changes in the U.S. dollar exchange rate is sensitive to commodity price assumptions. 4. Zinc includes 305,000 tonnes of refined zinc and 597,500 tonnes of zinc contained in concentrate. 5. Bitumen volumes from our energy business unit. 6. Our WTI oil price sensitivity takes into account our interest in Fort Hills for respective change in revenue, partially offset by the effect of the change in diluent purchase costs as well as the effect on the change in operating costs across our business units, as our operations use a significant amount of diesel fuel. 37
  • 38.
  • 39.
    Sustainability Reporting &Rankings 39 • Top-ranked mining company World & North American Indices • Gold Class Award 2021 • “A” rating since 2013 • Outperforming 4 of 5 largest peers • Top ranked diversified metals mining company • Top ranked North American company • #1 in the mining subsector • Ranked among the top 10% of Metals & Mining companies Our Reporting Frameworks GRI Standards Helps businesses, government and stakeholders communicate and understand impact of business on sustainability issues SASB Standards Helps businesses identify, manage and report on sustainability topics of greatest interest to investors Task Force on Climate Related Financial Disclosures (TCFD) Helps businesses quantify and communicate climate change risks and opportunities ESG Rankings
  • 40.
    Focus on SustainabilityLeadership Ambitious sustainability goals in eight strategic themes 40 Climate Change Responsible Production Water Tailings Management Biodiversity and Reclamation Health and Safety Our People Communities and Indigenous Peoples
  • 41.
    Sustainability Leadership Aligned withleading external standards and practices 41 See the full list on our Memberships and Partnerships page: https://www.teck.com/responsibility/approach-to-responsibility/policies-and-commitments/memberships-&-partnerships/
  • 42.
    Health and Safety Oursafest year on record in 2020 • Safety performance in 2020 - 32% reduction in High-Potential Incident Frequency - 23% decrease in Lost-Time Disabling Injury Frequency 42 Teck Operated Incident Frequency (per 200,000 hours worked) 0.00 0.10 0.20 0.30 0.40 0.50 0.60 0.70 2016 2017 2018 2019 2020 High-Potential Incident Frequency Serious High-Potential Incident Frequency Potentially Fatal Occurrence Frequency High-Potential Incident Frequency rate reduced by two-thirds over past five years
  • 43.
    Climate Action Positioning fora low-carbon economy Well positioned for a low-carbon economy Among lowest GHG intensity miners globally on a copper-equivalent basis GHG intensity for steelmaking coal and copper production among lowest in industry Carbon pricing already built into majority of business Scope 1+2 emissions per copper equivalent ranking1 (tCO2e/t CuEq, 2017) 43 1. Source: Barclays Research, Teck.
  • 44.
    Climate Action Key activitiesfor short-term goals 44 Investing in lower-carbon means of transportation such as electric haul trucks, conveyors and other approaches Reduce the carbon intensity of our operations by 33% by 2030 Electric bus pilot project represents the first use of electric passenger buses for employee transport in the Canadian mining industry Accelerate the adoption of zero-emissions alternatives for transportation by displacing the equivalent of internal combustion engine (ICE) vehicles by 2025 1,000 Procure of our electricity demands in Chile from clean energy by 2025 and In 2020 two power purchase agreements announced: - Over 50% of QB2 operating power requirement from renewables - 100% renewable power at Carmen de Andacollo 100% by 2030 50%
  • 45.
    Climate Action Path tocarbon neutrality Mitigation Hierarchy Apply Decarbonization Framework Prioritize Opportunities and Deliver Cost Competitive Reductions Avoid Eliminate Minimize Offset Emissions sources Power supply Mobile equipment Stationary combustion and process Fugitive methane emissions Renewable energy Electrification and alternative material handling Select abatement options Electrification and low carbon fuels Methane recovery and abatement Time 2020-2030: Target readily available, cost competitive technologies in these areas 45
  • 46.
    Implement innovative watermanagement and water treatment solutions to protect water quality downstream of all our operations. Transition to seawater or low-quality water sources for all operations in water-scarce regions by 2040. 46 Water Management Long term strategic priorities and goals
  • 47.
    Water Quality inthe Elk Valley Advancing innovative technologies 47 Saturated Rock Fill Nitrate Reduction Elk Valley Water Quality Plan developed with government, Indigenous Peoples and communities to address water quality challenges
  • 48.
    Elk Valley WaterTreatment Clear path forward for improving water quality 48 Millions of Litres per Day
  • 49.
    Tailings Management Our approach •Full implementation of the Global Industry Standard on Tailings Management underway with full conformance by 2023 • Management and emergency response aligned with Towards Sustainable Mining Protocols • Enhanced transparency & disclosure ‒ Facilities inventory posted www.teck.com ‒ Detailed response to the tailings facility enquiry from the Church of England Pensions Board and Swedish Council on Ethics for the AP Funds Teck has comprehensive systems and procedures in place based on 6 levels of protection: Surveillance Technology 1 Internal Inspections 2 Annual Dam Safety Inspections 3 Internal Governance Reviews 4 Detailed Third-Party Reviews 5 Independent Tailings Review Boards 6 49
  • 50.
    • Agreements inplace at all mining operations within or adjacent to Indigenous Peoples’ territories • $192 million to Indigenous businesses in 2020 through procurement • 72% of total local employment in 2020 • $19 million in community investment in 2020 • Zero significant incidents that were human rights related in 2020 • Released updated Human Rights Policy in April 2020, first established in 2012 Relationships with Communities and Indigenous Peoples, Respecting Human Rights 50 Related SASB1 Metric: EM-MM-210a.3 | Link to Data Related SASB1 Metric: EM-MM-210b.1 | Link to Data
  • 51.
    Inclusion and Diversity •Inclusion and Diversity: committed to improve representation of under-represented groups in our workforce: women, Indigenous, Asian, Black, and all people of colour (BIPOC), persons with disabilities, and members of the LGBTQ+ community • Gender Diversity: 20% of workforce are women; 25% of Board of Directors, including the Chair; 29% of new hires • Workplace Flexibility: family-friendly policies and programs in place, expanding remote working policy • Employee engagement and feedback: 24-hour hotline, site-based inclusion and diversity chairs, leadership development programs 51 Range of projects in place to promote inclusion and diversity, including STEM leadership courses at Trail Operations
  • 52.
    • Compensation programis linked to sustainability and health and safety performance through individual, department and company-wide objectives. • Objectives related to climate change, communities and Indigenous Peoples, tailings and water management and others can affect bonuses by at least 10%–20%. • Incentive compensation of the CEO and senior officers includes sustainability performance indicators. 52 Sustainability Performance and Compensation
  • 53.
    Questions and FurtherInformation ESG resources for investors Please see our Disclosure Portal and Sustainability Information for Investors 53 • Sustainability reporting for 20 years in Core accordance with the Global Reporting Initiative (GRI) Standards and G4 Mining and Metals Sector Disclosures • Report is aligned with Sustainability Accounting Standards Board (SASB) • Task Force for Climate-Related Financial Disclosure (TCFD) aligned report “Portfolio Resilience in the Face of Climate Change” published in 2019 • Detailed COVID-19 Response page
  • 54.
    QB2 Project Photo: Concentrator- Aerial view of grinding lines with shell for ball mill #4 being lowered into place
  • 55.
     Vast, longlife deposit  Very low strip ratio  Low all in sustaining costs (AISC)1  Potential to be a top 20 producer  High grade, clean concentrates  Significant brownfield development  Community agreements in place and strong local relationships  Project has surpassed the halfway point  Expansion potential (QB3) with potential to be a top 5 producer Highlights Chile Peru Bolivia Tarapacá Region Arica y Parinacota Region Antofagasta Region Arica Iquique QB2 Teck, SMM, SC, ENAMI Collahuasi Anglo American, Glencore, Mitsui El Abra Freeport-McMoRan, Codelco Radomiro Tomic Codelco Chuquicamata Codelco Ministro Hales Codelco Cerro Colorado BHP Spence BHP Centinela Antofagasta, Marubeni Gabriela Mistral Codelco Escondida BHP, Rio Tinto, Mitsubishi Argentina Sierra Gorda KGHM, SMM, SC Location QB2 Project Executing on a world class development asset 55
  • 56.
    QB2 Project Update 56 •Overall project progress surpassed the halfway point in April • Pace of construction trending upwards, setting new weekly records over the last month • Project continues to manage through the current COVID-19 wave in Chile, with strict protocols in place and continuously enhanced First production expected in H2 2022 QB2 is a long-life, low-cost operation with major expansion potential Photo: Lowering of shell for ball mill #3” at QB2.
  • 57.
    QB2’s Competitive CostPosition Competitive Operating Cost & Capital Intensity Low Cash Cost Position 57 Based on Sanction Case (Including 199 Mt Inferred Resources) Refer to “QB2 Project Economics Comparison” and “QB2 Reserves and Resources Comparison” slides for Reserve Case (Excluding Inferred Resources) The description of the QB2 project Sanction Case includes inferred resources that are considered too speculative geologically to have the economic considerations applied to them that would enable them to be categorized as mineral reserves. Inferred resources are subject to greater uncertainty than measured or indicated resources and it cannot be assumed that they will be successfully upgraded to measured and indicated through further drilling. C1 Cash Cost2 & AISC3 Curve1 (US$/lb, 2023E) • Given the exceptionally low strip ratio, consistent grade profile, compact site layout, and high level of automation, QB2 is expected to have attractive and relatively stable operating costs • Exceptional strip ratio of 0.70 LOM, meaning for every one tonne of ore mined, only 0.70 tonnes of waste need to be mined (0.44 over first 5 full years) − Compares to other world class asset strip ratios of 2.6 for Escondida, 3.0 for Antamina, and 3.7 for Collahuasi1 − Major benefit to sustaining capital since it reduces mobile fleet size and replacement costs Antamina Escondida Collahuasi - 0.50 1.00 1.50 2.00 2.50 3.00 3.50 - 25% 50% 75% 100% US$/lb Cumulative Paid Metal (%) AISC C1 Cash Cost QB2 (first 5 full years) US$1.38/lb QB2 (first 5 full years) US$1.28/lb
  • 58.
    Vast, Long LifeDeposit at Quebrada Blanca Significant extension potential • QB2 uses only ~18% of the 2020 reserve and resource tonnage1 • Deposit is capable of supporting a very long mine life based on throughput rate of 143 ktpd2 by utilizing further tailings capacity at already identified sites • Actively evaluating potential options to exploit value of full resource through mill expansion and / or mine life extension • Beyond the extensive upside included in the defined QB deposit, the district geology is highly prospective for exploration discovery and resource addition; mineralization is open in multiple directions 58 . 1,259 1,202 1,401 1,432 1,325 1,472 1,891 3,621 2,141 3,393 3,492 3,119 2017 AIF 2018 Resource Update 2019 AIF 2020 AIF Inferred M&I (Exclusive) P&P Resources (excluding reserves) +94%3 Reserve and Resource Tonnage (Mt) 1 Based on Sanction Case (Including 199 Mt Inferred Resources) Refer to “QB2 Project Economics Comparison” and “QB2 Reserves and Resources Comparison” slides for Reserve Case (Excluding Inferred Resources) The description of the QB2 project Sanction Case includes inferred resources that are considered too speculative geologically to have the economic considerations applied to them that would enable them to be categorized as mineral reserves. Inferred resources are subject to greater uncertainty than measured or indicated resources and it cannot be assumed that they will be successfully upgraded to measured and indicated through further drilling.
  • 59.
    QB2 Project EconomicsComparison 59 The description of the QB2 project Sanction Case includes inferred resources that are considered too speculative geologically to have the economic considerations applied to them that would enable them to be categorized as mineral reserves. Inferred resources are subject to greater uncertainty than measured or indicated resources and it cannot be assumed that they will be successfully upgraded to measured and indicated through further drilling. 7 8 Reserve Case1 Sanction Case2 Mine Life Years 28 28 Strip Ratio First 5 Full Years 0.16 0.44 LOM3 0.41 0.70 C1 Cash Cost4 First 5 Full Years US$/lb $1.29 $1.28 LOM3 US$/lb $1.47 $1.37 AISC5 First 5 Full Years US$/lb $1.40 $1.38 LOM3 US$/lb $1.53 $1.42
  • 60.
    QB2 Reserves andResources Comparison Reserve Case (as at Nov. 30, 2018)1,2 Sanction Case (as at Nov. 30, 2018)2,4 60 Reserves Mt Cu Grade % Mo Grade % Silver Grade ppm Proven 409 0.54 0.019 1.47 Probable 793 0.51 0.021 1.34 Reserves 1,202 0.52 0.020 1.38 Resources (Exclusive of Reserves)5 Mt Cu Grade % Mo Grade % Silver Grade ppm Measured 36 0.42 0.014 1.23 Indicated 1,436 0.40 0.016 1.13 M&I (Exclusive) 1,472 0.40 0.016 1.14 Inferred 3,194 0.37 0.017 1.13 + Inferred in SC pit 199 0.53 0.022 1.21 Reserves Mt Cu Grade % Mo Grade % Silver Grade ppm Proven 476 0.51 0.018 1.40 Probable 924 0.47 0.019 1.25 Reserves 1,400 0.48 0.018 1.30 Resources (Exclusive of Reserves)3 Mt Cu Grade % Mo Grade % Silver Grade ppm Measured 36 0.42 0.014 1.23 Indicated 1,558 0.40 0.016 1.14 M&I (Exclusive) 1,594 0.40 0.016 1.14 Inferred 3,125 0.38 0.018 1.15
  • 61.
    ENAMI Interest inQuebrada Blanca Organizational Chart • The government of Chile owns a 10% non-funding interest in Compañía Minera Teck Quebrada Blanca S.A. (CMTQB) through its state-run minerals company, Empresa Nacional de Minería (ENAMI) • ENAMI has been a partner at QB since 1989 and is a 10% shareholder of Carmen de Andacollo • ENAMI is not required to fund QB2 development costs • Project equity funding in form of: ‒ 25% Series A Shares ‒ 75% Shareholder Loans • Until shareholder loans are fully repaid, ENAMI is entitled to a minimum dividend, based on net income, that approximates 2.0-2.5% of free cash flow ‒ Thereafter, ENAMI receives 10% of dividends / free cash flow 61 . CMTQB TRCL ENAMI Teck 10% (Series B) 100% 90% (Series A) JVCo SMM 66.67% 100% 33.33% SC 83.33% 16.67% Chile HoldCo QB1 / QB2 / QB3
  • 62.
    Quebrada Blanca AccountingTreatment Balance Sheet Cash Flow • 100% of project spending included in property, plant and equipment • Debt includes 100% of project financing • Total shareholder funding to be split between loans and equity approximately 75%/25% over the life of the project • Sumitomo (SMM/SC)1 contributions will be shown as advances as a non-current liability and non-controlling interest as part of equity • Teck contributions, whether debt or equity, eliminated on consolidation • 100% of project spending included in capital expenditures • Sumitomo1 contribution recorded within financing activities and split approximately 75%/25% as: ‒ Loans recorded as “Advances from Sumitomo” ‒ Equity recorded as “Contributions from Non-Controlling Interests” • 100% of draws on project financing included in financing activities • After start-up of operations ‒ 100% of profit in cash flow from operations ‒ Sumitomo’s1 30% and ENAMI’s 10% share of distributions included in non-controlling interest 62 Income Statement • Teck’s income statement will include 100% of QB’s revenues and expenses • Sumitomo’s1 30% and ENAMI’s 10% share of profit will show as profit attributable to non-controlling interests
  • 63.
    Endnotes: QB2 Project Slide55: QB2 Project 1. All-in sustaining costs (AISC) are net cash unit costs (also known as C1 cash costs) plus sustaining capital expenditures. Net cash unit costs are calculated after cash margin by-product credits assuming US$10.00/lb molybdenum and US$18.00/oz silver. Net cash unit costs for QB2 include stripping costs during operations. AISC, Net cash unit cost and cash margins for by-products are non-GAAP financial measures which do not have a standardized meanings prescribed by International Financial Reporting Standards (IFRS) or Generally Accepted Accounting Principles in the United States. These measures may differ from those used by other issuers and may not be comparable to such measures as reported by others. These measures are meant to provide further information about our financial expectations to investors. These measures should not be considered in isolation or used in substitute for other measures of performance prepared in accordance with IFRS. For more information on our calculation of non-GAAP financial measures please see our Management’s Discussion and Analysis for the year ended December 31, 2018, which can be found under our profile on SEDAR at www.sedar.com. Slide 57: QB2’s Competitive Cost Position 1. Source: Wood Mackenzie. Average 2021-2040. 2. C1 cash costs (also known as net cash unit costs) are presented after by-product credits assuming US$10.00/lb molybdenum and US$18.00/oz silver. C1 cash costs for QB2 include stripping costs during operations. Net cash unit costs and C1 cash costs are non-GAAP financial measures. See “Non-GAAP Financial Measures” slides. 3. All-in sustaining costs (AISC) are net cash unit costs (also known as C1 cash costs) plus sustaining capital expenditures. Net cash unit costs are calculated after cash margin by-product credits assuming US$10.00/lb molybdenum and US$18.00/oz silver. Net cash unit costs for QB2 include stripping costs during operations. AISC, net cash unit cost and cash margins for by-products are non-GAAP financial measures. See “Non-GAAP Financial Measures” slides. Slide 58: Vast, Long Life Deposit at Quebrada Blanca 1. Reserves and resources as at December 31, 2020. 2. Based on Sanction Case mine plan tonnage. 3. Resources are reported separately from, and do not include that portion of resources classified as reserves. Slide 59: QB2 Project Economics Comparison 1. Based on go-forward cash flow from January 1, 2017. Based on all equity funding structure. 2. Based on go-forward cash flow from January 1, 2019. Based on optimized funding structure. 3. Life of Mine annual average figures exclude the first and last partial years of operations. 4. C1 cash costs are presented after by-product credits assuming US$10.00/lb molybdenum and US$18.00/oz silver. Net cash unit costs are consistent with C1 cash costs. C1 cash costs for QB2 include stripping costs during operations. Net cash unit costs and C1 cash costs are non-GAAP financial measures. See “Non-GAAP Financial Measures” slides. 5. All-in sustaining costs (AISC) are net cash unit costs (also known as C1 cash costs) plus sustaining capital expenditures. Net cash unit costs are calculated after cash margin by-product credits assuming US$10.00/lb molybdenum and US$18.00/oz silver. Net cash unit costs for QB2 include stripping costs during operations. AISC, net cash unit cost and cash margins for by-products are non-GAAP financial measures. See “Non-GAAP Financial Measures” slides. Slide 60: QB2 Reserves and Resources Comparison 1. Mineral reserves are constrained within an optimized pit shell and scheduled using a variable grade cut-off approach based on NSR cut-off US$13.39/t over the planned life of mine. The life-of-mine strip ratio is 0.41. 2. Both mineral resource and mineral reserve estimates assume long-term commodity prices of US$3.00/lb Cu, US$9.40/lb Mo and US$18.00/oz Ag and other assumptions that include: pit slope angles of 30–44º, variable metallurgical recoveries that average approximately 91% for Cu and 74% for Mo and operational costs supported by the Feasibility Study as revised and updated. 3. Mineral resources are reported using a NSR cut-off of US$11.00/t and include 23.8 million tonnes of hypogene material grading 0.54% copper that has been mined and stockpiled during existing supergene operations. 4. Mineral reserves are constrained within an optimized pit shell and scheduled using a variable grade cut-off approach based on NSR cut-off US$18.95/t over the planned life of mine. The life-of-mine strip ratio is 0.70. 5. Mineral resources are reported using a NSR cut-off of US$11.00/t outside of the reserves pit. Mineral resources include inferred resources within the reserves pit at a US$ 18.95/t NSR cut-off and also include 23.8 million tonnes of hypogene material grading 0.54% copper that has been mined and stockpiled during existing supergene operations. Slide 62: Quebrada Blanca Accounting Treatment 1. Sumitomo Metal Mining Co. Ltd. and Sumitomo Corporation are collectively referred to as Sumitomo. 63
  • 64.
  • 65.
    Zafranal Cu-Au Porphyry(80%) Located in the mineral rich Southern Peru Copper Belt 65 Project Details Ownership 80% Teck, 20% Mitsubishi Materials Corporation Location Castilla and Caylloma Provinces, Peru Deposit Type Copper-gold porphyry Products Copper-gold concentrate Metal Production Recovered Cu (ktpa) / Au (kozpa) C1 Cash Costs (US$/lb)1 AISC (US$/lb)1 First 5 years 125 42 $1.18 $1.30 First 10 years 96 34 $1.34 $1.43 LOM 78 30 $1.50 $1.57 Ore Throughput 66 ktpd; 440.7Mt LOM total Initial Capex $1,230 million Reserves2,3 Tonnage Grade Contained Metal Mt Cu (%) Au (g/t) Cu (kt) Au (koz) Proven 408.8 0.388 0.071 1,587 939 Probable 32.0 0.216 0.046 68 47 Total P&P 440.7 0.376 0.070 1,655 986 Resources2,4 (exclusive of reserves) Measured 5.1 0.19 0.04 10 6 Indicated 2.3 0.21 0.05 5 4 Total M&I 7.4 0.20 0.04 15 10 Inferred 62.8 0.24 0.10 150 212 Located in a mining-friendly jurisdiction with established infrastructure and a skilled workforce, the Zafranal Copper-Gold Project covers a large area of ~72,300 ha hosting district scale upside potential. With 440.7Mt of reserves and a minimum 19-year mine life, the project will produce an average copper equivalent production of 133ktpa in the first 5 years. Zafranal Teck & MMC Cerro Verde Freeport McMoran Tia Maria Southern Copper Antapaccay Glencore Cuajone Southern Copper Quellaveco Anglo American Toquepala Southern Copper Arequipa San Rafael Minsur Cusco Las Bambas MMG Tintaya Glencore Constancia Hudbay 0 30 km Port of Matarani <1,500m 1,500 - 3,000m 3,000 - 4,500m >4500m Peru
  • 66.
    Zafranal Cu-Au Porphyry(80%) Feasibility complete, SEIA submission in 20211 • 19 year life of mine • Further upside potential within the deposit footprint and in the district Quality Investment • Attractive front-end grade profile • Mid range forecast LOM C1 cash costs3 • Competitive capital intensity Mining Jurisdiction • Strong support from Peruvian regulators including MINEM and SENACE • Engaged with all communities Path to Value Realization: • Continue to make prudent investments to de-risk the project improving capital and operating costs • SEIA submission in H1 2021 66 Peru US$1,026M After-Tax NPV8 23.3% After-Tax IRR US$1,230M Initial Capex 2.3 Year Payback Period US$1.18/lb C1 Cash Cost3 1st 5 Years2 0.57% Cu Average Head Grade 1st 5 Years2 19 Year Mine Life US$620M Average EBITDA3 1st 5 Years2 Q1 Q2 Q3 Q4 Q1 Q2 Q3 Q4 Q1 Q2 Q3 Q4 Q1 Q2 Q3 Q4 2021 2022 2023 2026 SEIA Submission Evaluation Process Virtual Public Hearings Final Review Process SEIA Approval Sanction Construction 3 years Production Pre-sanction Engineering (3,000) (2,000) (1,000) - 1,000 2,000 3,000 (1,200) (800) (400) - 400 800 1,200 2022 2023 2024 2025 2026 2027 2028 2029 2030 2031 2032 2033 2034 2035 2036 2037 2038 2039 2040 2041 2042 2043 Capital Cost FCF EBITDA Cumulative FCF (RHS) Illustrative Timeline Annual Capital, EBITDA3 and Cashflow (US$M)
  • 67.
    San Nicolás Cu-Zn(Ag-Au) VHMS (100%) Located in the mineral rich Mexican Silver Belt 67 Located in a well-established mining district in Mexico with established infrastructure and a skilled workforce, the San Nicolás Project represents one of the world’s most significant undeveloped VHMS deposits. The Prefeasibility Study envisions processing 107.3 Mt of ore over a 15-year mine life. Project Details Ownership 100% Teck Location Zacatecas State, Mexico Deposit Type Cu-Zn rich VHMS Products Copper & Zinc concentrate with gold and silver by-products Avg. Metal Production Cu (ktpa) Zn (ktpa) Au (kozpa) Ag (kozpa) C1 Cash Costs (US$/lb Cu)1 First 5 full years 63.2 147.4 30.7 3,286 ($0.18) First 10 full years 62.1 114.3 22.4 2,504 $0.18 LOM 65.8 91.0 17.5 2,072 $0.42 Ore Throughput 21 ktpd; 107 Mt LOM total Initial Capex US$814 million Reserves2,3 Tonnage Grade Contained Metal Mt Cu (%) Zn (%) Au (g/t) Ag (g/t) Pb (%) Cu (kt) Zn (kt) Au (koz) Ag (koz) Pb (kt) Proven 47.7 1.26 1.61 0.41 23.93 0.12 599.6 766.6 628.4 36,713 57.2 Probable 57.5 1.01 1.37 0.39 20.91 0.09 583.4 788.2 715.7 38,665 52.9 Total P&P 105.2 1.12 1.48 0.4 22.28 0.1 1,183.0 1,554.8 1,344.1 75,378 110.1 Resources2,3,4 Measured 0.5 1.35 0.39 0.08 6.4 0.01 7.1 2 1.3 107 0.1 Indicated 6.1 1.17 0.71 0.2 11.86 0.05 71 43.2 38.3 2,315 3.1 Total M&I 6.6 1.18 0.69 0.19 11.43 0.05 78 45.3 39.6 2,423 3.2 Inferred 4.9 0.94 0.62 0.13 9.26 0.05 46.3 30.7 20.4 1,469 2.4 Mexico
  • 68.
    San Nicolás Cu-Zn(Ag-Au) VHMS (100%) Prefeasibility complete and Environmental Impact Assessment nearing completion1 • One of the world’s most significant undeveloped VMS deposits • Updated Resources Statement Quality Investment • Expect C1 cash costs3 in the 1st quartile • Competitive capital intensity • Co-product Zn and Au & Ag credits Mining Jurisdiction • Well-established mining district in Mexico • Community engagement well underway • Social-environmental studies advancing Path to Value Realization: • Completed multi-disciplinary design, engineering, and baseline environmental and social field studies in 2020 • Completion of a Prefeasibility and EIA in H1 2021 Annual Capital, EBITDA3 and Cashflow (US$M) US$1,499M After-Tax NPV8 34.0% After- Tax IRR US$814M Initial Capex 2.5 Year Payback Period US$(0.18)/lb C1 Cash Costs3 1st 5 Years2 1.07% Cu Average Head Grade 1st 5 Years2 15 Year Mine Life US$489M Average EBITDA3 1st 5 Years2 68 Mexico Q1 Q2 Q3 Q4 Q1 Q2 Q3 Q4 Q1 Q2 Q3 Q4 Q1 Q2 Q3 Q4 2021 2022 2023 2025 MIA Submission MIA Approval Sanction Construction 2 years Production Commissioning Start FS ETJ Submission ETJ Approval FS Complete Site prep. & Adv. Eng. Q1 2026 Illustrative Timeline (2,000) (1,000) - 1,000 2,000 3,000 4,000 (600) (400) (200) - 200 400 600 800 2023 2024 2025 2026 2027 2028 2029 2030 2031 2032 2033 2034 2035 2036 2037 2038 2039 Capital Cost FCF EBITDA Cumulative FCF (RHS)
  • 69.
    QB3 Cu-Mo-Ag (60%Interest) Creating the platform to realize the potential in the vast resource Path to Value Realization: • Preparing for prefeasibility study with various paths to expansion including 50% increase, doubling and tripling of throughput • Solid environmental, social and regulatory programs already in place for QB2 69 Long Life Asset • Top global copper resources by size • R&R has increased by 94% since 2017 • Mineralization open in multiple directions Quality Brownfield Growth Opportunity • Reduced execution risk • Low capital intensity • Greater economies of scale Mining Jurisdiction • Established regional relationships • Debottlenecking and/or twinning of existing infrastructure QB Hypogene Reserve and Resource Tonnage Grades Mt Cu (%) Ag (g/t) Mo (%) Reserves1,2 Total P&P 1,432.3 0.51 1.4 0.021 Resources1,3 (exclusive of reserves) Measured 929.0 0.37 1.1 0.013 Indicated 2,692.2 0.36 1.1 0.017 Total M&I 3,621.2 0.37 1.1 0.016 Inferred 3,119.3 0.35 1.1 0.017 Chile QB2 – Aerial View of the Concentrator Area
  • 70.
    Galore Creek Cu-Au-Ag(50% Interest) Prefeasibility Study started in Q1 2021 Long Life Asset • Large high grade copper-gold system • Legacy and Bountiful zones discovered in 2013-14 reflected in updated Resource Quality Investment and Partnership • Expect C1 cash costs4 in the 1st quartile • Strong technical, commercial, and community expertise from Partners Path to Value Realization: • Multi-disciplinary engineering studies and community engagement work planned in support of prefeasibility • Focus is on reducing cost and risk related to access 70 Stable Jurisdiction • Improving infrastructure in Golden Triangle including power, roads and port facilities • Tahltan Nation Participation Agreement Resources1,2,3 Tonnage Grades Mt Cu (%) Au (g/t) Ag (g/t) Measured 256.8 0.72 0.36 5.8 Indicated 846.7 0.39 0.23 3.7 Total (M+I) 1,103.5 0.47 0.26 4.2 Inferred 198.1 0.27 0.21 2.7 Canada Galore Creek Valley
  • 71.
    NuevaUnión Cu-Mo-Au-Ag (50%Interest) Increased value through partnership Path to Value Realization: • Continue to build on positive social and environmental baseline aspects of the project • Translate opportunities identified in the feasibility study into improved project economics 71 Long Life Asset • Top five of the largest undeveloped Cu-Au projects in the Americas • Further district potential Quality Investment Opportunity • Phased development will allow funding of expansions through project cash flows • Strong partnership arrangement Mining Jurisdiction • Permitting pathway well defined • Strong familiarity with the region and established community relationships La Fortuna Deposit Tonnage Grades Mt Cu (%) Ag (g/t) Au (g/t) Reserves1,3 Total P&P 682.2 0.51 0.8 0.47 Resources1,3,4 (exclusive of reserves) Measured 9.6 0.42 0.9 0.47 Indicated 236.7 0.51 1.1 0.59 Total (M+I) 246.3 0.51 1.1 0.59 Inferred 479.7 0.43 1.0 0.40 Chile Relincho Deposit Tonnage Grades Mt Cu (%) Ag (g/t) Mo (%) Reserves1,2 Total P&P 1,553.8 0.35 1.5 0.016 Resources1,2 (exclusive of reserves) Measured 319.0 0.19 1.0 0.006 Indicated 463.0 0.26 1.2 0.009 Total (M+I) 782.0 0.23 1.12 0.008 Inferred 724.7 0.36 1.3 0.012 Resource Definition Drilling
  • 72.
    Mesaba Cu-Ni-PGM, Co-Au-Ag(100% Interest) Top 3 nickel contained-in-sulphide deposit globally1 Path to Value Realization: • Baseline environmental studies, technical programs, and community engagement work proceeding • Assessment of district development synergies 72 Long Life Asset • Large Cu-Ni-PGE-Co magmatic deposit • Substantial maiden Resource Statement at 0.703% CuEq grade2 Quality Investment Opportunity • Expect C1 cash costs5 in the 1st quartile • Production of a marketable copper and bulk copper-nickel concentrate Stable Jurisdiction • Located in historic Mesabi Iron Range • Building a strong technical, commercial, and community team in Minnesota Resources3,4 Tonnage Grades Mt Cu (%) Ni (%) Co (%) Au (g/t) Ag (g/t) Pt (g/t) Pd (g/t) Measured 244.1 0.47 0.11 0.009 0.03 1.2 0.041 0.120 Indicated 1,334.1 0.42 0.10 0.007 0.03 1.0 0.034 0.093 Total (M+I) 1,578.2 0.43 0.10 0.01 0.008 1.1 0.035 0.097 Inferred 1,461.9 0.35 0.09 0.01 0.006 1.0 0.04 0.127 USA Orebody Knowledge
  • 73.
    Schaft Creek Cu-Mo-Au-Ag(75%) Assessing options for this large Cu-Mo-Au-Ag deposit Path to Value Realization: • Multi-Year Area Based permits in place • Evaluating staged development options • Continuing baseline environmental and social programs 73 Long Life Asset • Large Cu-Mo-Au-Ag porphyry deposit • Good property wide exploration potential • Updated Resource Statement Quality Investment Opportunity • Expect competitive cash operating costs • Solid engineering and design work on which to improve investment case Stable Jurisdiction • Improving infrastructure in Golden Triangle including power, road and port facilities • Relationship with Tahltan Nation Resources1,2 Tonnage Grades Mt Cu (%) Au (g/t) Ag (g/t) Mo (%) Measured 166.0 0.32 0.2 1.5 0.021 Indicated 1,127.2 0.25 0.15 1.2 0.016 Total (M+I) 1,293.2 0.26 0.16 1.2 0.017 Inferred 316.7 0.19 0.14 1.1 0.019 Canada Exploration Site Access and Logistic
  • 74.
    Endnotes: Portfolio ofCopper Growth Options Slide 65: Zafranal Cu-Au Porphyry (80%) 1. C1 cash cost and All-In Sustaining Cost (AISC) with by-product credits calculated at: US$3.50/lb Cu and US$1,400/oz Au. All values exclude first and last partial years of production. C1 cash cost and AISC are non-GAAP financial measures. See “Non-GAAP Financial Measures” slides. 2. Mineral Reserves and Resources from Teck’s 2020 AIF. Estimates were prepared assuming metal prices of US$3.00/lb Cu and US$1,200/oz Au, variable metallurgical recoveries up to 89.5% for copper and up to 56% for gold and pit slope angles of 30 – 41.7 degrees. 3. Mineral Reserves are reported using a variable Net Smelter Return cut-off of US$6.10 to 6.35/t averaging US$6.11/t. The life-of-mine strip ratio is 1.14. 4. Mineral Resources are constrained by a pit shell developed using Whittle™ software considering similar assumptions as for Reserves and use a 0.12% Cu cut-off for Supergene and Hypogene materials. Slide 66: Zafranal Cu-Au Porphyry (80%) 1. Financial summary based on At-Sanction Economic Assessment using: US$3.50/lb Cu and US$1,400/oz Au and US$18/oz Ag. Detailed Engineering, Permitting and Project Set-up costs not included. All calendar dates and timeline are preliminary potential estimates. 2. First five full years of production. 3. EBITDA and C1 cash cost are non-GAAP financial measures. See “Non-GAAP Financial Measures” slides. Slide 67: San Nicolás Cu-Zn (Ag-Au) VHMS (100%) 1. C1 cash cost with by-product credits, calculated at : US$3.50/lb Cu, US$1.15/lb Zn, US$1,400/oz Au and US$18/oz Ag. All values exclude first and last partial years of production. C1 cash cost is a non-GAAP financial measure. See “Non-GAAP Financial Measures” slides. 2. Mineral Reserves and Resources from Teck’s 2020 AIF. Estimates were prepared assuming metal prices of US$3.00/lb Cu, US$1.10/lb Zn, US$1,300/oz Au and US$20/oz Ag. 3. The estimates assume different net smelter return cut-offs for low zinc/copper ores and high zinc/copper ores, respectively, of US$9.71 per tonne and US$13.15/tonne net smelter return based on an estimate of the marginal cost of production for the relevant ore. 4. Mineral Resources estimates were confined within a conceptual open pit shell using Whittle™ software. Inputs to the pit shell included direct mining costs of US$1.27/t moved; process costs of US$10.20/t milled which includes G&A costs; variable concentrate metallurgical recovery equations by element and geomet domain; and inter-ramp angles between 42 and 46 degrees. Reported mineral resources are exclusive of reserves. Slide 68: San Nicolás Cu-Zn (Ag-Au) VHMS (100%) 1. Financial summary based on At-Sanction Economic Assessment using: US$3.50/lb Cu, US$1.15/lb Zn, US$1,400/oz Au and US$18/oz Ag. Go-forward costs of Prefeasibility, Detailed Engineering, Permitting and Project Set-up costs not included. All calendar dates and timeline are preliminary potential estimates. 2. First five full years of production (Year 2 – Year 6). 3. EBITDA and C1 cash cost are non-GAAP financial measures. See “Non-GAAP Financial Measures” slides. Slide 69: QB3 Cu-Mo-Ag (60% Interest) 1. Mineral Reserves and Resources from Teck’s 2020 AIF. Estimates were prepared assuming metal prices of US$3.00/lb Cu and US$ 9.4/lb Mo, pit slope angles of 30 – 42 degrees and variable metallurgical recoveries. 2. Mineral Reserves estimates are based on a variable Net Smelter Return cut-off and reported at an average value of US$19.39/t. The life-of-mine strip ratio is 0.7:1. 3. Mineral Resources are constrained by a pit shell developed using Whittle™ software considering similar assumptions as for Reserves. Resources are reported at Net Smelter Return cut-off of US$ 8.35/t. Slide 70: Galore Creek Cu-Au-Ag (50% Interest) 1. Mineral Resources are estimated using metal price assumptions of US$3.00/lb copper, US$1,200/oz gold and US$20/oz silver using a US$8.84/t Net Smelter Return cut-off. 2. Mineral Resources are reported within a constraining pit shell developed using Whittle™ software. Inputs to the pit optimization include the following assumptions: metal prices; pit slope angles of 36.3–51.9º; variable metallurgical recoveries averaging 90.6% for copper, 73.1% for gold and 64.5% for silver. 3. Mineral Resources have been estimated using a US$8.84/t Net Smelter Return cut-off, which are based on cost estimates from a 2011 Prefeasibility Study. Assumptions consider that major portions of the Galore Creek Project are amenable for open pit extraction. 4. C1 cash cost is a non-GAAP financial measure. See “Non-GAAP Financial Measures” slides. 74
  • 75.
    Endnotes: Portfolio ofCopper Growth Options Slide 71: NuevaUnión Cu-Mo-Au-Ag (50% Interest) 1. Mineral Reserves and Resources from Teck’s 2020 AIF. 2. Relincho Mineral Reserves and Mineral Resources are reported using an average Net Smelter Return cut-off of US$11.00/t and US$6.72/t, respectively, and assuming metal prices of US$ 3.00/lb Cu and US$10.00/lb Mo and US$18.00/oz Ag. 3. La Fortuna Mineral Reserves and open pit Mineral Resources are reported using an average Net Smelter Return cut-off of US$10.55/t and US$9.12/t, respectively, and assuming metal prices of US$3.00/lb Cu and US$1,200/oz Au. 4. Mineral Resources outside of the Mineral Reserve pit are defined using a conceptual underground mining envelope based on same price assumptions. Slide 72: Mesaba Cu-Ni-PGM, Co-Au-Ag (100% Interest) 1. Ranking of nickel contained in undeveloped global nickel sulphide deposits derived from SNL (S&P Global), company websites and technical reports on SEDAR. 2. Copper equivalent calculations based on current Measured & Indicated Resources only adjusted for recoveries of by-product metals.​ 3. Mineral Resources are reported at a cut-off of 0.2% copper, equivalent to a Net Smelter Return cut-off of US$5.24/t using metal price assumptions of US$ 3.00/lb copper, US$ 7.60/lb nickel, US$1,250/oz gold, US$20.00/oz silver, $23.00/lb cobalt, $900/oz palladium, and $1,100/oz platinum. 4. Mineral Resources are reported within a constraining pit shell developed using Whittle™ software. Inputs to the pit optimization include the following assumptions: metal prices; inter-ramp pit slope angles of 37º, 40º, and 49º for overburden, sedimentary, and intrusive lithologies respectively; and average metallurgical recoveries of 93.2% for Cu, 84.0% for Ni, 41.2% for Co, 59.3% for Au, 67.5% Ag, 59.3% for Pd, and 63.8% for Pt. 5. C1 cash cost is a non-GAAP financial measure. See “Non-GAAP Financial Measures” slides. Slide 73: Schaft Creek Cu-Mo-Au-Ag (75%) 1. Mineral Resources are estimated using metal price assumptions of US$3.00/lb copper, US$10.00/lb molybdenum, US$1,200/oz gold, and US$20/oz silver using a US$4.31/t Net Smelter Return cut-off. 2. Mineral Resources are reported within a constraining pit shell developed using Whittle™ software. Inputs to the pit optimization include the following assumptions: metal prices; pit slope angles of 40–44º; metallurgical recoveries reflective of prior test work that average 86.6% for copper, 73.0% for gold and 48.3% for silver. 75
  • 76.
  • 77.
    RACE21TM Our innovation-driven businesstransformation program 77 • Unify and modernize Teck’s core systems • Establish technology foundation that facilitates deployment of Connect and Automate reliably and at scale • For example: Wireless site infrastructure to support automation, sensing, site communications, information access, pit-to-port integration and advanced analytics • Accelerate and scale autonomy program • Transformational shift in safety • Reduce per-tonne mining costs with smaller fleets • Provide innovation platform to enable implementation of advanced analytics to drive cycle time improvement & predictive maintenance Renew Automate
  • 78.
    RACE21TM Our innovation-driven businesstransformation program 78 • Link disparate systems into a collaborative digital platform with powerful tools for sensing and analyzing in real time • For example: Dynamic and predictive models to reduce variability, leading to significant improvements in throughput and recovery • The natural implication of Renew, Automate, and Connect is we can re-imagine what it means to work at Teck and re-design our operating model to attract, recruit, train and retain the workforce of the future Connect Empower
  • 79.
    Significant Value HasBeen Captured Through RACE21TM 79 COST Reduced operational costs PROFITABILITY Step-change impact to profitability SAFETY Transformational safety impact PRODUCTIVITY Increased productivity through technology and innovation Advanced data analytics and artificial intelligence to reduce risk of heavy vehicle / light vehicle interactions Increased copper throughput by ~7% and recovery by ~2% at Highland Valley Copper Advanced analytical tools contributed to record haul truck productivity across our major mine sites Blending optimization tools used at Trail Operations to reduce costs
  • 80.
  • 81.
    Supply Continues tobe at Risk; Copper Demand Improves • Demand for imported cathode into China up 36% in 2020, down 7% YTD February 2021 on higher prices and higher scrap imports up 60% • Demand outlook ex-China improving • 2021 mine production to date ~300 kt or ~7%, similar to 2020 • Concentrate market tightness continues into 2021; Spot terms lowest since 2011, COVID-19 restrictions continue to impact 2021 supply • Mine growth to resume in 2022 and peak in 2024, with multi-year gap for next projects due to timeline to execution • Global stimulus positive for metals demand, risk that further lockdowns could affect short-term consumer demand 81
  • 82.
    Copper Market Raw materialsweigh on downstream production • Demand for raw materials and mine disruptions keep concentrate demand high ‒ Mine production cuts over 1.4 Mt in 2020, continue into Q1 2021 ‒ Chinese smelters to take advanced maintenance in April/May ‒ Spot TC/RC drop to high teens / low 20s • LME/SHFE stocks rise through 2021, but remain at low levels • LME price at near record highs, while Chinese cathode premiums fall • Scrap availability improving on higher prices and change in scrap import classification • Chinese cathode premiums US$38-40 per tonne in Q1 2021; buyers look to scrap to offset higher cathode prices Copper Scrap is 18% of Supply and 20% of Total Demand2 Scrap Demand Increases on Higher Copper Price1 82 Cathode Demand 23.6 Mt Copper Demand 29.6 Mt Wire Rod 74% Billet 13% Cable/Slab 13% Electrical Network 28% Construction 28% Industrial Machinery 11% Consumer & General 21% Transport 12% (600) 400 1,400 2,400 3,400 Jan-19 Jul-19 Jan-20 Jul-20 Jan-21 RMB/Mt Price Spread between #1 Bare Bright Copper and Copper Cathode Rational Price Spread
  • 83.
    • Chinese mineproduction flat to 2024 on lack of resources • Total probable projects: 900 kmt Mine kmt Kamoa – Kakula 535 PT – Freeport (vs 2019) 435 Quebrada Blanca 2 300 Quellaveco to 2024 275 Cobre Panama 252 China to 2024 345 All others (Spence, Chuqui UG, Escondida) 1,090 SXEW Reductions to 2024 (360) Reductions & Closures (654) Mine Production Set To Increase 2.2 Mt By 20241 Includes: 83 Global Copper Mine Production Increasing Slowly 12,000 14,000 16,000 18,000 20,000 22,000 2018 2019 2020 2021 2022 2023 2024 2025 2026 2027 Other China PT Freeport Cobre Panama Quellaveco Quebrada Blanca Kamoa-Kakula New Mines Global Copper Mine Production2 (kt contained)
  • 84.
    84 $0 $10 $20 $30 $40 $50 $60 $70 $80 $90 $100 $110 $120 Annual/Mid Year Spot TC/RCsSpot and Annual Falling1 (US$/lb) Copper Disruptions Continue To Impact Mines Disruptions (kt)2; -1,800 -1,600 -1,400 -1,200 -1,000 -800 -600 -400 -200 0 2005 2007 2009 2011 2013 2015 2017 2019 2021 3.6% 2.7% 4.0% 6.6% 7.0% Run Rate
  • 85.
    Rapid Growth inChinese Copper Smelter Capacity China added 3.2 Mt since 2019 (2.1 Mt still ramping up) 85 Chinese Copper Mine Growth1 (kt) 0 100 200 300 400 2021 137kt 2022 130 kt 2023 25 kt +2.1 Mt of New Smelting Capacity2 (kt blister) 0 100 200 300 400 500 600 700 800 900 1000 2020 510 kt 2021 – 2023 1,615 kt 2023+ 1,900 kt
  • 86.
    Copper Supply Chinese importsshift to concentrates to feed smelter capacity increases 86 Chinese Imports Shift to Concentrates3 (Copper content, kt) 0 2,000 4,000 6,000 8,000 10,000 12,000 2016 2017 2018 2019 2020 2021e 2022e Concentrates Blister Scrap Cathode Chinese Scrap/Blister Imports Fall2 (Copper content, kt) 0 500 1,000 1,500 2,000 2,500 2013 2014 2015 2016 2017 2018 2019 2020 2021e 2022e Blister Scrap • Cathode imports could drop in 2021, after tight concentrates and scrap market in 2020 saw record cathode imports • Concentrates imports will continue to rise on smelter demand • Reclassified scrap/blister could now rise off the lows of 2020
  • 87.
    Copper Metal Stocks Rawmaterial shortages increase cathode demand • Copper prices traded >US$10,000 per tonne in late April, near record high seen in February 2011 • Exchange stocks have fallen 236 kt since March 2020, now equivalent to 6.0 days of global consumption • SHFE stocks decreased ~177 kt since Q1 2020 and saw the lowest seasonal build in over 5 years • Strong copper prices have pushed consumers to scrap markets for lower priced inputs • Over 70% of visible global copper inventories including bonded, are now in China • Underlying stimulus demand remains strong and supply chain inventories remain low across several downstream markets. 87 Daily Copper Prices (US$/mt) and Stocks1 (kt) 0 200 400 600 800 1,000 1,200 1,400 1,600 1,800 $0 $2,000 $4,000 $6,000 $8,000 $10,000 $12,000 2011 2012 2013 2014 2015 2016 2017 2018 2019 2020 2021 LME Stocks Comex SHFE Bonded Estimate Price
  • 88.
    Long Life andStable Assets in Copper 88 Antamina Highland Valley • Performance to date is in line with plan • 2021 guidance of 91,000 to 95,000 tonnes copper • Zinc production guidance remaining high at 95,000 to 100,000 tonnes in 2021 • Performing well and treating harder ores • 2021 guidance of 128,000 to 133,000 tonnes copper • RACE21TM application of processing analytics to optimize throughput and recovery Carmen de Andacollo • Performance to date is in line with plan • 2021 guidance of 46,000 to 51,000 tonnes copper • Lower copper grades in 2021 • RACE21TM application of processing analytics to optimize throughput and recovery Quebrada Blanca • Performing well with production extended to end of 2021 • 2021 guidance of 10,000 to 11,000 tonnes copper • QB2 first production expected H2 2022 • QB2 will double Teck’s copper production Foundation of stable operations, substantial near-term growth
  • 89.
    Operations Improvement and CashFlow Focus in Copper Productivity & Cost Management • Focus on reliability and maintenance and cross site sharing • RACE21TM and continuous improvement pipeline driving benefits across sites – a key driver of margins • Cost reductions embedded in plans 89 Focused Investment Priorities • Key water, tailings and regulatory projects drive sustaining capital requirements • Near-term higher sustaining spending from tailings facility costs at Antamina • Long-term sustaining capex (2024+) in copper expected at $125 million, excluding QB2 and life extension projects
  • 90.
    Copper Unit Costs 90 OperatingCost1 Breakdown in 2020 Labour 30% Contractors and Consultants 11% Operating Supplies 16% Repairs and Maintenance Parts 16% Energy 20% Other 6% Total 100% Operating Costs 47% Unit Costs1 in 2020 Royalties 2% Depreciation and Amortization 24% Transportation 6% Operating Costs 68%
  • 91.
    Endnotes: Copper Slide 82:Copper Market 1. Source: Shanghai Metal Market. 2. Source: Wood Mackenzie. Slide 83: Global Copper Mine Production Increasing Slowly 1. Source: Data compiled by Teck based on information from Wood Mackenzie and Company Reports (average production first 10 years). 2. Source: Data compiled by Teck based on information from Wood Mackenzie and Teck’s analysis of publicly available quarterly financial reports and other public disclosures of various entities. Slide 84: Copper Disruptions Continue o Impact Mines 1. Source: Data compiled by Teck based on information from Wood Mackenzie, CRU, and Metal Bulletin. 2. Source: Data compiled by Teck based on information from Wood Mackenzie and Teck’s analysis of publicly available quarterly financial reports and other public disclosures of various entities. Slide 85: Rapid Growth in Chinese Copper Smelter Capacity 1. Includes mine projects with copper capacity >10 ktpa. Source: BGRIMM. 2. Source: BGRIMM, SMM, Teck. Slide 86: Copper Supply 1. Source: Wood Mackenzie, GTIS, BGRIMM, SMM. 2. Source: Wood Mackenzie, GTIS, BGRIMM, SMM. Slide 87: Copper Metal Stocks 1. Source: LME, Comex, SHFE, SMM. Slide 90: Copper Unit Costs 1. Copper unit costs are reported in US dollars per pound. Non-GAAP financial measures. See “Non-GAAP Financial Measures” slides. 91
  • 92.
  • 93.
    Zinc Mines Returnbut Insufficient to Meet Demand Zinc mine supply still at risk, pressure on smelters continues • COVID-19 and poor financials resulted in numerous mine suspensions and closures, eliminating significant production in 2020 • Mine production has returned, including several previously closed mines due to high LME zinc prices. Despite return of mine supply, the concentrate market remains very tight in 2021 • Chinese and ROW manufacturing restarted with consumption driven by infrastructure, construction and automotive • Despite roll-out of vaccines, escalating cases of COVID-19 and the continued economic impact increase concerns for future demand and supply of zinc in 2021 93
  • 94.
    Zinc Market Raw materialsshortages and improving demand support prices • Demand for raw materials and mine disruptions due to COVID-19 kept concentrate demand strong ‒ Mine production in 2020 estimated decline >1 Mt, while smelter cuts were only ~300 kt ‒ Ongoing spread of the virus and COVID-19 protocols impacting production in 2021 ‒ Despite return of mine production, concentrate supply remains tight; Spot TCs down -78% from February 2020 peak, currently ~US$70/dmt ‒ Concentrate market expected to remain tight in 2021; Gamsberg pit failure likely to further impact supply • Construction, infrastructure, and automobile demand driving zinc demand in China ‒ Galvanized utilization rates rebounded after Lunar New Year to 91% in March, well above 78% long term average ‒ China zinc premiums remained above ~US$100 per tonne, for the fifth straight month Zinc Tied to the Protection of Steel for 60% of Total Demand2 Steel Demand in China Supporting Zinc Price1 25 50 75 100 Jun-17 Dec-17 Jun-18 Dec-18 Jun-19 Dec-19 Jun-20 Dec-20 Operating Rates % Total Smelter Operating Rates Large Zinc Smelters Operating Rates at Galvanizers 94 Zinc Demand 13.1 Mt Zinc End Uses 13.1 Mt Consumer Products 6% Construction 51% Transport 20% Industrial Machinery 7% Infrastructure 16% Galvanizing 52% Oxides & Chemical 7% Brass & Semi Cast 16% Semi- Manufactured 6% Die Cast Alloys 15% Other 4%
  • 95.
    0 1,000 2,000 3,000 4,000 5,000 6,000 7,000 2013 2014 2015 2016 2017 2018 2019 2020 2021 2022 0 1,000 2,000 3,000 4,000 5,000 6,000 7,000 2013 2014 2015 2016 2017 2018 2019 2020 2021 2022 Chinese Mine andSmelter Production Mine production flat while smelter production increases 95 Chinese Refined Production Up 9% Since 20182 (kt Contained) Chinese Mine Production Down 1% Since 20181 (kt Contained) Delayed projects and decreasing ore grades continue to impact Chinese mines while smelter production increases
  • 96.
    3.4 3.6 3.8 4.0 100 350 270 180 300 250 237 392 495 360 200 -630 83 -38 -153 40 -50 50 -800 -600 -400 -200 0 200 400 600 Early-year estimateAdjusted estimate Global Mine Production Remains Under Pressure Ongoing risk to supply growth in 2021 96 Estimated Chinese Zinc Mine Growth Rarely Achieved1 (Kmt Contained) Zinc Ore Grades Falling at Chinese Mines3 (Ore grade, zinc %) -4,000 -3,000 -2,000 -1,000 0 1,000 New Mines China Mines ROW Mines Change Changes in Mine Production Since Q1 20182
  • 97.
    0 200 400 600 800 1,000 1,200 1,400 1,600 Jan-12 Aug-12 Mar-13 Oct-13 May-14 Dec-14 Jul-15 Feb-16 Sep-16 Apr-17 Nov-17 Jun-18 Jan-19 Aug-19 Mar-20 Oct-20 Domestic Commercial StocksBonded Stocks Smelter + Consumer Stocks 503 770 788 627 627 1,213 1,229 1,247 0 200 400 600 800 1,000 1,200 1,400 1,600 2016 2017 2018 2019 2020E 2021E 2022E 2023E Stocks Continue to Decrease While Refined Production Increases in China 97 Additional Zinc Metal Required to Fill the Gap3 (kt) De-stocking Continues Chinese Stocks at Record Lows1,2 (kt) • 2020 stocks down despite lower Q1 consumption due to COVID-19 • Seasonal stock increase during Lunar New Year was lower than previous years • Additional metal required to meet 2021 demand
  • 98.
    • Following thereturn of Chinese mine production after COVID-19 shutdowns, increasing smelter production kept China reliant on imported concentrate • Chinese mine production was expected to increase in 2020; decreasing ore grades and delayed projects kept production down -1% YoY • Mine production has recovered in South America, after losing >1.0 Mt of production in 2020; but increasing cases of COVID-19 variants likely to lead to further affect mine supply • 2021 mine production currently forecast to grow 7.7%, but already impacted by COVID-19 hygiene protocol lowering guidance at several mines and Gamsberg pit failure Zinc Supply Mine production expected to grow in 2021, but remains at risk due to COVID-19 98 Zinc Mine Production1 (kt contained) 0 2,000 4,000 6,000 8,000 10,000 12,000 14,000 16,000 2017 2018 2019 WM Q4 2019 F 2020 2021 2022 2023 ROW Others China Glencore Dugald River Gamsberg New Century New Mines WM Pre-Covid 2020 Forecast
  • 99.
    Zinc Concentrate TreatmentCharges Treatment Charges1 (USD/dmt) 99 0 50 100 150 200 250 300 350 Spot TC Benchmark TC Spot TCs down -78% vs. Feb 2020 peak Benchmark TCs down -47% YoY
  • 100.
    Zinc Metal Stocks COVID-19related decrease in demand resulting in minor inventory build • Deficits over past 5 years drove down stocks, with total stocks at only 6.5 days of global consumption by the end of 2020, compared to a 19-day historical average • Despite demand returning, overall refined zinc stocks have increased in 2021 • LME and Chinese stocks have increased 57% year-to-date, still only 10.8 days of consumption - LME stock build from excess metal accumulated during COVID-19 lockdowns - LME warehouses incentivizing traders to lock up metal on exchange in rent deals - SHFE stocks increased during Lunar New Year but already decreased 17% since the peak in February 100 Daily Zinc Prices1,2 (US$/mt) and Stocks1,2 (kmt) 0 500 1,000 1,500 2,000 2,500 0 500 1,000 1,500 2,000 2,500 3,000 3,500 4,000 2010 2011 2012 2013 2014 2015 2016 2017 2018 2019 2020 2021 LME Stocks Bonded SHFE Price
  • 101.
    Largest Global NetZinc Mining Companies Teck is the Largest Net Zinc Miner1(kt) Provides significant exposure to a rising zinc price 101 0 50 100 150 200 250 300 Teck Public Company Private Company
  • 102.
    Integrated Zinc Business 102 RedDog Trail • Performance to date is in line with plan • Water related issues that impacted 2020 are not expected to impact 2021 production • 2021 guidance of 490,000 to 510,000 tonnes of zinc in concentrate • Lower zinc sales in H1 2021, particularly in Q2 2021, due to lower 2020 production • VIP2 project is helping to offset lower grades • Planned annual zinc roaster maintenance during Q2 will impact production in Q2 • 2021 guidance of 300,000 to 310,000 tonnes of refined zinc • Refined lead and silver production similar to prior years in 2021 but will fluctuate • Focus on margin improvement including RACE21TM implementation Strengthening our zinc business
  • 103.
    Operations Improvement and CashFlow Focus in Zinc Productivity • Focus on asset management and cross site sharing • RACE21TM and continuous improvement pipeline driving benefits across sites – a key driver of margins • Cost reductions embedded in plans 103 Focused Investment Priorities • Key water, tailings and regulatory projects drive sustaining capital requirements • Near term higher sustaining spending from tailings related projects at Red Dog and air quality and asset renewal at Trail Operations • Long-term sustaining capex (2024+) in zinc expected at $150 million, excluding life extension projects
  • 104.
    Red Dog SalesSeasonality • Operates 12 months • Ships ~ 4 months • Shipments to inventory in Canada and Europe; Direct sales to Asia • ~65% of zinc sales in second half of year • ~100% of lead sales in second half of year • Sales seasonality causes net cash unit cost seasonality 104 Zinc Sales 1 (%) Lead Sales1 (%) 21% 16% 31% 32% 0% 10% 20% 30% 40% Q1 Q2 Q3 Q4 0% 1% 66% 33% 0% 20% 40% 60% 80% Q1 Q2 Q3 Q4
  • 105.
    Red Dog NetCash Unit Cost Seasonality Five-Year Average Red Dog Net Cash Unit Costs1 (US$/lb) 105 • Seasonality of Red Dog unit costs largely due to lead sales during the shipping season • Higher net cash unit costs expected in 2021 compared to 2020 due primarily to lower production volumes in 2020, as well as lower contribution from silver by-products - 0.20 0.40 0.60 Q1 Q2 Q3 Q4
  • 106.
    Zinc Unit Costs 106 OperatingCost1 Breakdown in 2020 Labour 35% Contractors and Consultants 10% Operating Supplies 11% Repairs and Maintenance Parts 9% Energy 18% Other 17% Total 100% Operating Costs 47% Unit Costs1 in 2020 Depreciation and Amortization 24% Operating Costs 68% Depreciation and Amortization 13% Operating Costs 38% Transportation 12% Concentrate Purchases 26% Royalties 11%
  • 107.
    Red Dog inBottom Quartile of Zinc Cost Curves Higher zinc prices reduce risk of economic closures Total Cash + Capex Cost Curve 20201 (US¢/lb) 107 0 20 40 60 80 100 120 140 160 180 200 0% 25% 50% 75% 100% 2020 Costs Based on Current Prices Current Spot LME Price RED DOG
  • 108.
    Red Dog ExtensionProject Long Life Asset • Aktigiruq exploration target of 80-150 Mt @ 16-18% Zn + Pb1 • Anarraaq Inferred Resource2: 19.4 Mt @14.4% Zn, 4.2% Pb Quality Project • Premier zinc district • Significant mineralized system • High grade Stable Jurisdiction • Operating history • ~12 km from Red Dog operations 108 Qanaiyaq Aktigiruq Anarraaq Paalaaq Su-Lik Aqqaluk Main Looking Northwest
  • 109.
    Endnotes: Zinc Slide 94:Zinc Market 1. Source: Shanghai Metal Market. 2. Source: Based on information from the International Zinc Study Group Data. Slide 95: Chinese Mine and Smelter Production 1. Source: Data compiled by Teck based on information from BGRIMM, CNIA, Antaike. 2. Source: Data compiled by Teck based on information from BGRIMM, CNIA, Antaike. Slide 96: Global Mine Production Remains Under Pressure 1. Source: Data compiled by Teck based on information from BGRIMM, CNIA, Antaike. Early year estimates from consolidation of several analyst views in the year preceding. 2. Source: Data compiled by Teck based on information from BGRIMM, CNIA, Antaike. 3. Source: Data compiled by Teck based on information from BGRIMM, CNIA, Antaike., NBS. Slide 97: Stocks Continue to Decrease While Refined Production Increases in China 1. Source: Data compiled by Teck Analysis based on information from SHFE, SMM, 2. Source: ”Smelter + consumer stocks” refers to zinc metal held in the plants of smelters and semi producers and those on the road; ”Bonded stocks” refers to zinc stored in bonded zones and will need to complete Customs clearance before entering China; ”Domestic commercial stocks” refers to zinc stored in SHFE warehouses and other domestic commercial warehouses not registered in SHFE. 3. Source: Data compiled by Teck Analysis based on historic numbers from China Customs, and forecasts based on data from BGRIMM, Antaike and Teck’s commercial contacts. Slide 98: Zinc Supply 1. Source: Data compiled by Teck based on information from Wood Mackenzie, BGRIMM, CNIA, Antaike and Teck analysis. Slide 99: Zinc Concentrate Treatment Charges 1. Source: Wood Mackenzie. Slide 100: Zinc Metal Stocks 1. Source: Data compiled by Teck from information from LME, SHFE, SMM. 2. Source: Data compiled by Teck from information from LME, Fastmarkets, Argus, Acuity, company reports. Slide 101: Largest Global Net Zinc Mining Companies 1. Source: Data compiled by Teck from information from Wood Mackenzie – Company smelter production netted against company mine production on an equity basis. Slide 104: Red Dog Sales Seasonality 1. Average sales from 2016 to 2020. Slide 105: Red Dog Net Cash Unit Cost Seasonality 1. Average quarterly net cash unit cost in 2016 to 2020, before royalties. Based on Teck ‘s reported financials. Net cash unit cost is a non-GAAP financial measure. See “Non-GAAP Financial Measures” slides. Slide 106: Zinc Unit Costs 1. Zinc unit costs are reported in US dollars per pound. Non-GAAP financial measures. See “Non-GAAP Financial Measures” slides. Slide 107: Red Dog in Bottom Quartile of Zinc Cost Curves 1. Source: Data compiled by Teck from information from Wood Mackenzie, LME – Based on WM Forecast information and estimates for 2020 based on current short term average prices. Slide 108: Red Dog Extension Project 1. Aktigiruq is an exploration target, not a resource. Refer to press release of September 18, 2017, available on SEDAR. Potential quantity and grade of this exploration target is conceptual in nature. There has been insufficient exploration to define a mineral resource and it is uncertain if further exploration will result in the target being delineated as a mineral resource. 2. Based on Teck’s 2020 Annual Information Form. 109
  • 110.
  • 111.
    Steelmaking Coal Facts GlobalCoal Production1: ~7.4 billion tonnes Steelmaking Coal Production2: ~1,130 million tonnes Export Steelmaking Coal2: ~320 million tonnes Seaborne Steelmaking Coal2: ~285 million tonnes 111 • ~0.7 tonnes of steelmaking coal is used to produce each tonne of steel3 • Up to 100 tonnes of steelmaking coal is required to produce the steel in the average wind turbine4 Our market is seaborne hard coking coal2: ~190 million tonnes
  • 112.
    Steelmaking Coal Market Chinaban of Australian coal pushing seaborne CFR China price higher Near term outlook: An eventual end to “China ban” would increase FOB Australia prices • China: Q1 seaborne imports slumped due to the ban of Australian coal (effective October 2020) • Ex-China markets: Demand strong as steel prices achieve record high; Q1 crude steel production up 10%, hot metal production up 5.8% as blast furnaces restart • Supply: Cost curve and supply response (COVID-19, “China ban”, and mine disruptions) provide price support Longer term outlook: Fundamentals remain unchanged • China: Declining domestic reserves and persistent demand by coastal steel mills and new projects • Ex-China markets: Mid-term demand boosted by government stimulus and long-term growth supported by Indian government targets, limited scrap supply and continued urbanization • Supply: Declining existing capacity and minimal project pipeline (low investment and permitting challenges) 112 Strong coal fundamentals underpinned by global economic recovery Steelmaking Coal Prices1 (US$/t) 10-year average Seaborne FOB price of ~US$170/t, or ~US$180/t on an inflation-adjusted basis 0 50 100 150 200 250 300 Chinese Domestic CFR Equivalent CFR China FOB Australia
  • 113.
    Steelmaking Coal DemandGrowth Forecast Continued recovery with >80% banked blast furnaces restarted/announced restart Seaborne Steelmaking Coal Imports1 (Mt) Change 2021 vs. 2020 113 Includes: • China: Impact of the ban on Australian coal • Europe/JKT: Restarting banked furnaces • India: Growing steel production (unchanged long-term fundamentals) • Brazil: Strong domestic demand (residential construction, automotive) and export market • SE Asia: Economic recovery (demand growth from Vietnam) 290 297 11 6 4 2 2 20 260 270 280 290 300 2020 China Europe India JKT Brazil SE Asia 2021E
  • 114.
    Indian Steelmaking CoalImports Mid- & long-term imports supported by secular demand and government targets 114 Indian Seaborne Coking Coal Imports2 (Mt) Indian Crude Steel Production1 (Mt) India 2021 crude steel production and seaborne coking coal imports have surpassed 2019 levels 0 20 40 60 80 100 120 0 10 20 30 40 50 60 70
  • 115.
    Chinese Steelmaking CoalImports – Australia Ban Q1 2021 seaborne imports down by -13 Mt with ex-Australia up +2 Mt YoY 115 Chinese Coking Coal Imports2 (Mt) Chinese Crude Steel Production (CSP), Hot Metal Production (HMP) and Coal Production (Mt)1 Recovering China domestic and Mongolia imports in Q1 from low base in 2020 • +13Mt YoY for domestic coking coal production… safety inspections limit growth forward • +3.4Mt YoY in Q1 for Mongolian coking coal imports… pandemic reduces April imports 0 100 200 300 400 500 600 0 200 400 600 800 1,000 1,200 CSP (LHS) HMP (LHS) Coking Coal Production (RHS) 35 60 48 35 36 44 37 41 48 28 19 16 15 13 24 26 28 34 24 30 0 10 20 30 40 50 60 70 80 Seaborne Coking Coal Imports Mongolian Coking Coal Imports
  • 116.
    Chinese Steel Margins Steelmargins rebound on record high steel prices China Hot Rolled Coil (HRC) Margins and Steelmaking Coal (HCC) Prices1 (US$/t) 116
  • 117.
    0 200 400 600 800 1000 1200 2010 2012 20142016 2018 2020 2022 2024 Chinese Scrap Use Remains Low Scrap supply limits EAF share in steel output 117 China’s scrap ratio lower than global average of 38%1 (2019)2 Crude Steel Electric Arc Furnace Hot Metal China Steel Use By Sector (2000-2020)3 2025 EAF share forecast to be similar to 20104 83% 69% 55% 42% 40% 34% 22% 0% 20% 40% 60% 80% 100% Turkey USA EU Russia Korea Japan China Construction 50-60% Machinery 15-20% Auto 5-10% Others 15-25%
  • 118.
    Steelmaking Coal SupplyGrowth Forecast Supply is forecast to recover amid growing demand Seaborne Steelmaking Coal Exports1 (Mt) Change 2021 vs. 2020 118 Includes: • USA: YTD exports down 17% on increased domestic demand & mine disruptions • Russia: Higher exports to China and potential mine expansion projects ‒ Kolmar’s and Evraz’s existing mines, A-Property’s Elga • Canada: Growth from existing mines • Mozambique: Possible growth from Vale’s Moatize • Indonesia: ramp-up from newly commissioned mines ‒ Adaro’s Lampunut or Cokal’s BBM • Australia: Analyst views range from -7 Mt to +3 Mt2 281 291 5 5 2 1 0 284-294 4 2 260 270 280 290 300 2020 USA Russia Canada Indonesia Mozambique Supply Others 2021, ex. Aus Australia 2021E
  • 119.
    Australia and USSteelmaking Coal Exports US coal producers are swing suppliers 119 US Exports2 (Mt) Australian Exports1 (Mt) 0 20 40 60 80 100 120 140 160 180 200 0 10 20 30 40 50 60 70
  • 120.
    Canadian & MozambiqueSteelmaking Coal Exports Canadian exports recovering with increased demand 120 Mozambique Exports2 (Mt) Canadian Exports1 (Mt) 0 5 10 15 20 25 30 35 40 0 1 2 3 4 5 6 7 8 9
  • 121.
    2nd Largest SeaborneSteelmaking Coal Supplier Competitively positioned to supply steel producers worldwide 121 CHINA 2013: ~30% 2017: ~15% 2019: ~10% 2020: ~15% INDIA 2013: ~5% 2017: ~10% 2019: ~15% 2020: ~15% Sales Distribution AMERICAS ~5% EUROPE 2013: ~15% 2017: ~20% 2019: ~15% 2020: ~15% ASIA EXCL. CHINA & INDIA 2013: ~40% 2017: ~45% 2019: ~55% 2020: ~50% Targeting increased sales to China to capture current CFR China price premium
  • 122.
    122 • 811 milliontonnes1 of reserves support 26 to 27 million tonnes of long term annual production • The Neptune Bulk Terminals upgrade to secure >18.5 Mt of exclusive port capacity ‒ Lower cost and more reliable port access for steelmaking coal ‒ Established infrastructure and supply chain capacity with mines and railways • Geographically concentrated in the Elk Valley, BC, Canada • Stable long term strip ratio High Quality Steelmaking Coal Business
  • 123.
    Steelmaking Coal BusinessOperating Strategy 123 26 to 27 million tonnes of long term annual production capacity • Increase margins not volumes • Maximize synergies in the Elk Valley, BC, Canada • Optimize supply chain • Productivity focus • Sustain strong cash flow on a restructured cost base
  • 124.
    Steelmaking Coal UnitCosts 124 Operating Cost1 Breakdown in 2020 Labour 34% Contractors and Consultants 13% Operating Supplies 16% Repairs and Maintenance Parts 19% Energy 14% Other 4% Total 100% Transportation 29% Depreciation and Amortization 24% Operating Costs 47% Unit Costs1 in 2020
  • 125.
    Setting Up forStrong Long-Term Cash Flows in Steelmaking Coal 125 Executing on four pillars to transform cost structure and optimize margins 1. Decline in strip ratio 2. Strategically replaced high-cost tonnes with low-cost tonnes 3. RACE21TM transformation ‒ Lowering operating costs and increasing EBITDA1 potential 4. Neptune capacity increase and third party logistics contracts ‒ Lowering port costs, increase logistics chain flexibility and improved reliability
  • 126.
    82% 90% 92% 99% 101% 100% 103% 102% 105% 80% 85% 90% 95% 100% 105% 110% 20122013 2014 2015 2016 2017 2018 2019 2020 126 Truck Productivity4 (SHM%) RACE21™ innovation-driven business transformation • Record 2020 haul truck productivity improvement • Advanced plant analytics • Autonomous haulage strategy ‒ Substantial completion of the autonomous haulage pilot at Elkview Operations by year end Mid-Point 2021 Production Guidance2 Change Estimated Effect on Annualized Profit3 Estimated Effect on Annualized EBITDA3 Coal 26.0 Mt US$50/t C$950M C$1,500M Strong cash flow generation1 Steelmaking Coal Continues To Deliver Strong Returns
  • 127.
    Sustain Production Capacityand Productivities In Steelmaking Coal Maintaining historical dollar per tonne sustaining investment levels 2010-2016: Average spend of ~$11 per tonne1 • Swift at Fording River and Line Creek • Reinvestment in 5 shovels, 50+ haul trucks 2017-2024: Average spend of ~$11-13 per tonne1 • Plant expansion at Elkview, mine life extension projects and Neptune sustaining investments • Reinvestment in equipment fleets and infrastructure to increase mining productivity and processing efficiencies 127 Sustaining capital is now inclusive of production capacity investments previously called Major Enhancement. Sustaining Capital, Excluding Water Treatment1 ($/t) Long term run rate for sustaining capital is ~$11-13 per tonne
  • 128.
    SALES MIX • ~40%quarterly contract price • ~60% shorter than quarterly pricing mechanisms (including “spot”) PRODUCT MIX • ~75% of production is high-quality HCC • ~25% is a combination of SHCC, SSCC, PCI • Varies quarter-to-quarter based on the mine plans KEY FACTORS IMPACTING TECK’S AVERAGE REALIZED PRICES • Variations in our product mix • Timing of sales • Direction and underlying volatility of the daily price assessments • Spreads between various qualities of steelmaking coal • Arbitrage between FOB Australia and CFR China pricing Teck’s Steelmaking Coal Pricing Mechanisms Sales book generally moves with the market 128
  • 129.
    Quality and BasisSpreads Impact on Teck’s average realized steelmaking coal prices HCC Seaborne / China Domestic Prices and Spread2 (US$/t) HCC / SHCC Prices and Spread1 (US$/t) 129 0 25 50 75 100 0 50 100 150 200 250 300 350 Jun-16 Sep-16 Dec-16 Mar-17 Jun-17 Sep-17 Dec-17 Mar-18 Jun-18 Sep-18 Dec-18 Mar-19 Jun-19 Sep-19 Dec-19 Mar-20 Jun-20 Sep-20 Dec-20 Mar-21 HCC (LHS) SHCC (LHS) HCC / SHCC spread (RHS) (100) (80) (60) (40) (20) 0 20 40 60 80 100 120 0 50 100 150 200 250 300 350 Jun-16 Sep-16 Dec-16 Mar-17 Jun-17 Sep-17 Dec-17 Mar-18 Jun-18 Sep-18 Dec-18 Mar-19 Jun-19 Sep-19 Dec-19 Mar-20 Jun-20 Sep-20 Dec-20 Mar-21 Seaborne HCC CFR China (LHS) Domestic HCC CFR China (LHS) Seaborne / Domestic spread (RHS)
  • 130.
    West Coast PortCapacity 130 • Current capacity 35 Mtpa • Teck contracted capacity, following expiry of our current contract on March 31, 2021: ‒ 2021: 12.55-13.55 Mt, including ~5 Mt in Q1 2021 ‒ From 2022: 5-7 Mtpa at fixed loading charges ‒ Total of 33 Mt over agreement term WESTSHORE TERMINALS • Current capacity 18 Mtpa • Teck contract: ‒ January 2021 to December 2027 ‒ Ramps up to 6 Mtpa over 2021 RIDLEY TERMINALS Teck’s Contracted West Coast Port Capacity (Nominal Mt) Westshore Terminals Neptune Coal Terminal Ridley Terminals 6 5-7 >18.5 • World class design and equipment for enhanced reliability • Capacity growth to >18.5 Mtpa • ~$150M infrastructure investment in upstream supply chain • 100% ownership of coal capacity NEPTUNE COAL TERMINAL
  • 131.
    131 In the commissioningphase • Ramp-up is continuing as planned • Equipment performing according to, or better than, plan • First steelmaking coal unloaded using the new double rail car dumper on April 19th, 2021 • 18 vessels have been loaded with the new shiploader to date • Upstream rail infrastructure improvement to support increased volumes are largely complete Neptune Port Upgrade Update Neptune secures a long-term, low-cost and reliable steelmaking coal supply chain Photo: Lowering of shell for Ball Mill #3.
  • 132.
    Endnotes: Steelmaking Coal Slide111: Steelmaking Coal Facts 1. Source: IEA. 2. Source: Wood Mackenzie (Long Term Outlook H2 2020). 3. Source: World Coal Association. Assumes all of the steel required is produced by blast furnace-basic oxygen furnace route. 4. Source: The Coal Alliance. Assumes all of the steel required is produced by blast furnace-basic oxygen furnace route. Slide 112: Steelmaking Coal Market 1. Ten-year steelmaking coal prices are calculated from January 1, 2011. Inflation-adjusted prices are based on Statistics Canada’s Consumer Price Index. Source: Argus, Teck. As at May 13, 2021. Slide 113: Steelmaking Coal Demand Growth Forecast 1. Source: Data compiled by Teck based on information from Wood Mackenzie (Short Term Outlook March 2021). 2. Source: Data compiled by Teck based on information from (Metallurgical Coal Market Outlook March 2021) Slide 114: Indian Steelmaking Coal Imports 1. Source: Data compiled by Teck based on information from WSA and CRU (Crude Steel Market Outlook March 2021). 2. Source: Data compiled by Teck based on information from Global Trade Atlas and CRU (Metallurgical Coal Market Outlook March 2021). 2020 and 2021 are based on information from CRU. Slide 115: Chinese Steelmaking Coal Imports – Australian Ban 1. Source: Data compiled by Teck based on information from NBS and Fenwei. 2021 is Q1 annualized for crude steel production and hot metal production and Fenwei estimate for coking coal production. 2. Source: Data compiled by Teck based on information from China Customs and Wood Mackenzie (Short Term Outlook January 2021). 2021 is based on information from Wood Mackenzie. Slide 116: Chinese Steel Margins 1. Source: China HRC Gross Margins is estimated by Mysteel. China Domestic HCC Price is Liulin #4 price sourced from Sxcoal and is normalized to CFR China equivalent. Seaborne HCC Price (CFR China) is based on Argus Premium HCC CFR China. Plotted to April 16, 2021. Slide 117: Chinese Scrap Use Remains Low 1. Source: Bureau of International Recycling, BIR Global Facts and Figures, 11th Edition. 2. Source: Data compiled by Teck based on information from Bureau of International Recycling. 3. Source: Data compiled by Teck based on information from China Metallurgy Industry Planning and Research Institute. 4. Source: Data compiled by Teck based on information from Wood Mackenzie (Long Term Outlook H2 2020) and CRU (Crude Steel Market Outlook April 2021). Slide 118: Steelmaking Coal Supply Growth Forecast 1. Source: Data compiled by Teck based on information from Wood Mackenzie (Short Term Outlook March 2021). Slide 119: Australia and US Steelmaking Coal Exports 1. Source: Data compiled by Teck based on information from Global Trade Atlas, Wood Mackenzie (Short Term Outlook March 2021), and CRU (Metallurgical Coal Market Outlook April 2021). 2. Source: Data compiled by Teck based on information from Global Trade Atlas and Wood Mackenzie (Short Term Outlook March 2021). Slide 120: Canadian & Mozambique Steelmaking Coal Exports 1. Source: Data compiled by Teck based on information from Global Trade Atlas, Wood Mackenzie (Short Term Outlook March 2021). 2. Source: Data complied by Teck based on information from Wood Makenzie. 2010-2020 are based on information from Wood Mackenzie (Long Term Outlook H2 2020). 2021 is based on information from Wood Mackenzie (Short Term Outlook March 2021). 132
  • 133.
    Endnotes: Steelmaking Coal Slide122: High Quality Steelmaking Coal Business 1. As at December 31, 2020, Teck portion, excluding oxide. Based on Teck’s 2020 Annual Information Form. Slide 124: Steelmaking Coal Unit Costs 1. Steelmaking coal unit costs are reported in Canadian dollars per tonne. Non-GAAP financial measures. See “Non-GAAP Financial Measures” slides. Slide 125: Setting Up for Strong Long-Term Cash Flows in Steelmaking Coal 1. EBITDA is a non-GAAP financial measure. See “Non-GAAP Financial Measures” slides. Slide 126: Steelmaking Coal Continues to Deliver Strong Returns 1. As at February 17, 2021. The sensitivity of our annual profit attributable to shareholders and EBITDA to changes in the Canadian/U.S. dollar exchange rate and commodity prices, before pricing adjustments, based on our current balance sheet, our 2021 mid-range production estimates, current commodity prices and a Canadian/U.S. dollar exchange rate of $1.30. See Teck’s Q1 2021 press release for further details. 2. All production estimates are subject to change based on market and operating conditions. 3. The effect on our profit attributable to shareholders and on EBITDA of commodity price and exchange rate movements will vary from quarter to quarter depending on sales volumes. Our estimate of the sensitivity of profit and EBITDA to changes in the U.S. dollar exchange rate is sensitive to commodity price assumptions. EBITDA is a non-GAAP financial measure. See “Non-GAAP Financial Measures” slides. 4. Productivity reflects performance of Teck’s waste haul truck fleet against an internal baseline standard haulage model (SHM) that anticipates an expected rate of material movement per equipment operating hour taking into account size of truck fleet, haul distance, grade and other road design elements. Slide 127: Sustain Production Capacity and Productivities in Steelmaking Coal 1. Historical spend has not been adjusted for inflation or foreign exchange. 2021-2025 average spend assumes annualized average production of 27 million tonnes. All dollars referenced are Teck’s portion net of POSCAN credits for Greenhills Operations at 80% and excludes the portion of sustaining capital relating to water treatment. Sustaining capital is now inclusive of production capacity investments previous called Major Enhancement. Excludes capital leases and growth capital. Slide 128: Quality and Basis Spreads 1. HCC price is average of the Argus Premium HCC Low Vol, Platts Premium Low Vol and TSI Premium Coking Coal assessments, all FOB Australia and in US dollars. SHCC price is average of the Platts HCC 64 Mid Vol and TSI HCC assessments, all FOB Australia and in US dollars. Source: Argus, Platts, TSI. Plotted to April 20, 2021. 2. Seaborne HCC CFR China price is average of the Argus Premium HCC Low Vol, Platts Premium Low Vol and TSI Premium Coking Coal assessments, all CFR China and in US dollars. Domestic HCC CFR China is Liulin #4 normalized to CFR Jingtang Port in US dollars. Source: Argus, Platts, TSI, Sxcoal. Plotted to April 16, 2021. 133
  • 134.
  • 135.
    Steel is Essentialfor Economic Growth In a Low-Carbon World 135 World’s largest metal market today Enables low-carbon energy system Suited for a circular economy Essential to lifting global living standards Steel is widely used and hard to substitute Growth continues to be driven by decarbonization and ongoing economic development Fundamental to renewable energy transition and 1.5°C target of Paris Accord Steelmaking coal required while alternatives evolve and carbon abatement policy advances Easily recyclable (e.g., without alloy issue of aluminum) 80%+ recycle rate of steel scrap in developed economies2 Middle class expected to grow by 2-3 billion people by 2050, mostly in India and South-East Asia (SEA) Rural communities are moving to cities, driving infrastructure build ~25% Lower CO2 footprint in steel relative to cement1 >90% Lower CO2 footprint of recycled steel compared to new steel1 ~165% Increase in combined annual demand growth for India and SEA3 between 2019 and 2050 1,800 90 25 Steel Aluminum Copper Global Production in 2019 (Mt)
  • 136.
    All Steelmaking TechnologiesPlay a Role In Decarbonization 136 Scrap Currently accounts for ~30% of global crude steel production, and while expected to grow, availability will be limited in new growth regions Natural Gas Direct Reduced Iron (DRI) + CCUS via Electric Arc Furnace (EAF) Effective where there is low-cost & abundant natural gas (Americas, MENA1 and parts of Asia) Blast Furnace + CCUS Proven technology with favorable economics, and the best combination of speed and scale for decarbonization H2-Direct Reduced Iron (H2-DRI) via EAF Expected to increase with technology development, and in regions with steady scrap supply, cheap renewable power, and near end-of-life blast furnaces (e.g., Europe)
  • 137.
    Blast Furnace +CCUS Will Lead Large-Scale Decarbonization Adoption 137 Blast Furnace + CCUS adoption will lead through 20502 Blast Furnace + CCUS is adoption ready Blast Furnace + CCUS is highly cost competitive • Leverages >US$1 trillion of existing installed blast furnace fleet • Ample global CCUS storage capacity of ~5 trillion tonnes CO2 1 Proven technology in hard-to-abate industries • CCUS operates in power generation, refining, petrochemicals, agrichemicals, and steel/iron industry Accelerators to adoption • Large-scale hub and cluster transportation and sequestration infrastructure will support economies of scale Fastest path to large-scale decarbonization • Effective decarbonization of 80% of steel emissions • Requires CO2 pricing to be > US$50/t CO2, and CO2 abatement cost of US$50-100/t CO2 • Cost reductions with generational learning 2019 2050 2030 2040 NG-DRI + CCUS 100% Scrap BF + CCUS H2-DRI NG-DRI BF 2.0 2.3 Total Steel Demand (Bt) 2.3 2.4
  • 138.
    Blast Furnace +CCUS is the Most Cost Competitive Decarbonization Technology Through 2050 138 Blast Furnace + CCUS is the only technology that can be adopted with speed and scale To produce hydrogen at a cost of US$1-2/kg for scalable H2-DRI adoption requires: Stable supply of renewable power <US$1.5c/KWh • Significant investment in large-scale renewable infrastructure development that does not exist today • ~60% lower wind and solar costs Low-cost, highly-efficient electrolyzers • Decline in electrolyzer capex by ~80% • High-capacity scale-up and utilization rates • Sufficient H2 storage capacity to allow stable and continuous supply High-grade iron ore pellet availability • Availability constraints on high-grade iron-ore pellets suitable for DRI will limit H2-DRI adoption beyond 2030 1. Source: Teck. Production cost includes transportation and storage cost. 2. LCOE based on Solar PV. 3.2 2.1 1.4 1.1 Levelized Cost of Energy2 – China (US$c/kWh) Total Cost of Ownership1 (US$/t liquid steel) China (SDS – 1.7o scenario) Brownfield BF + CCUS 750 800 2030 2020 2025 2035 2040 2045 2050 0 400 450 500 550 600 650 700 H2-DRI Greenfield BF + CCUS CCUS retrofit of brownfield blast furnaces (Brownfield BF + CCUS) remains most competitive Greenfield H2-Direct Reduced Iron (H2-DRI) becomes more competitive than Greenfield BF + CCUS after ~2040
  • 139.
    Long-Term Demand forSteelmaking Coal Is Expected to Decline… 139 Steelmaking Coal Demand1 (Mtpa) • Seaborne HCC demand expected to remain resilient due to steel demand growth in regions that rely on lower-cost seaborne hard coking coal (HCC) imports (e.g., India and South-East Asia) for blast furnace steelmaking • Increased global scrap recycling expected to reduce overall steelmaking coal demand, with limited impact on seaborne HCC ⎻ India and South-East Asia have little scrap availability, and scrap use in China is expected to reduce domestic supply 185 240 200 820 770 380 2019 2030 2050 Seaborne HCC Other Steelmaking Coal2 The magnitude of steelmaking coal demand will ultimately be driven by the pace of decarbonization
  • 140.
    …But Long-Term Demandfor Seaborne Hard Coking Coal Will Remain Robust 140 • Natural gas and H2-DRI expected to displace some coking coal demand, but mainly after 2040 • Efficiency gains at blast furnaces are expected to erode some coking coal demand • Demand for premium hard coking coal such as Teck’s product is expected to remain resilient as it improves blast furnace efficiency and lowers emissions Seaborne steelmaking coal demand will benefit from strong growth in major importing regions where blast furnace steelmaking will dominate South-East Asia 2019 2030 India Developed Asia 2050 China Rest of World 185 240 200 Seaborne Steelmaking Coal Demand1 (Mtpa)
  • 141.
    Teck’s Seaborne SteelmakingCoal Is Optimally Positioned For a Decarbonizing Future 141 Highest quality HCC leading to lowest CO2 emissions in steelmaking Teck’s HCC has amongst lowest Scope 1 and Scope 2 emissions relative to peers Globally advantaged seaborne logistics and cost position • Teck’s emissions intensity is within the lowest of the commodity range, assisted by access to low carbon sources of electricity in B.C. • Teck mines will be even more cost competitive with rising CO2 prices globally CO2 Coal Intensity Curve1 (t CO2e/t saleable coal) • Teck HCC is amongst the highest quality in the world • Teck’s premium hard coking coal improves blast furnace efficiency and decreases CO2 emissions per tonne of steel • Proximity to the Pacific Ocean gives direct access to Asia • By 2050, forecast cost position in the 1st-2nd quartile due to scarce new projects and high-cost for domestic suppliers switching to export 150 300 50 200 250 100 Simplified 2030 Seaborne HCC Supply Curve2 Cumulative production (Mt) Teck 0 Cumulative production (Mt) 150 50 200 250 100 Low Phosphorus Teck Future High Strength Low Sulphur Low Ash
  • 142.
    Teck’s High QualitySeaborne Steelmaking Coal Will Continue To Be A Key Resource In The Low-Carbon Transition 142 Blast Furnace + Carbon Capture, Utilization and Storage (CCUS) is the most cost competitive and commercially viable solution for large-scale adoption Leverages sunk cost of more than US$1 trillion of young blast furnaces, which will last well into the second half of this century Unlike other technologies, Blast Furnace + CCUS is commercially and technologically ready for near-term adoption Global steel industry emits 7-10% of total greenhouse gas emissions Meeting the objective of the Paris Accord will rely on a range of steelmaking abatement technologies Together they can reduce steelmaking emissions by more than 80% by 2050 Blast Furnace + CCUS is the only abatement technology capable of decarbonizing the steelmaking industry at the rate and scale required by 2050 70% of the world’s steelmaking today uses blast furnaces Blast Furnace + CCUS will lead large-scale steelmaking decarbonization through 2050 Blast Furnace + CCUS steelmaking will drive continued demand for Teck’s high quality seaborne hard coking coal Teck’s high quality seaborne steelmaking coal will benefit from demand growth in the major importing regions of India and South-East Asia where blast furnace steelmaking will dominate
  • 143.
    Endnotes: Steelmaking CoalResilience Slide 135: Steel is Essential for Economic Growth In a Low-Carbon World 1. Source: Teck. 2. Source: WSA, IEA. 3. India (from ~100 Mt in 2019 to 300 Mt in 2050) and South-East Asia (from ~100 Mt in 2019 to ~230 Mt in 2050) IEA SDS Scenario assumptions on CO2 pricing (~US$0/t CO2 in 2020 to ~US$160/t in 2050). Slide 136: All Steelmaking Technologies Play a Role In Decarbonization 1. Middle East and North Africa. 2. Under the IEA Sustainable Development Scenario (SDS) +1.7°C. Slide 137: Blast Furnace + CCUS Will Lead Large-Scale Decarbonization Adoption 1. Global CCUS Institute estimates. 2. Under the IEA Sustainable Development Scenario (SDS) +1.7°C. Slide 138: Blast Furnace + CCUS is the Most Cost Competitive Decarbonization Technology Through 2050 1. IEA forecast and internal analysis, Sustainable Development Scenario (SDS) +1.7°C. Slide 140: …But Long-Term Demand for Seaborne Hard Coking Coal Will Remain Robust 1. Comprised of landborne hard coking coal and global semi-soft coking coal. Slide 141: Teck’s Seaborne Steelmaking Coal Is Optimally Positioned For a Decarbonizing Future 1. Source: Skarn Associates, 2019. 2. 2050 HCC operating cost, including royalty and price differential, $/t, FOB, real 2020$), MineSpans, 2021. 143
  • 144.
  • 145.
    Energy Benchmark Pricing CalendarNYMEX WTI Price1 , WTI/WCS Basis Differential at Hardisty2 and WTI/WCS Basis Differential at the US Gulf Coast3 (US$/bbl) 145 (10) - 10 20 30 40 50 60 70 80 (10) 0 10 20 30 40 50 60 70 80 Jan-17 May-17 Sep-17 Jan-18 May-18 Sep-18 Jan-19 May-19 Sep-19 Jan-20 May-20 Sep-20 Jan-21 May-21 Calendar NYMEX WTI Price WTI/WCS Basis Differential at Hardisty WTI/WCS Basis Differential at the USGC
  • 146.
    Production @ 100% (kbpd) FortHills is A Modern Oil Sands Mine 146 De-bottleneck potential Best monthly production rate (201 kbpd) • Higher quality, partially de-carbonized Paraffinic Froth Treatment (PFT) product = lower greenhouse gas (GHG) emissions • Starting to ramp-up production in June, with full production rates1 expected in Q4 2021 • Government of Alberta production limits relaxed in Q4 20202 • Focused on operational excellence to reduce operating costs and capital efficiency Temporarily reduced production due to COVID-19 and low WCS prices Fort Hills is a quality asset with significant upside potential 0 50 100 150 200 250 Q1 Q2 Q3 Q4 Q1 Q2 Q3 Q4 Q1 Q2 Q3 Q4 Q1 2018 2019 2020 2021 Start-up Curtailed
  • 147.
    147 0 20 40 60 80 Yale’s Environmental PerformanceIndex Of Top 10 Oil Reserve Countries World Oil Producers Ranked By Corruption and Volume1 Canada is a Leader in ESG The world benefits from Canada’s sustainable production during transition to renewables Canada should be a supplier of choice
  • 148.
    Best In ClassLow Carbon Intensity Production Our Fort Hills blend can displace carbon intensive crudes 148 • Emissions intensity of Canadian oil sands has declined by 25%; estimated reduction of 15% to 20% by 2030 • PFT bitumen emissions from mining significantly lower than others • Fort Hills PFT currently the new bar for low emissions • Fort Hills will displace barrels of crude from higher emitters Source: Bloomberg, BMO Capital Markets Total Life Cycle Emissions Intensity (kg CO2e/bbl refined product – gasoline/diesel) Lower carbon intensity than 50% of the US refined barrels of oil
  • 149.
    Continuous Improvement inEmissions Intensity Fort Hills emissions performance has been outstanding to date 149 • Recent analysis by IHS Markit shows 15% improvement in emissions intensity of mined dilbit PFT in 2018 - Includes emissions during Fort Hills ramp-up to full production where emissions are typically higher - Fort Hills total life cycle emissions 1.6% lower than the average crude oil refined in the US • Fort Hills performance in 2019 was 13% better than 2018 despite Alberta Government curtailment Fort Hills emissions are decreasing year-over-year
  • 150.
    Fort Hills GHGEmissions Emissions Boundaries 150 Well to Wheels Upstream (Direct) Emissions Source: IHS Markit, Teck. Downstream (Indirect) Emissions
  • 151.
    Fort Hills BlendWidely Accepted In Market A preferred feedstock and supplier of choice We produce a high quality refinery feedstock • Low GHG intensity: <50% of US crude supply • Including in-situ and upgraded synthetic Our sales mix provides diverse market access • Pipeline connected with rail loading as needed • Hardisty and US Gulf Coast core markets 151 8.0 28.5 Hardisty/US Gulf Coast Monthly Sales Hardisty: Term Contracts Teck Blend: 36.5 kbpd Teck’s Expected Commercial Activities In 2021 Bitumen production 28.0 kbpd1 + Diluent acquisition 8.5 kbpd = Bitumen blend sales 36.5 kbpd Teck’s Delivery Location (kbpd) We are well positioned for future opportunities
  • 152.
    Sufficient Pipeline Capacityas of 2022/2023 Narrow differentials expected with incremental export capacity 152 3 4 5 6 2019 2020 2021 2022 2023 2024 2025 Total Available Supply Current Market Access Pipe Optimization Enbridge Line 3 TransMountain TMX Rail Near term: • Rail shipments reduced in 2020 on shut-in production, higher in 2021 Pipeline development progressing: • Enbridge: 370 kbpd (Q4 2021) • TMX: 600 kbpd (Q4 2022) Longer term: • Global heavy refining capacity increase • US, India and China largest heavy importers Western Canada Crude Oil Takeaway Capacity1
  • 153.
    Endnotes: Energy Slide 145:Energy Benchmark Pricing 1. The WTI CMA is an average of the daily settle quoted price for WTI prices for future deliveries for the trading days during a calendar month. Source: CME Group. As at April 28, 2021. 2. WCS at Hardisty: an index value determined during the trading period, which is typically the first 9 to 11 business days of the month prior to the month of delivery and does not include trades done after this trading period or during the month of delivery. Sources: Net Energy and CalRock. As at April 28, 2021. 3. Source: Link, PVM and Platts. A simple average of Link brokerage, PVM and Platts assessments for the month of delivery during the trading period, which is typically the 25th of two months prior to the month of delivery to the 25th of the month prior to the month of delivery. As April 28, 2021. Slide 146: Fort Hills is a Modern Oil Sands Mine 1. Full production rates in Q4 2021 refers to 175,000 – 185,000 barrels per day 2. On, October 23, 2020, the Government of Alberta announced that it will not issue monthly production limits effective December 2020 production month. Since December 2020, operators will be able to produce above their previously issued production limits without having to purchase curtailment credits or apply for Special Production Allowances. The curtailment rules have been extended to December 31, 2021, however, the Government of Alberta, will only issue Ministerial Orders to limit production when they feel it is needed. If required, Ministerial Orders will be issued with 30-60 days’ notice to allow time for curtailed producers to respond and plan accordingly. The Fort Hills Partners continue to monitor the business environment and assess plans to maximize cash flow, including the potential to increase production. Slide 147: Canada is a Leader in ESG 1. Source: Transparency International Corruption Perceptions Index 2017 (y-axis). BP Statistical Review 2017 (x-axis). Slide 148: Best in Class Low Carbon Intensity Production 1. Bitumen production assumes the mid-point of our 2021 production guidance range. Slide 152: Sufficient Pipeline Capacity as of 2022/2023 1. Source: IHSMarkit, Teck. 153
  • 154.
  • 155.
    Non-GAAP Financial Measures 155 Ourfinancial results are prepared in accordance with International Financial Reporting Standards (IFRS) as issued by the International Accounting Standards Board. This document refers to a number of Non-GAAP Financial Measures which are not measures recognized under IFRS and do not have a standardized meaning prescribed by IFRS or Generally Accepted Accounting Principles (GAAP) in the United States. The Non-GAAP Measures described below do not have standardized meanings under IFRS, may differ from those used by other issuers, and may not be comparable to such measures as reported by others. These measures have been derived from our financial statements and applied on a consistent basis as appropriate. We disclose these measures because we believe they assist readers in understanding the results of our operations and financial position and are meant to provide further information about our financial results to investors. These measures should not be considered in isolation or used in substitute for other measures of performance prepared in accordance with IFRS. Adjusted profit attributable to shareholders – For adjusted profit, we adjust profit attributable to shareholders as reported to remove the after-tax effect of certain types of transactions that reflect measurement changes on our balance sheet or are not indicative of our normal operating activities. We believe adjusted profit helps us and readers better understand the results of our core operating activities and the ongoing cash generating potential of our business. Adjusted basic earnings per share – Adjusted basic earnings per share is adjusted profit divided by average number of shares outstanding in the period. Adjusted diluted earnings per share – Adjusted diluted earnings per share is adjusted profit divided by average number of fully diluted shares in a period. EBITDA – EBITDA is profit before net finance expense, provision for income taxes, and depreciation and amortization. Adjusted EBITDA – Adjusted EBITDA is EBITDA before the pre-tax effect of the adjustments that we make to adjusted profit attributable to shareholders as described above. The adjustments described above to profit attributable to shareholders and EBITDA highlight items and allow us and readers to analyze the rest of our results more clearly. We believe that disclosing these measures assists readers in understanding the ongoing cash generating potential of our business in order to provide liquidity to fund working capital needs, service outstanding debt, fund future capital expenditures and investment opportunities, and pay dividends. Gross profit before depreciation and amortization – Gross profit before depreciation and amortization is gross profit with the depreciation and amortization expense added back. We believe this measure assists us and readers to assess our ability to generate cash flow from our business units or operations. Gross profit margins before depreciation – Gross profit margins before depreciation are gross profit before depreciation and amortization, divided by revenue for each respective business unit. We believe this measure assists us and readers to compare margins on a percentage basis among our business units. Unit costs – Unit costs for our steelmaking coal operations are total cost of goods sold, divided by tonnes sold in the period, excluding depreciation and amortization charges. We include this information as it is frequently requested by investors and investment analysts who use it to assess our cost structure and margins and compare it to similar information provided by many companies in the industry. Adjusted site cash cost of sales – Adjusted site cash cost of sales for our steelmaking coal operations is defined as the cost of the product as it leaves the mine excluding depreciation and amortization charges, out-bound transportation costs and any one-time collective agreement charges and inventory write-down provisions. Total cash unit costs – Total cash unit costs for our copper and zinc operations includes adjusted cash costs of sales, as described above, plus the smelter and refining charges added back in determining adjusted revenue. This presentation allows a comparison of total cash unit costs, including smelter charges, to the underlying price of copper or zinc in order to assess the margin for the mine on a per unit basis. Net cash unit costs – Net cash unit costs of principal product, after deducting co-product and by-product margins, are also a common industry measure. By deducting the co- and by-product margin per unit of the principal product, the margin for the mine on a per unit basis may be presented in a single metric for comparison to other operations. Readers should be aware that this metric, by excluding certain items and reclassifying cost and revenue items, distorts our actual production costs as determined under IFRS. Adjusted cash cost of sales – Adjusted cash cost of sales for our copper and zinc operations is defined as the cost of the product delivered to the port of shipment, excluding depreciation and amortization charges, any one- time collective agreement charges or inventory write-down provisions and by-product cost of sales. It is common practice in the industry to exclude depreciation and amortization as these costs are non-cash and discounted cash flow valuation models used in the industry substitute expectations of future capital spending for these amounts. Adjusted operating costs – Adjusted operating costs for our energy business unit is defined as the costs of product as it leaves the mine, excluding depreciation and amortization charges, cost of diluent for blending to transport our bitumen by pipeline, cost of non-proprietary product purchased and transportation costs of our product and non-proprietary product and any one-time collective agreement charges or inventory write-down provisions.
  • 156.
    Non-GAAP Financial Measures 156 Cashmargins for by-products – Cash margins for by-products is revenue from by- and co-products, less any associated cost of sales of the by and co-product. In addition, for our copper operations, by-product cost of sales also includes cost recoveries associated with our streaming transactions. Adjusted revenue – Adjusted revenue for our copper and zinc operations excludes the revenue from co-products and by-products, but adds back the processing and refining charges to arrive at the value of the underlying payable pounds of copper and zinc. Readers may compare this on a per unit basis with the price of copper and zinc on the LME. Adjusted revenue for our energy business unit excludes the cost of diluent for blending and non-proprietary product revenues, but adds back crown royalties to arrive at the value of the underlying bitumen. Blended bitumen revenue – Blended bitumen revenue is revenue as reported for our energy business unit, but excludes non-proprietary product revenue, and adds back crown royalties that are deducted from revenue. Blended bitumen price realized – Blended bitumen price realized is blended bitumen revenue divided by blended bitumen barrels sold in the period. Operating netback – Operating netbacks per barrel in our energy business unit are calculated as blended bitumen sales revenue net of diluent expenses (also referred to as bitumen price realized), less crown royalties, transportation and operating expenses divided by barrels of bitumen sold. We include this information as investors and investment analysts use it to measure our profitability on a per barrel basis and compare it to similar information provided by other companies in the oil sands industry. The debt-related measures outlined below are disclosed as we believe they provide readers with information that allows them to assess our credit capacity and the ability to meet our short and long-term financial obligations. Net debt – Net debt is total debt, less cash and cash equivalents. Debt to debt-plus-equity ratio – debt to debt-plus-equity ratio takes total debt as reported and divides that by the sum of total debt plus total equity, expressed as a percentage. Net debt to net debt-plus-equity ratio – net debt to net debt-plus-equity ratio is net debt divided by the sum of net debt plus total equity, expressed as a percentage. Debt to Adjusted EBITDA ratio – debt to adjusted EBITDA ratio takes total debt as reported and divides that by adjusted EBITDA for the twelve months ended at the reporting period, expressed as the number of times adjusted EBITDA needs to be earned to repay all of the outstanding debt. Net debt to Adjusted EBITDA ratio – net debt to adjusted EBITDA ratio is the same calculation as the debt to adjusted EBITDA ratio, but using net debt as the numerator. Net debt to capitalization ratio – net debt to capitalization ratio is net debt divided by the sum of total debt plus equity attributable to shareholders. The ratio is a financial covenant under our revolving credit facility.
  • 157.
    Non-GAAP Financial Measures 157 Reconciliationof Profit (Loss) and Adjusted Profit (C$ in millions) Three months ended March 31, 2021 Three months ended March 31, 2020 Profit (loss) attributable to shareholders $ 305 $ (312) Add (deduct) on an after-tax basis: Asset impairments - 474 COVID-19 costs - 22 Environmental costs (33) (87) Inventory write-downs (reversals) (6) 27 Share-based compensation 10 (22) Commodity derivative losses 15 15 Taxes and other 35 (23) Adjusted profit attributable to shareholders $ 326 $ 94 Adjusted basic earnings per share $ 0.61 $ 0.17 Adjusted diluted earnings per share $ 0.61 $ 0.17
  • 158.
    Non-GAAP Financial Measures 158 (Pershare amounts) Three months ended March 31, 2021 Three months ended March 31, 2020 Basic earnings (loss) per share $ 0.57 $ (0.57) Add (deduct): Asset impairments - 0.87 COVID-19 costs - 0.04 Environmental costs (0.06) (0.16) Inventory write-downs (reversals) (0.01) 0.05 Share-based compensation 0.02 (0.04) Commodity derivative losses 0.03 0.03 Other 0.06 (0.05) Adjusted basic earnings per share $ 0.61 $ 0.17 Reconciliation of Basic Earnings (Loss) Per Share to Adjusted Basic Earnings (Loss) Per Share
  • 159.
    Non-GAAP Financial Measures 159 (Pershare amounts) Three months ended March 31, 2021 Three months ended March 31, 2020 Diluted earnings (loss) per share $ 0.57 $ (0.57) Add (deduct): Asset impairments - 0.87 COVID-19 costs - 0.04 Environmental costs (0.06) (0.16) Inventory write-downs (reversals) (0.01) 0.05 Share-based compensation 0.02 (0.04) Commodity derivative losses 0.03 0.03 Other 0.06 (0.05) Adjusted diluted earnings per share $ 0.61 $ 0.17 Reconciliation of Diluted Earnings (Loss) Per Share to Adjusted Diluted Earnings Per Share
  • 160.
    (C$ in millions) (A) Twelvemonths ended December 31, 2020 (B) Three months ended March 31, 2020 (C) Three months ended March 31, 2021 (A-B+C) Twelve months ended March 31, 2021 Profit (loss) $ (944) $ (311) $ 292 $ (341) Finance expense net of finance income 268 47 51 272 Provision for (recovery of) income taxes (192) (69) 209 86 Depreciation and amortization 1,510 378 378 1,510 EBITDA $ 642 $ 45 $ 930 $ 1,527 Add (deduct): Asset impairments 1,244 647 - 597 COVID-19 costs 336 44 - 292 Environmental costs 270 (121) (46) 345 Inventory write-downs (reversals) 134 36 (10) 88 Share-based compensation 47 (30) 14 91 Commodity derivative losses (gains) (62) 21 20 (63) Other (41) (34) 59 52 Adjusted EBITDA (D) $ 2,570 $ 608 $ 967 (E) $ 2,929 Non-GAAP Financial Measures 160 Reconciliation of Net Debt to Adjusted EBITDA Ratio
  • 161.
    (C$ in millions) (A) Twelvemonths ended December 31, 2020 (B) Three months ended March 31, 2020 (C) Three months ended March 31, 2021 (A-B+C) Twelve months ended March 31, 2021 Total debt at period end (F) $ 6,947 (G) $ 7,385 Less: cash and cash equivalents at period end (450) (369) Net debt (H) $ 6,497 (I) $ 7,016 Debt to adjusted EBITDA ratio (F/D) 2.7 (G/E) 2.5 Net debt to adjusted EBITDA ratio (H/D) 2.5 (I/E) 2.4 Equity attributable to shareholders of the company (J) 20.039 (K) 20.372 Obligation to Neptune Bulk Terminals (L) 138 (M) 150 Adjusted net debt to capitalization ratio (H+L)/(F+J+L) 0.24 (I+M)/(G+K+M) 0.26 Non-GAAP Financial Measures We include net debt measures as we believe they provide readers with information that allows them to assess our credit capacity and the ability to meet our short and long-term financial obligations, as well as providing a comparison to our peers. 161 Reconciliation of Net Debt to Adjusted EBITDA Ratio - Continued
  • 162.
    Non-GAAP Financial Measures 162 (C$in millions) Three months ended March 31, 2021 Three months ended March 31, 2020 Profit (loss) $ 292 $ (311) Finance expense net of finance income 51 47 Provision for (recovery of) income taxes 209 (69) Depreciation and amortization 378 378 EBITDA $ 930 $ 45 Add (deduct): Asset impairments - 647 COVID-19 costs - 44 Environmental costs (46) (121) Inventory write-downs (reversals) (10) 36 Share-based compensation 14 (30) Commodity derivative losses 20 21 Taxes and other 59 (34) Adjusted EBITDA $ 967 $ 608 Reconciliation of EBITDA and Adjusted EBITDA
  • 163.
    Non-GAAP Financial Measures 163 Reconciliationof Gross Profit Before Depreciation and Amortization (C$ in millions) Three months ended March 31, 2021 Three months ended March 31, 2020 Gross profit $ 654 $ 398 Depreciation and amortization 378 378 Gross profit before depreciation and amortization $ 1,032 $ 776 Reported as: Copper Highland Valley Copper $ 202 $ 77 Antamina 202 123 Carmen de Andacollo 47 60 Quebrada Blanca 11 3 Other - (1) 462 262 Zinc Trail Operations 43 11 Red Dog 125 158 Other 3 14 171 183 Steelmaking coal 412 421 Energy (13) (90) Gross profit before depreciation and amortization $ 1,032 $ 776
  • 164.
    Non-GAAP Financial Measures 164 (C$in millions) Three months ended March 31, 2021 Three months ended March 31, 2020 Revenues Copper (A) $ 767 $ 570 Zinc (B) 570 608 Steelmaking coal (C) 1,047 1,023 Energy (D) 163 176 Total $ 2,547 $ 2,377 Gross profit (loss) before depreciation and amortization Copper (E) $ 462 $ 262 Zinc (F) 171 183 Steelmaking coal (G) 412 421 Energy (H) (13) (90) Total $ 1,032 $ 776 Gross profit margins before depreciation Copper (A/E) 60% 46% Zinc (B/F) 30% 30% Steelmaking coal (C/G) 39% 41% Energy (D/H) (8)% (51)% Reconciliation of Gross Profit (Loss) Margins Before Depreciation
  • 165.
    Non-GAAP Financial Measures 1.Average period exchange rates are used to convert to US$ per pound equivalent. We include unit cost information as it is frequently requested by investors and investment analysts who use it to assess our cost structure and margins and compare it to similar information provided by many companies in our industry. 165 (C$ in millions, except where noted) Three months ended March 31, 2021 Three months ended March 31, 2020 Revenue as reported $ 767 $ 570 By-product revenue (A) (85) (77) Smelter processing charges (B) 30 37 Adjusted revenue $ 712 $ 530 Cost of sales as reported $ 401 $ 414 Less: Depreciation and amortization (96) (106) By-product cost of sales (C) (20) (20) Adjusted cash cost of sales (D) $ 285 $ 288 Payable pounds sold (millions) (E) 143.4 155.8 Per unit amounts (C$/lb) Adjusted cash cost of sales (D/E) $ 1.99 $ 1.85 Smelter processing charges (B/E) 0.21 0.24 Total cash unit costs (C$/lb) $ 2.20 $ 2.09 Cash margin for by-products (C$/lb) ((A-C)/E) (0.45) (0.37) Net cash unit costs (C$/lb) $ 1.75 $ 1.72 US$ AMOUNTS1 Average exchange rate (C$/US$) $ 1.27 $ 1.34 Per unit amounts (US$/lb) Adjusted cash cost of sales $ 1.57 $ 1.38 Smelter processing charges 0.16 0.18 Total cash unit costs (US$/lb) $ 1.73 $ 1.56 Cash margin for by-products (US$/lb) (0.35) (0.28) Net cash unit costs (US$/lb) $ 1.38 $ 1.28 Copper Unit Cost Reconciliation
  • 166.
    Non-GAAP Financial Measures Weinclude unit cost information as it is frequently requested by investors and investment analysts who use it to assess our cost structure and margins and compare it to similar information provided by many companies in our industry. 166 (C$ in millions, except where noted) Three months ended March 31, 2021 Three months ended March 31, 2020 Revenue as reported $ 570 $ 608 Less: Trail Operations revenues as reported (461) (452) Other revenues as reported (2) (2) Add back: Intra-segment revenues as reported 130 96 $ 237 $ 250 By-product revenue (A) (2) (2) Smelter processing charges (B) 75 77 Adjusted revenue $ 310 $ 325 Cost of sales as reported $ 445 $ 489 Less: Trail Operations cost of sales as reported (439) (463) Other costs of sales as reported 1 12 Add back: Intra-segment as reported 130 96 $ 137 $ 134 Less: Depreciation and amortization (25) (42) Royalty costs (36) (13) By-product cost of sales (C) - - Adjusted cash cost of sales (D) $ 76 $ 79 Zinc Unit Cost Reconciliation (Mining Operations)
  • 167.
    Non-GAAP Financial Measures 167 ZincUnit Cost Reconciliation (Mining Operations) - Continued (C$ in millions, except where noted) Three months ended March 31, 2021 Three months ended March 31, 2020 Payable pounds sold (millions) (E) 195.3 251.3 Per unit amounts (C$/lb) Adjusted cash cost of sales (D/E) $ 0.39 $ 0.31 Smelter processing charges (B/E) 0.38 0.31 Total cash unit costs (C$/lb) $ 0.77 $ 0.62 Cash margin for by-products (C$/lb) ((A-C)/B) (0.01) (0.01) Net cash unit costs (C$/lb) $ 0.76 $ 0.61 US$ AMOUNTS1 Average exchange rate (C$/US$) $ 1.27 $ 1.34 Per unit amounts (US$/lb) Adjusted cash cost of sales $ 0.31 $ 0.23 Smelter processing charges 0.30 0.23 Total cash unit costs (US$/lb) $ 0.61 $ 0.46 Cash margin for by-products (US$/lb) (0.01) (0.01) Net cash unit costs (US$/lb) $ 0.60 $ 0.45 1. Average period exchange rates are used to convert to US$ per tonne equivalent. We include unit cost information as it is frequently requested by investors and investment analysts who use it to assess our cost structure and margins and compare it to similar information provided by many companies in our industry.
  • 168.
    Non-GAAP Financial Measures 1.Average period exchange rates are used to convert to US$ per tonne equivalent. We include unit cost information as it is frequently requested by investors and investment analysts who use it to assess our cost structure and margins and compare it to similar information provided by many companies in our industry. 168 (C$ in millions, except where noted) Three months ended March 31, 2021 Three months ended March 31, 2020 Cost of sales as reported $ 851 $ 777 Less: Transportation costs (256) (242) Depreciation and amortization (216) (175) Inventory (write-down) reversal 10 5 Adjusted site cash cost of sales $ 389 $ 365 Tonnes sold (millions) 6.2 5.7 Per unit amounts (C$/t) Adjusted site cash cost of sales $ 63 $ 64 Transportation costs 41 43 Inventory write-downs (2) (1) Unit costs (C$/t) $ 102 $ 106 US$ AMOUNTS1 Average exchange rate (C$/US$) $ 1.27 $ 1.34 Per unit amounts (US$/t) Adjusted site cash cost of sales $ 49 $ 48 Transportation costs 33 32 Inventory write-downs (reversals) (2) (1) Unit costs (US$/t) $ 80 $ 79 Steelmaking Coal Unit Cost Reconciliation
  • 169.
    Non-GAAP Financial Measures 1.Reflects adjustments for costs not directly attributed to the production of Fort Hills bitumen, including transportation for non-proprietary product purchased. 169 (C$ in millions, except where noted) Three months ended March 31, 2021 Three months ended March 31, 2020 Revenue as reported $ 163 $ 176 Less: Cost of diluent for blending (54) (97) Non-proprietary product revenue (28) (7) Add back: Crown royalties (D) 1 3 Adjusted revenue (A) $ 82 $ 75 Cost of sales as reported $ 196 $ 298 Less: Depreciation and amortization (20) (33) Bitumen and diluent inventory write-downs - (23) Cash cost of sales $ 176 $ 242 Less: Cost of diluent for blending (54) (97) Cost of non-proprietary product purchased (25) (3) Transportation costs for non-proprietary product purchased1 (4) (1) Transportation costs for FRB (C) (24) (29) Adjusted operating costs (E) $ 69 $ 112 Blended bitumen barrels sold (000’s) 2,275 4,419 Less: diluent barrels included in blended bitumen (000’s) (598) (1,177) Bitumen barrels sold (000’s) (B) 1,677 3,242 Energy Operating Netback, Bitumen & Blended Bitumen Price Realized Reconciliations
  • 170.
    Non-GAAP Financial Measures 1.Bitumen price realized represents the realized petroleum revenue (blended bitumen sales revenue) net of diluent expense, expressed on a per barrel basis. Blended bitumen sales revenue represents revenue from our share of the heavy crude oil blend known as Fort Hills Reduced Carbon Life Cycle Dilbit Blend (FRB), sold at the Hardisty and U.S. Gulf Coast market hubs. FRB is comprised of bitumen produced from Fort Hills blended with purchased diluent. The cost of blending is affected by the amount of diluent required and the cost of purchasing, transporting and blending the diluent. A portion of diluent expense is effectively recovered in the sales price of the blended product. Diluent expense is also affected by Canadian and U.S. benchmark pricing and changes in the value of the Canadian dollar relative to the U.S. dollar. 2. Reflects adjustments for costs not directly attributed to the production of Fort Hills bitumen, including transportation for non-proprietary product purchased. We include unit cost information as it is frequently requested by investors and investment analysts who use it to assess our cost structure and margins and compare it to similar information provided by many companies in our industry. 170 Energy Operating Netback, Bitumen & Blended Bitumen Price Realized Reconciliations - Continued (C$ in millions, except where noted) Three months ended March 31, 2021 Three months ended March 31, 2020 Per barrel amounts (C$) Bitumen price realized1 (A/B) $ 49.59 $ 23.12 Crown royalties (D/B) (0.88) (0.92) Transportation costs for FRB2 (C/B) (14.53) (8.81) Adjusted operating costs (E/B) (40.68) (34.88) Operating netback (C$/barrel) $ (6.50) $ (21.49) Revenue as reported $ 163 $ 176 Less: Non-proprietary product revenue (28) (7) Add back: Crown royalties 1 3 Blended bitumen revenue (A) $ 136 $ 172 Blended bitumen barrels sold (000s) (B) 2.275 4,419 Blended bitumen price realized1 (C$) (A/B)=D $ 60.27 $ 38.87 Average exchange rate (C$ per US$1) (C) 1.27 1.34 Blended bitumen price realized (US$/barrel) (D/C) $ 47.58 $ 28.92
  • 171.
    Non-GAAP Financial Measures 171 Reconciliationof Free Cash Flow (C$ in millions) 2003 to Q1 2021 Cash Flow from Operations $48,735 Debt interest paid (5,933) Capital expenditures, including capitalized stripping costs (29,605) Payments to non-controlling interests (NCI) (652) Free Cash Flow $12,545 Dividends paid $4,514 Payout ratio 36%
  • 172.
    Global Basic Materials Conference June10, 2021 Don Lindsay President and Chief Executive Officer