SlideShare a Scribd company logo
Blockmodels
Based on Wasserman and Faust (1994) Chapter 10
Blockmodels represent hypothesized relations (ties) among actors occupying
structurally equivalent positions (blocks) in networks (see W&F Chap 9 on SE).
Blockmodel – a partition of the set of g actors, in one or more relational networks,
into B discrete positions, with permuted and blocked matrices showing the
presence or absence of ties within and between positions for each type of relation.
Image – a reduced BxB blockmodel matrix whose 0-1 entries show the presence
and absence of ties among the B positions
oneblock (bond): image entry = 1, a tie from row block to column block
zeroblock: image entry = 0, no tie from row to column blocks
Because several actors may jointly occupy a position, the intrablock relations
in blockmodels and images have different implications than the self-ties in
actor-based matrices, which are usually ignored as undefined.
In a world trade blockmodel image, a main-diagonal entry shows whether
nations occupying that block exchange goods among themselves. An off-
diagonal entry shows the trade flows between the nations occupying different
structurally equivalent positions.
BUILDING BLOCKS
A blockmodel could be constructed theoretically, by an analyst imposing the
positions she believes to represent structurally equivalent blocks. For example, sort
the employees of different departments into separate blocks. Or apply a method,
such as CONCOR, to identify the s.e. positions from the empirical relations in the
data. In both approaches, the resulting blockmodel is a permuted and partitioned
matrix that locates the actors occupying a position in adjacent rows and columns.
Unfortunately, the positions in a blocked matrix rarely exhibit perfect (strict)
structural equivalence: a submatrix filled with either all 1s (“fat fit”) or all 0s (“lean
fit”), meaning that all block actors have identical relations, either with one another or
with every actor in another block. Blockmodels of real social data typically find
positions that contain mixtures of 1s and 0s. The analyst must then decide on some
criterion for assigning either 0 or 1 to each cell of the blockmodel image.
SOC8412 Social Network Analysis Fall 2008
For a binary network, most blockmodelers use an α density criterion to determine
the image matrix:
• If the intra- or interblock proportion of direct ties is above the α density,
recode that block = 1 in the image matrix.
• If the density of direct ties falls below the specified cutoff density, recode that
image block = 0.
For a network of valued relations, an analyst might recode the image according to
whether each block’s density is above or below the network mean density.
Suppose a 4x4 blocking finds these submatrix proportions, where the overall
mean network density = 0.30:
Block I Block II Block III Block IV
Block I 0.70 0.48 0.27 0.19
Block II 0.33 0.40 0.31 0.11
Block III 0.37 0.30 0.29 0.08
Block IV 0.32 0.29 0.02 0.12
Then using 0.30 as the α density criterion, the blockmodel image is:
1 1 0 0
1 1 1 0
1 1 0 0
1 0 0 0
The cells in red draw attention to three positions whose densities are just
above or just below the α cutoff. Increasing the α criterion (e.g., to 0.40) or
lowering it (e.g., to 0.20) would produce a much different blockmodel images
with fewer or more oneblocks, respectively.
SOC8412 Social Network Analysis Fall 2008 2
BLOCKMODELS & IMAGES of MULTIPLEX RELATIONS
A blockmodel that simultaneously blocks two or more relations by partitioning actors
into structurally equivalent positions may produce distinctive images for each
matrix. This example blocks two asymmetric networks -- money and information
exchange -- among 10 Indianapolis organizations (Knoke and Kuklinski 1982:44).
First, import both matrices into UCINET and create two transposes. Use
“Data/Join” to stack all four matrices into a single 40x10 data array. Next, use
“Tools/Similarities” to compute the matrix of correlations among pairs of
columns:
1 2 3 4 5 6 7 8 9 10
County Counci Educat Indust Mayor WRO Newspa United Welfar Westen
------ ------ ------ ------ ------ ------ ------ ------ ------ ------
1 County 1.000 0.142 0.150 0.451 0.278 0.105 0.298 0.257 0.341 0.107
2 Council 0.142 1.000 -0.061 0.142 0.404 0.350 0.297 0.143 0.142 0.207
3 Education 0.150 -0.061 1.000 0.043 -0.041 -0.102 0.316 0.375 0.471 0.171
4 Industry 0.451 0.142 0.043 1.000 0.383 0.105 0.298 0.150 0.341 0.358
5 Mayor 0.278 0.404 -0.041 0.383 1.000 0.317 0.323 -0.041 0.068 0.153
6 WRO 0.105 0.350 -0.102 0.105 0.317 1.000 -0.086 0.068 -0.070 0.419
7 Newspaper 0.298 0.297 0.316 0.298 0.323 -0.086 1.000 0.000 0.406 0.077
8 UnitedWay 0.257 0.143 0.375 0.150 -0.041 0.068 0.000 1.000 0.257 0.293
9 Welfare 0.341 0.142 0.471 0.341 0.068 -0.070 0.406 0.257 1.000 0.358
10 Westend 0.107 0.207 0.171 0.358 0.153 0.419 0.077 0.293 0.358 1.000
Then use CONCOR on the saved correlation matrix to find a 2-level partition
(4 blocks); answer “YES” to “input is corr mat”. Here’s the cluster diagram
showing which orgs belong to which block:
SOC8412 Social Network Analysis Fall 2008 3
Use “Transform/Block” to impose two separate blockmodels on the original
info and money matrices, according to the partition results above. Tell this
program which actors belong to which blocks by entering a sequence of
numbers, into the “Row partition/blocking (if any)” and “Column
partition/blocking” lines, that correspond to the block location of each actor.
Indianapolis orgs 1-10 must be sorted into these 4 blocks: 1 3 2 1 3 4 1 2 2 4
Imported from Money.txt
1
1 7 4 3 9 8 5 2 6 0
C N I E W U M C W W
---------------------------
1 County | | 1 1 1 | 1 | 1 |
7 Newspaper | | 1 | 1 | |
4 Industry | 1 | 1 1 1 | 1 | |
-----------------------------
3 Education | | 1 | | |
9 Welfare | | 1 1 | | |
8 UnitedWay | | 1 | | 1 |
-----------------------------
5 Mayor | | 1 1 1 | 1 | |
2 Council | | 1 | | |
-----------------------------
6 WRO | | | | |
10 Westend | | | | |
----------------------------
Reduced BlockMatrix
1 2 3 4
----- ----- ----- -----
1 0.167 0.778 0.500 0.167
2 0.000 0.667 0.000 0.167
3 0.000 0.667 0.500 0.000
4 0.000 0.000 0.000 0.000
Finally, if you save the Reduced BlockMatrix densities (by typing a name into
the “(Output) Reduced image dataset” line), you can then obtain its image
with the “Transform/Dichotomize” program. For “Cut-Off Operator” choose
“GE - Greater Than or Equal” and for “Cut-Off Value” set the α density
criterion at 0.50. The resulting money exchange image is:
Rule: y(i,j) = 1 if x(i,j) >= 0.50, and 0 otherwise.
Reduced BlockMatrix
1 2 3 4
- - - -
1 0 1 1 0
2 0 1 0 0
3 0 1 1 0
4 0 0 0 0
SOC8412 Social Network Analysis Fall 2008 4
The same procedures applied to the denser Indianapolis information matrix
yields different results, with four “fat fit” and two “lean fit” blocks:
Imported from Information.txt
1
1 7 4 3 9 8 5 2 6 0
C N I E W U M C W W
---------------------------
1 County | 1 | 1 | 1 1 | |
7 Newspaper | 1 | | 1 1 | |
4 Industry | 1 1 | | 1 1 | |
-----------------------------
3 Education | 1 1 | | 1 1 | 1 1 |
9 Welfare | 1 | | 1 1 | |
8 UnitedWay | 1 1 1 | 1 | 1 1 | |
-----------------------------
5 Mayor | 1 1 1 | 1 1 1 | 1 | 1 |
2 Council | 1 1 1 | 1 1 1 | 1 | |
-----------------------------
6 WRO | 1 | 1 1 | | |
10 Westend | 1 1 | 1 | 1 1 | |
----------------------------
Reduced BlockMatrix
1 2 3 4
----- ----- ----- -----
1 0.667 0.111 1.000 0.000
2 0.667 0.167 1.000 0.333
3 1.000 1.000 1.000 0.250
4 0.500 0.500 0.500 0.000
Rule: y(i,j) = 1 if x(i,j) >= 0.50, and 0 otherwise.
Reduced BlockMatrix
1 2 3 4
- - - -
1 1 0 1 0
2 1 0 1 0
3 1 1 1 0
4 1 1 1 0
Analogous methods apply to blockmodeling valued-relations networks, but might
use a maximum value, mean value, or some other cut-off criterion to recode
continuous scores into the 0-1 entries of an image (p. 406-8).
SOC8412 Social Network Analysis Fall 2008 5
Blockmodel Interpretation
Blockmodels are theoretical or empirical hypotheses about structural relations in a
network, which refer to positions not to individual actors. W&F discuss three ways
to interpret a blockmodel or its image:
• Validation using actor attributes: Look for common characteristics of
actors within a block that set them apart for other blocks. Does the position
comprise an implicit “type of actor” to which you could fix a meaningful label?
In international trade, are nations clustered by geography and/or level of
economic development?
One interpretation of the contrasting Indianapolis money & information
exchange blockmodels is that the positions are differentiated by the
organizations’ primary functions or goals. The main money recipient is
the service-provider position {Education, Welfare, United Way}, while
the main information targets are the elite position {County, Industry,
Newspaper} and city government position {Mayor, City Council}. The
neighborhood position {Welfare Rights Org and Westend} receives
neither money nor information from any position, although it claims to
send information to the other three.
• Describe individual positions: Examine the patterns of interblock relations
for clues about the social roles each position plays. Some blocks may be
generic types identified by their in- and outdegree ratios (isolates, receivers,
transmitters, and carriers/ordinaries), as well as by their within-block
connections (see typologies developed by Burt [1976], Richards [1989], and
Marsden [1989]). Other positions might be better described by interpreting
the substantive contents of their multiplex relations. The Indianapolis city
government position is both a money and information provider, while the
power elite block is mainly a money supplier.
• Image Matrices: By ignoring the individual actors and considering only the
entire configuration of ties among positions displayed in the images,
researchers may be able to distinguish some formal properties. White,
Boorman and Breiger (1976) described 10 distinct arrangements of 0s and 1s
for two-block images (W&F p. 421). Three-position images have 104 distinct
image matrices; W&F apply intriguing labels to several “ideal” images
(center-periphery, hierarchy, transitive).
No mechanical, fool-proof method exists for interpreting blockmodels and images.
As usual in network research, analysts must apply all their substantive knowledge
about the system to make imaginative and insightful interpretations.
SOC8412 Social Network Analysis Fall 2008 6

More Related Content

Similar to Blockmodels

InstructionsPlease answer the following question in a minimum.docx
InstructionsPlease answer the following question in a minimum.docxInstructionsPlease answer the following question in a minimum.docx
InstructionsPlease answer the following question in a minimum.docx
dirkrplav
 
s1233587_Report
s1233587_Reports1233587_Report
s1233587_Report
Ralica Bencheva
 
Garbage Classification Using Deep Learning Techniques
Garbage Classification Using Deep Learning TechniquesGarbage Classification Using Deep Learning Techniques
Garbage Classification Using Deep Learning Techniques
IRJET Journal
 
CLIM Program: Remote Sensing Workshop, Blocking Methods for Spatial Statistic...
CLIM Program: Remote Sensing Workshop, Blocking Methods for Spatial Statistic...CLIM Program: Remote Sensing Workshop, Blocking Methods for Spatial Statistic...
CLIM Program: Remote Sensing Workshop, Blocking Methods for Spatial Statistic...
The Statistical and Applied Mathematical Sciences Institute
 
Data Science Salon: MCL Clustering of Sparse Graphs
Data Science Salon: MCL Clustering of Sparse GraphsData Science Salon: MCL Clustering of Sparse Graphs
Data Science Salon: MCL Clustering of Sparse Graphs
Formulatedby
 
A Proposed Algorithm to Detect the Largest Community Based On Depth Level
A Proposed Algorithm to Detect the Largest Community Based On Depth LevelA Proposed Algorithm to Detect the Largest Community Based On Depth Level
A Proposed Algorithm to Detect the Largest Community Based On Depth Level
Eswar Publications
 
E0333021025
E0333021025E0333021025
E0333021025
theijes
 
Mining the Social Web - Lecture 2 - T61.6020
Mining the Social Web - Lecture 2 - T61.6020Mining the Social Web - Lecture 2 - T61.6020
Mining the Social Web - Lecture 2 - T61.6020
Michael Mathioudakis
 
AN IMPROVED DECISION SUPPORT SYSTEM BASED ON THE BDM (BIT DECISION MAKING) ME...
AN IMPROVED DECISION SUPPORT SYSTEM BASED ON THE BDM (BIT DECISION MAKING) ME...AN IMPROVED DECISION SUPPORT SYSTEM BASED ON THE BDM (BIT DECISION MAKING) ME...
AN IMPROVED DECISION SUPPORT SYSTEM BASED ON THE BDM (BIT DECISION MAKING) ME...
ijmpict
 
Distribution of maximal clique size under
Distribution of maximal clique size underDistribution of maximal clique size under
Distribution of maximal clique size under
ijfcstjournal
 
DISTRIBUTION OF MAXIMAL CLIQUE SIZE UNDER THE WATTS-STROGATZ MODEL OF EVOLUTI...
DISTRIBUTION OF MAXIMAL CLIQUE SIZE UNDER THE WATTS-STROGATZ MODEL OF EVOLUTI...DISTRIBUTION OF MAXIMAL CLIQUE SIZE UNDER THE WATTS-STROGATZ MODEL OF EVOLUTI...
DISTRIBUTION OF MAXIMAL CLIQUE SIZE UNDER THE WATTS-STROGATZ MODEL OF EVOLUTI...
ijfcstjournal
 
IRJET - Exploring Agglomerative Spectral Clustering Technique Employed for...
IRJET - 	  Exploring Agglomerative Spectral Clustering Technique Employed for...IRJET - 	  Exploring Agglomerative Spectral Clustering Technique Employed for...
IRJET - Exploring Agglomerative Spectral Clustering Technique Employed for...
IRJET Journal
 
Bscit spring driveassignments
Bscit spring driveassignmentsBscit spring driveassignments
Bscit spring driveassignments
solved_assignments
 
Data Management.pptx
Data Management.pptxData Management.pptx
Data Management.pptx
NISHASOMSCS113
 
unit 1vlsi notes.pdf
unit 1vlsi notes.pdfunit 1vlsi notes.pdf
unit 1vlsi notes.pdf
AcademicICECE
 
Clique-based Network Clustering
Clique-based Network ClusteringClique-based Network Clustering
Clique-based Network Clustering
Guang Ouyang
 
Chapter 08 2
Chapter 08 2Chapter 08 2
Chapter 08 2
Abhishek Reddy
 
Kakuro: Solving the Constraint Satisfaction Problem
Kakuro: Solving the Constraint Satisfaction ProblemKakuro: Solving the Constraint Satisfaction Problem
Kakuro: Solving the Constraint Satisfaction Problem
Varad Meru
 
Generating synthetic online social network graph data and topologies
Generating synthetic online social network graph data and topologiesGenerating synthetic online social network graph data and topologies
Generating synthetic online social network graph data and topologies
Graph-TA
 
新たなRNNと自然言語処理
新たなRNNと自然言語処理新たなRNNと自然言語処理
新たなRNNと自然言語処理
hytae
 

Similar to Blockmodels (20)

InstructionsPlease answer the following question in a minimum.docx
InstructionsPlease answer the following question in a minimum.docxInstructionsPlease answer the following question in a minimum.docx
InstructionsPlease answer the following question in a minimum.docx
 
s1233587_Report
s1233587_Reports1233587_Report
s1233587_Report
 
Garbage Classification Using Deep Learning Techniques
Garbage Classification Using Deep Learning TechniquesGarbage Classification Using Deep Learning Techniques
Garbage Classification Using Deep Learning Techniques
 
CLIM Program: Remote Sensing Workshop, Blocking Methods for Spatial Statistic...
CLIM Program: Remote Sensing Workshop, Blocking Methods for Spatial Statistic...CLIM Program: Remote Sensing Workshop, Blocking Methods for Spatial Statistic...
CLIM Program: Remote Sensing Workshop, Blocking Methods for Spatial Statistic...
 
Data Science Salon: MCL Clustering of Sparse Graphs
Data Science Salon: MCL Clustering of Sparse GraphsData Science Salon: MCL Clustering of Sparse Graphs
Data Science Salon: MCL Clustering of Sparse Graphs
 
A Proposed Algorithm to Detect the Largest Community Based On Depth Level
A Proposed Algorithm to Detect the Largest Community Based On Depth LevelA Proposed Algorithm to Detect the Largest Community Based On Depth Level
A Proposed Algorithm to Detect the Largest Community Based On Depth Level
 
E0333021025
E0333021025E0333021025
E0333021025
 
Mining the Social Web - Lecture 2 - T61.6020
Mining the Social Web - Lecture 2 - T61.6020Mining the Social Web - Lecture 2 - T61.6020
Mining the Social Web - Lecture 2 - T61.6020
 
AN IMPROVED DECISION SUPPORT SYSTEM BASED ON THE BDM (BIT DECISION MAKING) ME...
AN IMPROVED DECISION SUPPORT SYSTEM BASED ON THE BDM (BIT DECISION MAKING) ME...AN IMPROVED DECISION SUPPORT SYSTEM BASED ON THE BDM (BIT DECISION MAKING) ME...
AN IMPROVED DECISION SUPPORT SYSTEM BASED ON THE BDM (BIT DECISION MAKING) ME...
 
Distribution of maximal clique size under
Distribution of maximal clique size underDistribution of maximal clique size under
Distribution of maximal clique size under
 
DISTRIBUTION OF MAXIMAL CLIQUE SIZE UNDER THE WATTS-STROGATZ MODEL OF EVOLUTI...
DISTRIBUTION OF MAXIMAL CLIQUE SIZE UNDER THE WATTS-STROGATZ MODEL OF EVOLUTI...DISTRIBUTION OF MAXIMAL CLIQUE SIZE UNDER THE WATTS-STROGATZ MODEL OF EVOLUTI...
DISTRIBUTION OF MAXIMAL CLIQUE SIZE UNDER THE WATTS-STROGATZ MODEL OF EVOLUTI...
 
IRJET - Exploring Agglomerative Spectral Clustering Technique Employed for...
IRJET - 	  Exploring Agglomerative Spectral Clustering Technique Employed for...IRJET - 	  Exploring Agglomerative Spectral Clustering Technique Employed for...
IRJET - Exploring Agglomerative Spectral Clustering Technique Employed for...
 
Bscit spring driveassignments
Bscit spring driveassignmentsBscit spring driveassignments
Bscit spring driveassignments
 
Data Management.pptx
Data Management.pptxData Management.pptx
Data Management.pptx
 
unit 1vlsi notes.pdf
unit 1vlsi notes.pdfunit 1vlsi notes.pdf
unit 1vlsi notes.pdf
 
Clique-based Network Clustering
Clique-based Network ClusteringClique-based Network Clustering
Clique-based Network Clustering
 
Chapter 08 2
Chapter 08 2Chapter 08 2
Chapter 08 2
 
Kakuro: Solving the Constraint Satisfaction Problem
Kakuro: Solving the Constraint Satisfaction ProblemKakuro: Solving the Constraint Satisfaction Problem
Kakuro: Solving the Constraint Satisfaction Problem
 
Generating synthetic online social network graph data and topologies
Generating synthetic online social network graph data and topologiesGenerating synthetic online social network graph data and topologies
Generating synthetic online social network graph data and topologies
 
新たなRNNと自然言語処理
新たなRNNと自然言語処理新たなRNNと自然言語処理
新たなRNNと自然言語処理
 

Blockmodels

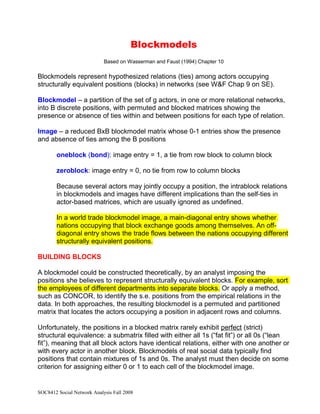
  • 1. Blockmodels Based on Wasserman and Faust (1994) Chapter 10 Blockmodels represent hypothesized relations (ties) among actors occupying structurally equivalent positions (blocks) in networks (see W&F Chap 9 on SE). Blockmodel – a partition of the set of g actors, in one or more relational networks, into B discrete positions, with permuted and blocked matrices showing the presence or absence of ties within and between positions for each type of relation. Image – a reduced BxB blockmodel matrix whose 0-1 entries show the presence and absence of ties among the B positions oneblock (bond): image entry = 1, a tie from row block to column block zeroblock: image entry = 0, no tie from row to column blocks Because several actors may jointly occupy a position, the intrablock relations in blockmodels and images have different implications than the self-ties in actor-based matrices, which are usually ignored as undefined. In a world trade blockmodel image, a main-diagonal entry shows whether nations occupying that block exchange goods among themselves. An off- diagonal entry shows the trade flows between the nations occupying different structurally equivalent positions. BUILDING BLOCKS A blockmodel could be constructed theoretically, by an analyst imposing the positions she believes to represent structurally equivalent blocks. For example, sort the employees of different departments into separate blocks. Or apply a method, such as CONCOR, to identify the s.e. positions from the empirical relations in the data. In both approaches, the resulting blockmodel is a permuted and partitioned matrix that locates the actors occupying a position in adjacent rows and columns. Unfortunately, the positions in a blocked matrix rarely exhibit perfect (strict) structural equivalence: a submatrix filled with either all 1s (“fat fit”) or all 0s (“lean fit”), meaning that all block actors have identical relations, either with one another or with every actor in another block. Blockmodels of real social data typically find positions that contain mixtures of 1s and 0s. The analyst must then decide on some criterion for assigning either 0 or 1 to each cell of the blockmodel image. SOC8412 Social Network Analysis Fall 2008
  • 2. For a binary network, most blockmodelers use an α density criterion to determine the image matrix: • If the intra- or interblock proportion of direct ties is above the α density, recode that block = 1 in the image matrix. • If the density of direct ties falls below the specified cutoff density, recode that image block = 0. For a network of valued relations, an analyst might recode the image according to whether each block’s density is above or below the network mean density. Suppose a 4x4 blocking finds these submatrix proportions, where the overall mean network density = 0.30: Block I Block II Block III Block IV Block I 0.70 0.48 0.27 0.19 Block II 0.33 0.40 0.31 0.11 Block III 0.37 0.30 0.29 0.08 Block IV 0.32 0.29 0.02 0.12 Then using 0.30 as the α density criterion, the blockmodel image is: 1 1 0 0 1 1 1 0 1 1 0 0 1 0 0 0 The cells in red draw attention to three positions whose densities are just above or just below the α cutoff. Increasing the α criterion (e.g., to 0.40) or lowering it (e.g., to 0.20) would produce a much different blockmodel images with fewer or more oneblocks, respectively. SOC8412 Social Network Analysis Fall 2008 2
  • 3. BLOCKMODELS & IMAGES of MULTIPLEX RELATIONS A blockmodel that simultaneously blocks two or more relations by partitioning actors into structurally equivalent positions may produce distinctive images for each matrix. This example blocks two asymmetric networks -- money and information exchange -- among 10 Indianapolis organizations (Knoke and Kuklinski 1982:44). First, import both matrices into UCINET and create two transposes. Use “Data/Join” to stack all four matrices into a single 40x10 data array. Next, use “Tools/Similarities” to compute the matrix of correlations among pairs of columns: 1 2 3 4 5 6 7 8 9 10 County Counci Educat Indust Mayor WRO Newspa United Welfar Westen ------ ------ ------ ------ ------ ------ ------ ------ ------ ------ 1 County 1.000 0.142 0.150 0.451 0.278 0.105 0.298 0.257 0.341 0.107 2 Council 0.142 1.000 -0.061 0.142 0.404 0.350 0.297 0.143 0.142 0.207 3 Education 0.150 -0.061 1.000 0.043 -0.041 -0.102 0.316 0.375 0.471 0.171 4 Industry 0.451 0.142 0.043 1.000 0.383 0.105 0.298 0.150 0.341 0.358 5 Mayor 0.278 0.404 -0.041 0.383 1.000 0.317 0.323 -0.041 0.068 0.153 6 WRO 0.105 0.350 -0.102 0.105 0.317 1.000 -0.086 0.068 -0.070 0.419 7 Newspaper 0.298 0.297 0.316 0.298 0.323 -0.086 1.000 0.000 0.406 0.077 8 UnitedWay 0.257 0.143 0.375 0.150 -0.041 0.068 0.000 1.000 0.257 0.293 9 Welfare 0.341 0.142 0.471 0.341 0.068 -0.070 0.406 0.257 1.000 0.358 10 Westend 0.107 0.207 0.171 0.358 0.153 0.419 0.077 0.293 0.358 1.000 Then use CONCOR on the saved correlation matrix to find a 2-level partition (4 blocks); answer “YES” to “input is corr mat”. Here’s the cluster diagram showing which orgs belong to which block: SOC8412 Social Network Analysis Fall 2008 3
  • 4. Use “Transform/Block” to impose two separate blockmodels on the original info and money matrices, according to the partition results above. Tell this program which actors belong to which blocks by entering a sequence of numbers, into the “Row partition/blocking (if any)” and “Column partition/blocking” lines, that correspond to the block location of each actor. Indianapolis orgs 1-10 must be sorted into these 4 blocks: 1 3 2 1 3 4 1 2 2 4 Imported from Money.txt 1 1 7 4 3 9 8 5 2 6 0 C N I E W U M C W W --------------------------- 1 County | | 1 1 1 | 1 | 1 | 7 Newspaper | | 1 | 1 | | 4 Industry | 1 | 1 1 1 | 1 | | ----------------------------- 3 Education | | 1 | | | 9 Welfare | | 1 1 | | | 8 UnitedWay | | 1 | | 1 | ----------------------------- 5 Mayor | | 1 1 1 | 1 | | 2 Council | | 1 | | | ----------------------------- 6 WRO | | | | | 10 Westend | | | | | ---------------------------- Reduced BlockMatrix 1 2 3 4 ----- ----- ----- ----- 1 0.167 0.778 0.500 0.167 2 0.000 0.667 0.000 0.167 3 0.000 0.667 0.500 0.000 4 0.000 0.000 0.000 0.000 Finally, if you save the Reduced BlockMatrix densities (by typing a name into the “(Output) Reduced image dataset” line), you can then obtain its image with the “Transform/Dichotomize” program. For “Cut-Off Operator” choose “GE - Greater Than or Equal” and for “Cut-Off Value” set the α density criterion at 0.50. The resulting money exchange image is: Rule: y(i,j) = 1 if x(i,j) >= 0.50, and 0 otherwise. Reduced BlockMatrix 1 2 3 4 - - - - 1 0 1 1 0 2 0 1 0 0 3 0 1 1 0 4 0 0 0 0 SOC8412 Social Network Analysis Fall 2008 4
  • 5. The same procedures applied to the denser Indianapolis information matrix yields different results, with four “fat fit” and two “lean fit” blocks: Imported from Information.txt 1 1 7 4 3 9 8 5 2 6 0 C N I E W U M C W W --------------------------- 1 County | 1 | 1 | 1 1 | | 7 Newspaper | 1 | | 1 1 | | 4 Industry | 1 1 | | 1 1 | | ----------------------------- 3 Education | 1 1 | | 1 1 | 1 1 | 9 Welfare | 1 | | 1 1 | | 8 UnitedWay | 1 1 1 | 1 | 1 1 | | ----------------------------- 5 Mayor | 1 1 1 | 1 1 1 | 1 | 1 | 2 Council | 1 1 1 | 1 1 1 | 1 | | ----------------------------- 6 WRO | 1 | 1 1 | | | 10 Westend | 1 1 | 1 | 1 1 | | ---------------------------- Reduced BlockMatrix 1 2 3 4 ----- ----- ----- ----- 1 0.667 0.111 1.000 0.000 2 0.667 0.167 1.000 0.333 3 1.000 1.000 1.000 0.250 4 0.500 0.500 0.500 0.000 Rule: y(i,j) = 1 if x(i,j) >= 0.50, and 0 otherwise. Reduced BlockMatrix 1 2 3 4 - - - - 1 1 0 1 0 2 1 0 1 0 3 1 1 1 0 4 1 1 1 0 Analogous methods apply to blockmodeling valued-relations networks, but might use a maximum value, mean value, or some other cut-off criterion to recode continuous scores into the 0-1 entries of an image (p. 406-8). SOC8412 Social Network Analysis Fall 2008 5
  • 6. Blockmodel Interpretation Blockmodels are theoretical or empirical hypotheses about structural relations in a network, which refer to positions not to individual actors. W&F discuss three ways to interpret a blockmodel or its image: • Validation using actor attributes: Look for common characteristics of actors within a block that set them apart for other blocks. Does the position comprise an implicit “type of actor” to which you could fix a meaningful label? In international trade, are nations clustered by geography and/or level of economic development? One interpretation of the contrasting Indianapolis money & information exchange blockmodels is that the positions are differentiated by the organizations’ primary functions or goals. The main money recipient is the service-provider position {Education, Welfare, United Way}, while the main information targets are the elite position {County, Industry, Newspaper} and city government position {Mayor, City Council}. The neighborhood position {Welfare Rights Org and Westend} receives neither money nor information from any position, although it claims to send information to the other three. • Describe individual positions: Examine the patterns of interblock relations for clues about the social roles each position plays. Some blocks may be generic types identified by their in- and outdegree ratios (isolates, receivers, transmitters, and carriers/ordinaries), as well as by their within-block connections (see typologies developed by Burt [1976], Richards [1989], and Marsden [1989]). Other positions might be better described by interpreting the substantive contents of their multiplex relations. The Indianapolis city government position is both a money and information provider, while the power elite block is mainly a money supplier. • Image Matrices: By ignoring the individual actors and considering only the entire configuration of ties among positions displayed in the images, researchers may be able to distinguish some formal properties. White, Boorman and Breiger (1976) described 10 distinct arrangements of 0s and 1s for two-block images (W&F p. 421). Three-position images have 104 distinct image matrices; W&F apply intriguing labels to several “ideal” images (center-periphery, hierarchy, transitive). No mechanical, fool-proof method exists for interpreting blockmodels and images. As usual in network research, analysts must apply all their substantive knowledge about the system to make imaginative and insightful interpretations. SOC8412 Social Network Analysis Fall 2008 6
  • 7. Blockmodel Interpretation Blockmodels are theoretical or empirical hypotheses about structural relations in a network, which refer to positions not to individual actors. W&F discuss three ways to interpret a blockmodel or its image: • Validation using actor attributes: Look for common characteristics of actors within a block that set them apart for other blocks. Does the position comprise an implicit “type of actor” to which you could fix a meaningful label? In international trade, are nations clustered by geography and/or level of economic development? One interpretation of the contrasting Indianapolis money & information exchange blockmodels is that the positions are differentiated by the organizations’ primary functions or goals. The main money recipient is the service-provider position {Education, Welfare, United Way}, while the main information targets are the elite position {County, Industry, Newspaper} and city government position {Mayor, City Council}. The neighborhood position {Welfare Rights Org and Westend} receives neither money nor information from any position, although it claims to send information to the other three. • Describe individual positions: Examine the patterns of interblock relations for clues about the social roles each position plays. Some blocks may be generic types identified by their in- and outdegree ratios (isolates, receivers, transmitters, and carriers/ordinaries), as well as by their within-block connections (see typologies developed by Burt [1976], Richards [1989], and Marsden [1989]). Other positions might be better described by interpreting the substantive contents of their multiplex relations. The Indianapolis city government position is both a money and information provider, while the power elite block is mainly a money supplier. • Image Matrices: By ignoring the individual actors and considering only the entire configuration of ties among positions displayed in the images, researchers may be able to distinguish some formal properties. White, Boorman and Breiger (1976) described 10 distinct arrangements of 0s and 1s for two-block images (W&F p. 421). Three-position images have 104 distinct image matrices; W&F apply intriguing labels to several “ideal” images (center-periphery, hierarchy, transitive). No mechanical, fool-proof method exists for interpreting blockmodels and images. As usual in network research, analysts must apply all their substantive knowledge about the system to make imaginative and insightful interpretations. SOC8412 Social Network Analysis Fall 2008 6