This document summarizes key points about coagulation in patients with cirrhosis. Some of the main points covered include:
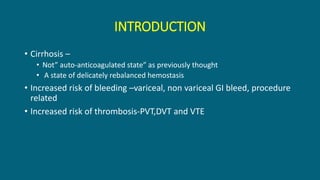
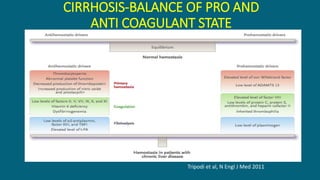
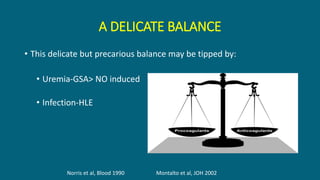
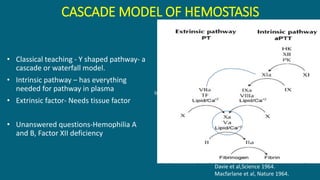
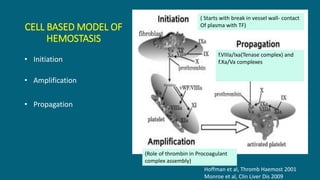
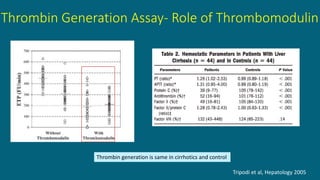
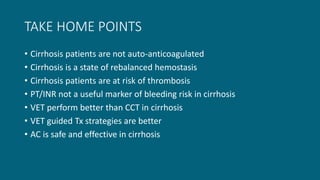
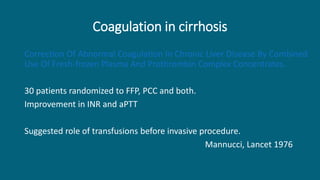
- Cirrhosis represents a state of delicately balanced hemostasis rather than an auto-anticoagulated state as previously thought.
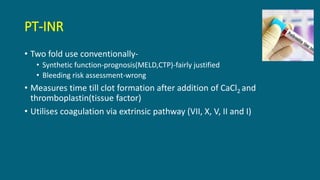
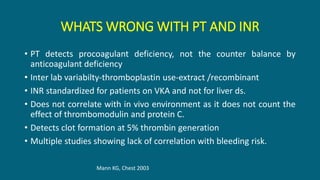
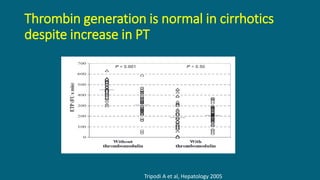
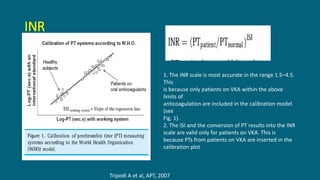
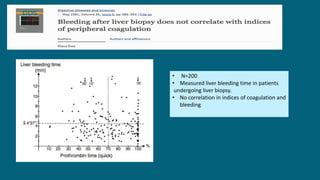
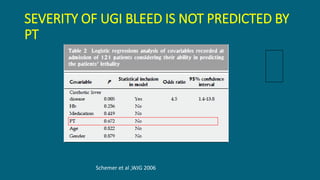
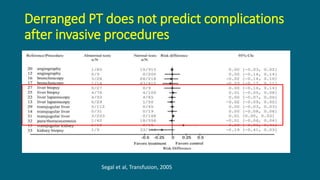
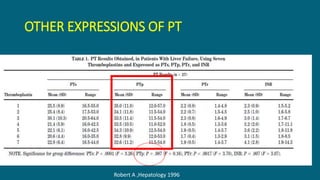
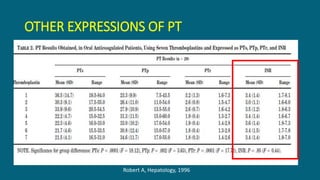
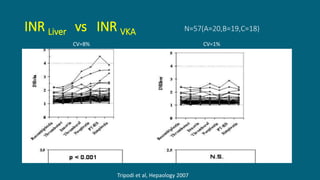
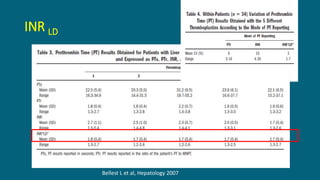
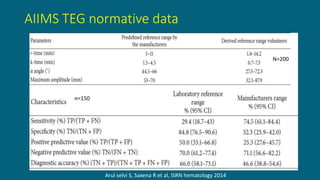
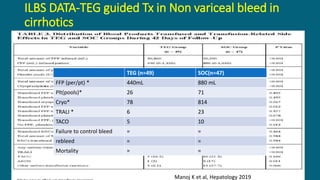
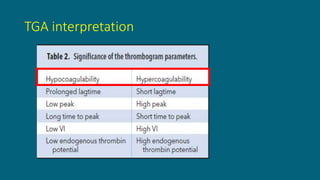
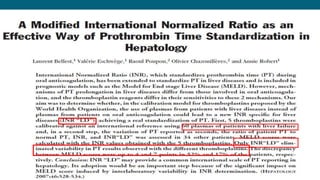
- Conventional coagulation tests like PT/INR do not accurately predict bleeding risk in cirrhosis as they do not account for the complex balance between pro- and anti-coagulant factors.
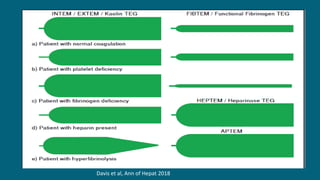
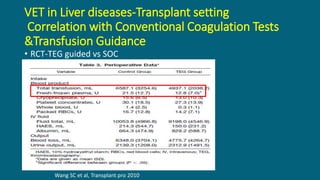
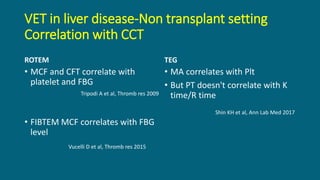
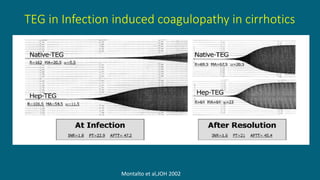
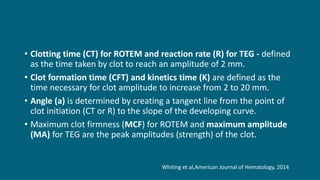
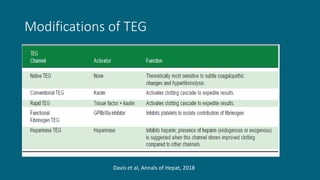
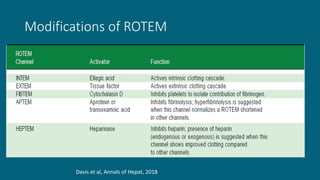
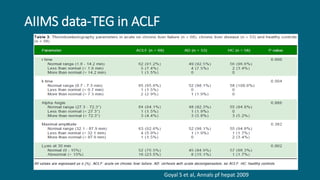
- Viscoelastic tests (VETs) like thromboelastography (TEG) and thromboelastometry (ROTEM) provide more useful information about hemostasis in cirrhosis compared to conventional tests


![Human Renal Transplantation [Dr. Edmond Wong]](https://cdn.slidesharecdn.com/ss_thumbnails/humanrenaltransplantationedmond-140716214736-phpapp02-thumbnail.jpg?width=640&height=640&fit=bounds)


![CTEV [ clubfoot] DR ARUN LAL ,DR MOHAMED ASHRAF travancore medical college k...](https://cdn.slidesharecdn.com/ss_thumbnails/ctevclubfootdrarunlaldrmohamedashraftravancoremedicalcollegekollamkeralaindia-260208063247-18fc466c-thumbnail.jpg?width=640&height=640&fit=bounds)


